Gordon T Long
Global Macro Research | Macro-Technical Analysis
MACRO
US MONETARY POLICY
AN ELLIOTT WAVE “DOUBLE COMBO – ZIGZAG” CORRECTIVE
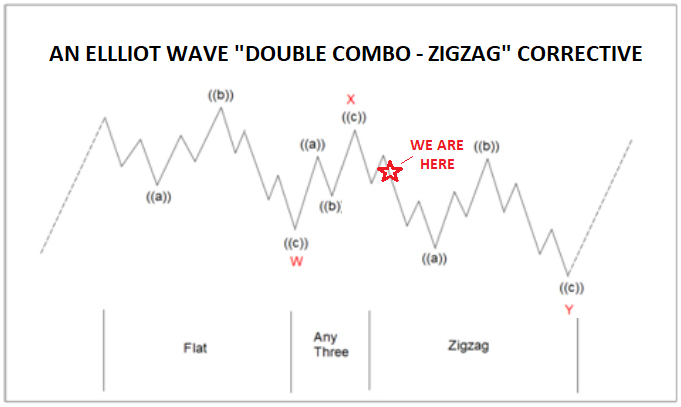
We are seeing strong evidence that we are in a classic Elliott Wave corrective pattern called a “Double Combo” or “ZigZag”. It is a fractal showing itself across multiple asset classes. It is a pattern that fits quite well with markets experiencing major long term Demographic and Cycle impacts where both price & time are important elements of the shifting sentiment involved.
The pattern also aligns with the movement in Real Rates, which is reflective of the global relative cost of money and country specific inflation & productivity potential.
=========
WHAT YOU NEED TO KNOW
 THE IMPORTANCE OF FISHER’S EQUATION
- The real rate is currently being driven primarily by a strong rising US Dollar over the last six months.
- The strong US dollar is a direct result of a “Flight-to-Safety” from poorer relative conditions in China (Yuan), Japan (Yen) and the EU (Euro).
- REAL RATES ARE CONTROLLING THE MARKETS
- Rising US nominal rates continue to spill over into lower demand for goods and services.
- We expect to see going forward Multiple Destruction (from higher rates), AND Lower Earnings (from economic slowdown).
- GOLD TELLS THE RELATIONAL STORY
- Gold historically tracks Real Rates but has recently diverged significantly. This signals further potential short term downside to gold.
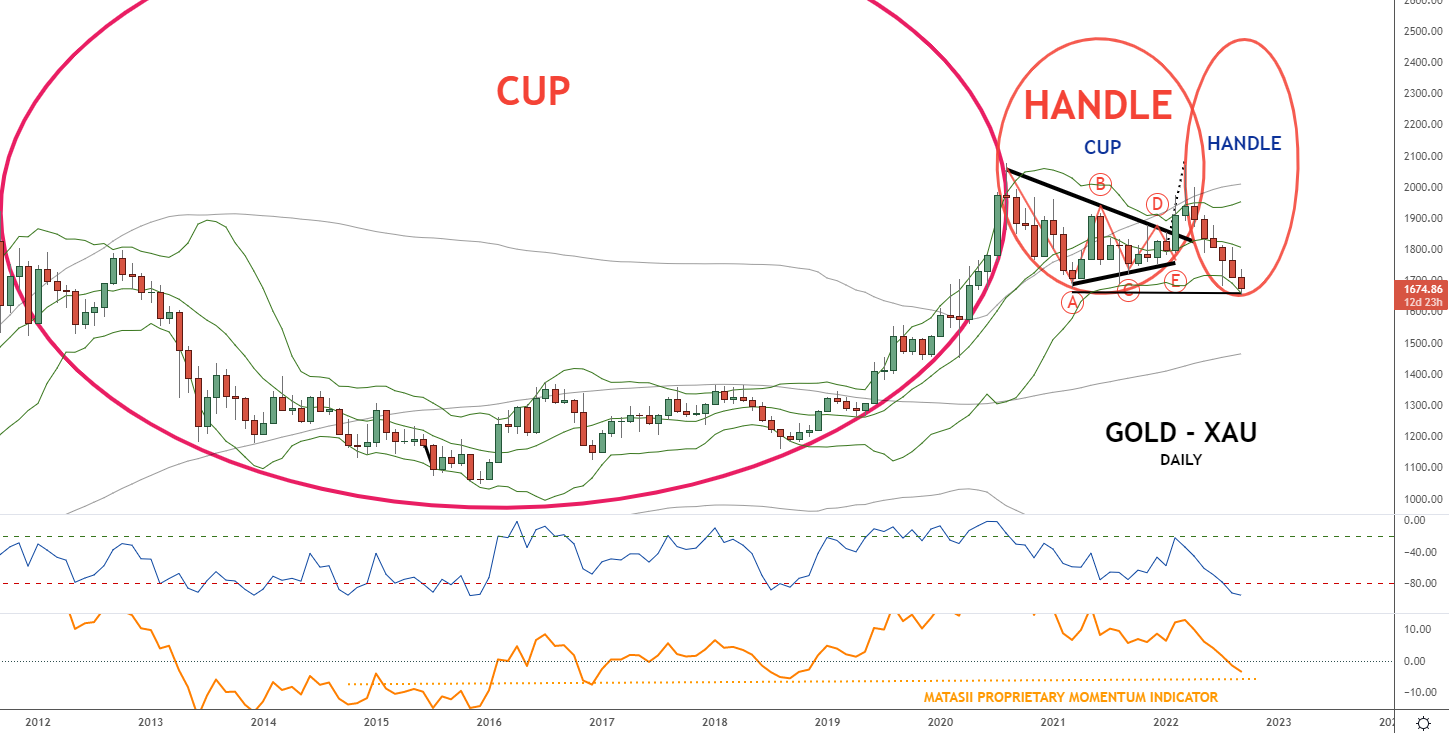
- The long term technical view of gold suggests that gold is completing a major low – a low that aligns with major “Cup & Handle” formation patterns.
- DOUBLE COMBO 3”s PATTERN
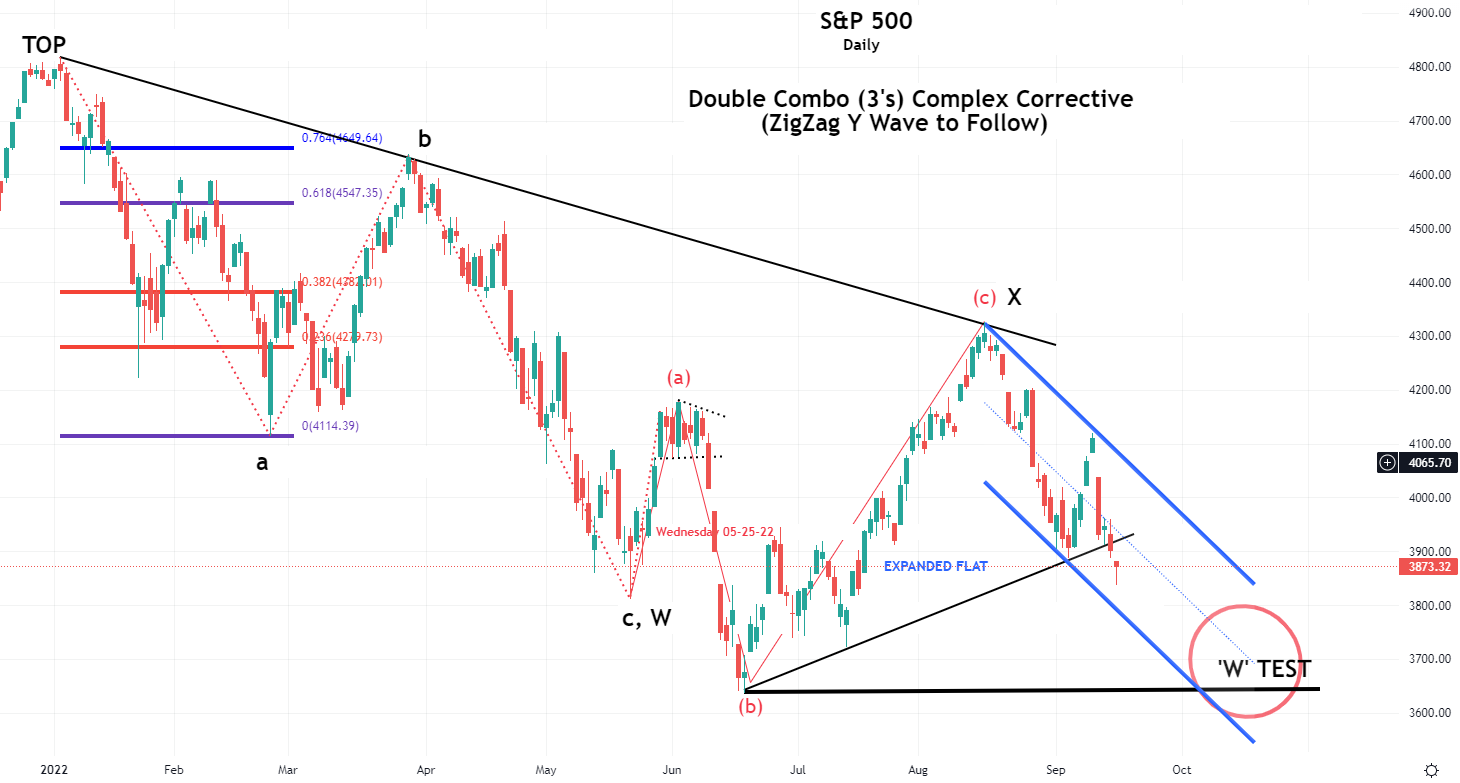
- We see the Double Combo or ZigZag pattern in the S&P 500, where it is approaching an important test of whether we are going to see an intermediate “W” bottom put in.
- We have a current conviction that the “W” bottom will fail after competing an extended “flat triangle” pattern and then head towards a market low of 3270 on the S&P 500.
- TECHNICAL CHARTS: UPDATE
- Longer Terms Demographics and Cycles are peaking or troughing concurrently!
- We have an active large degree Head and Shoulders pattern formation, which is currently testing its neckline with the completion of Q3 Quadruple Witch.
2022 US PERSONAL WEALTH EROSION IS NOW APPROACHING ~$6 TRILLION
=========
FISHER’S EQUATION
On Friday the 10Y US Treasury Note closed at a Nominal Yield of 3.45%.
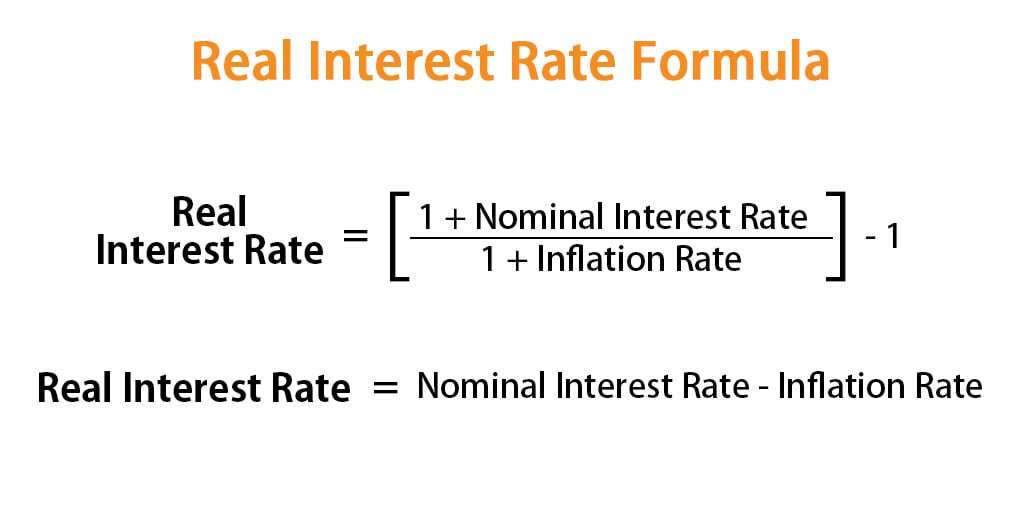 This reflected:
2.37% Inflation Break-Even
+ 1.08% Real Rate
=====
3.45% Nominal Yield
The real rate is currently being driven primarily by a strong rising US Dollar. This is not the result of a strong US economy, nor rising productivity, nor strong fiscal and monetary policies. Rather it is a direct result of a “Flight-to-Safety” from poorer relative conditions in China (Yuan), Japan (Yen) and the EU (Euro).
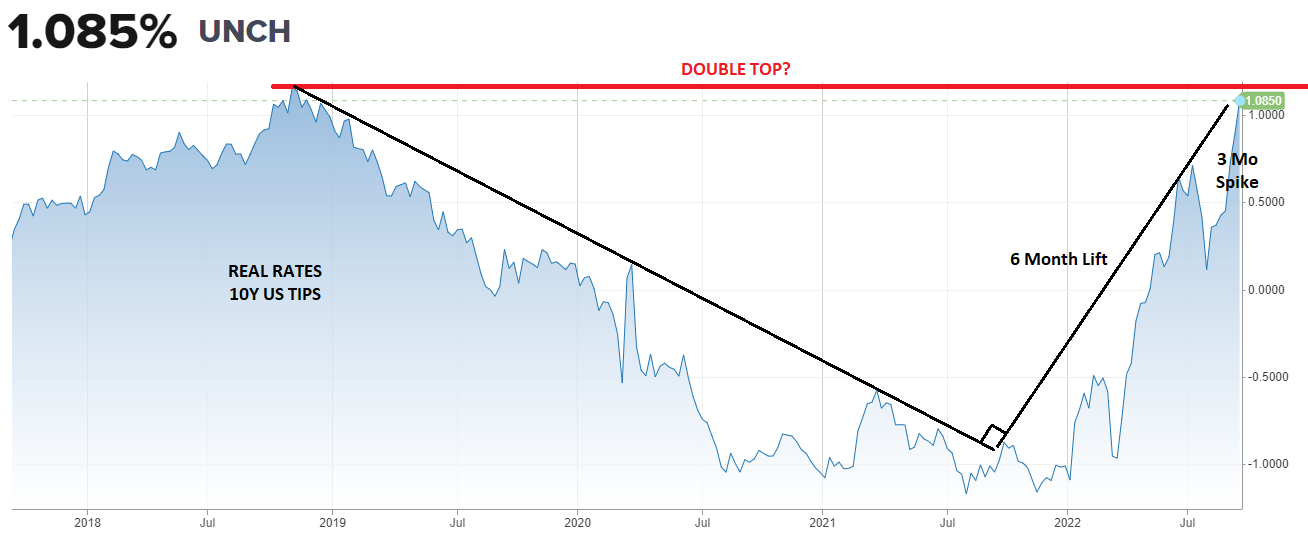
SPIKING REAL RATES CONTROLLING MARKETS
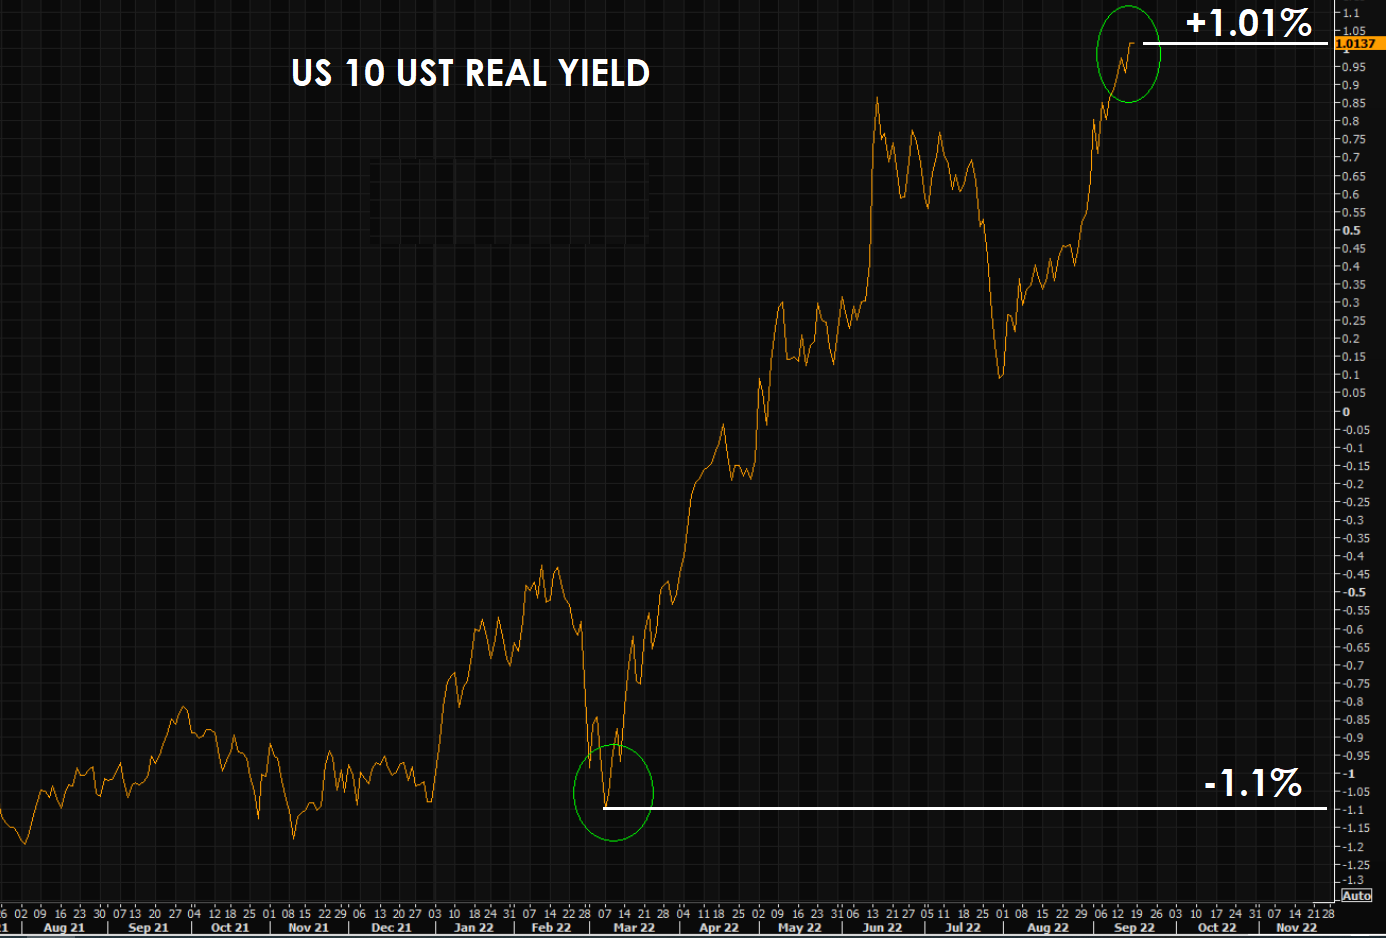 The impulsive surge higher in “Real Rates” has meant a rate-of-change shock in the “Cost of Capital,” which is slamming the brakes on the US economy via punitive borrowing costs on both Corporates and Consumers.
Rising US nominal rates continue to spill over into lower demand for goods and services. All of which means equities are potentially facing a valuation ‘Death Blow’ from the double-whammy of:
-
- Multiple Destruction (from higher rates), AND
- Lower Earnings (from economic slowdown).
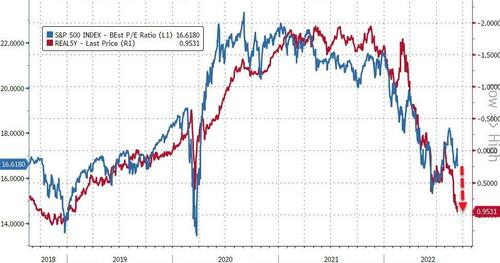 We have shown, many times in previous writings, the strong correlation of real rates with other key market drivers, indexes and components.
To the right we illustrate the close correlation of the S&P 500 to the Real 5Y Rate – a correlation signaling short term downside to the S&P 500.
GOLD AS AN EXAMPLE
Another correlation of the Real Rate is with the price of Gold/oz.
- Gold Tracking Real Rates (right) which has recently diverged significantly. This signals further short term downside to gold.
- After this divergence is closed we can expect Gold to then start rising and diverge from the S&P 500. This will occur as yields peak, markets head lower and the UIS Dollar reverses to the downside.
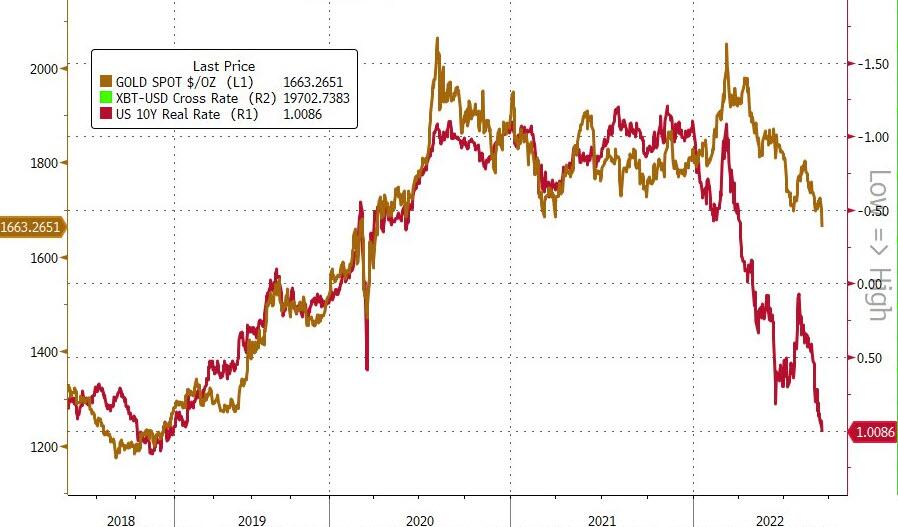
CHART RIGHT
The real rates are suggesting gold still has a long ways to fall OR real rates are nearing a near term reversal peak?
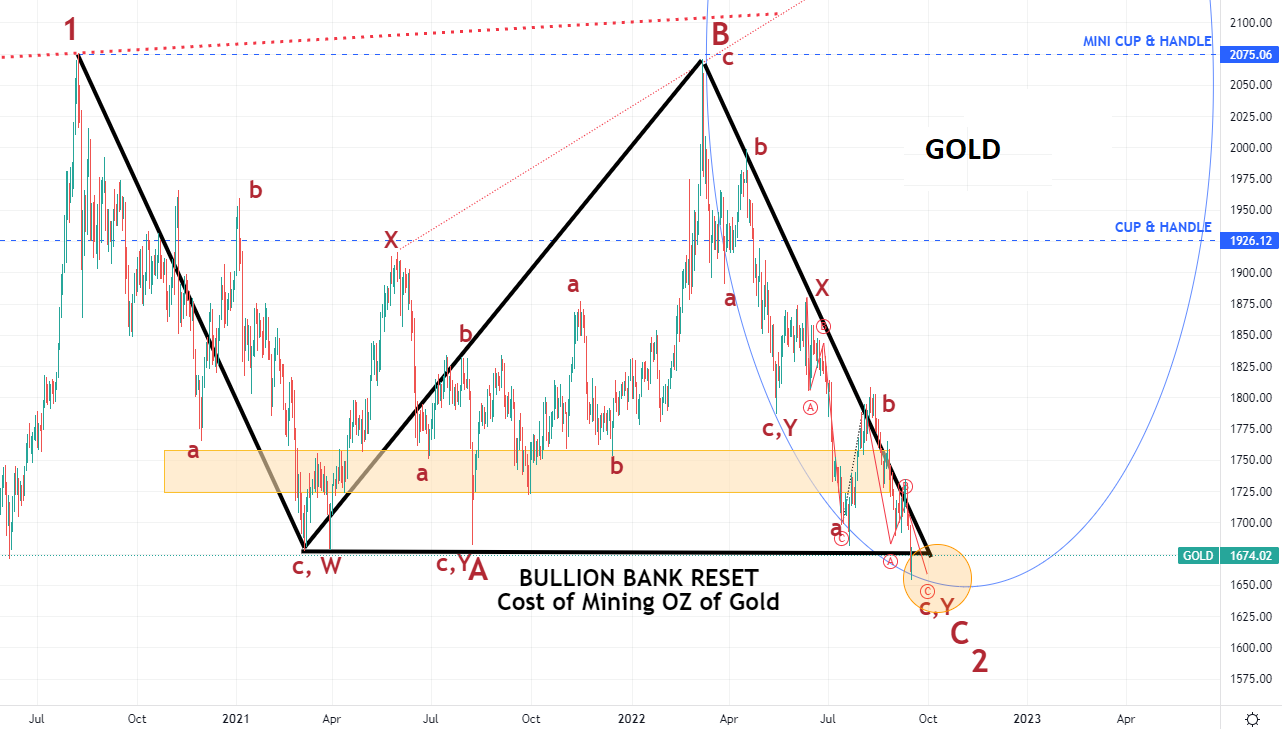
CHART BELOW
The long term technical view of gold suggests that gold is completing a major low. A low that aligns with major “Cup & Handle” formation patterns, that we show in yhe bottom of this newsletter in the “Current Market Perspectives” section.
Very importantly, gold is nearing the completion of an Elliott Wave Complex Double Combo or ZigZag pattern formation. This pattern formation is appearing in multiple types of market charts. These types of repetitive Fractals patterns are common when important reversals are near at hand.
DOUBLE COMBO 3’s PATTERN
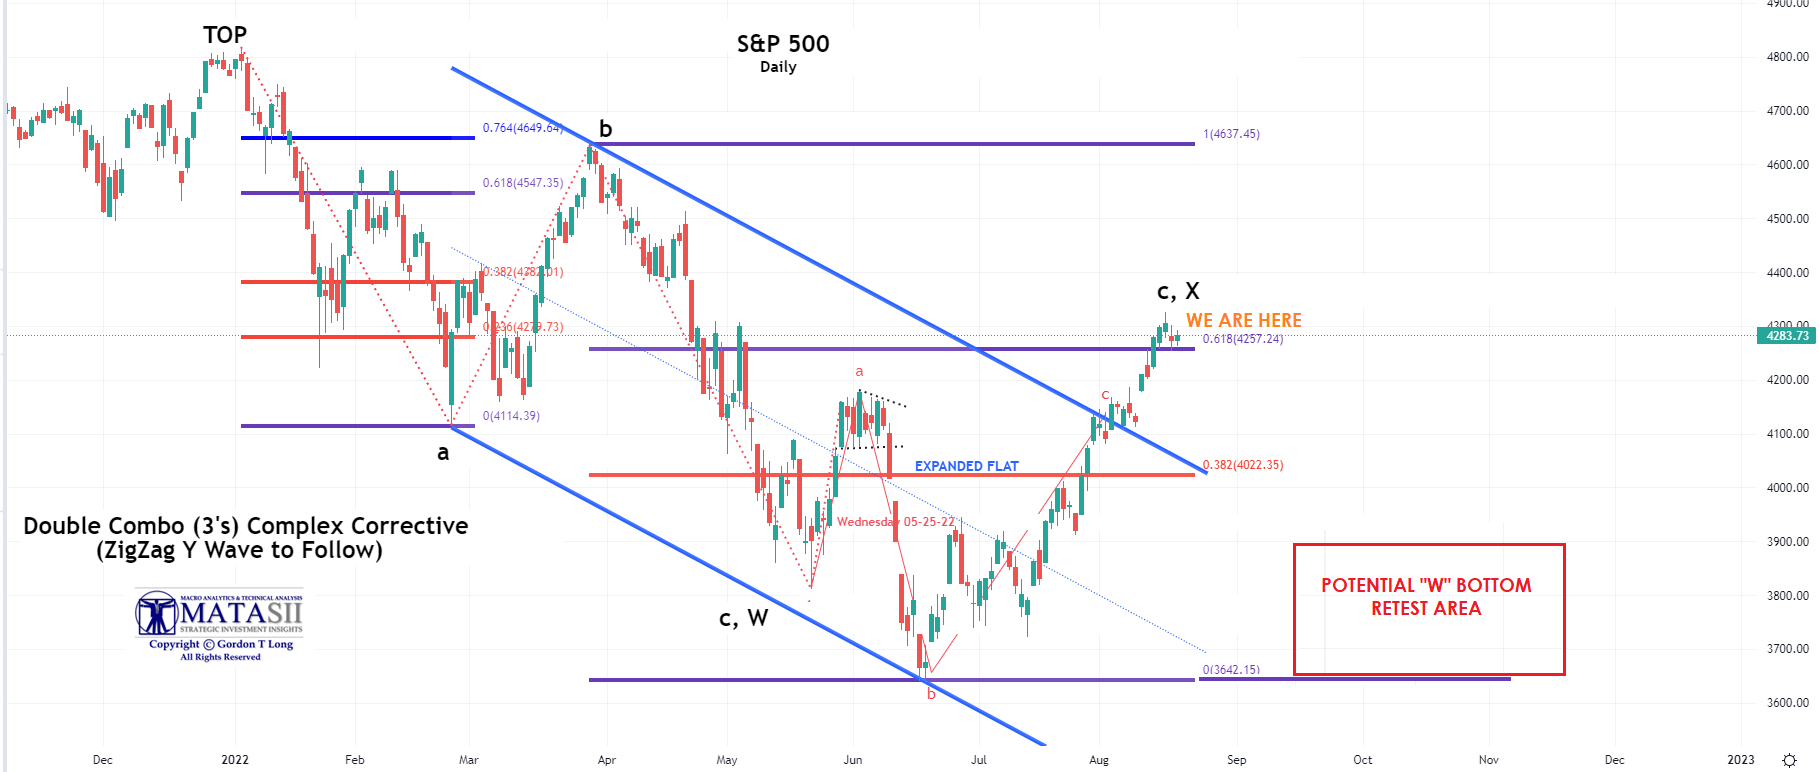 We see the Double Combo or ZigZag pattern in the S&P 500, but at an earlier stage. (chart right)
Double Combos or also called Double Zigzags subdivide into three waves and labels as W, X, and Y. Usually waves W and Y are zigzags. Wave X could form any correction pattern. Wave X is always smaller than wave W. Wave Y is always longer than wave X.
TEST OF THE LOWS: A “W” BOTTOM
We showed the ZigZag chart in a recent newsletter and cautioned of a key test in the area where the red box is labeled (chart above). We have updated that chart as shown below.
MAJOR HEAD AND SHOULDER
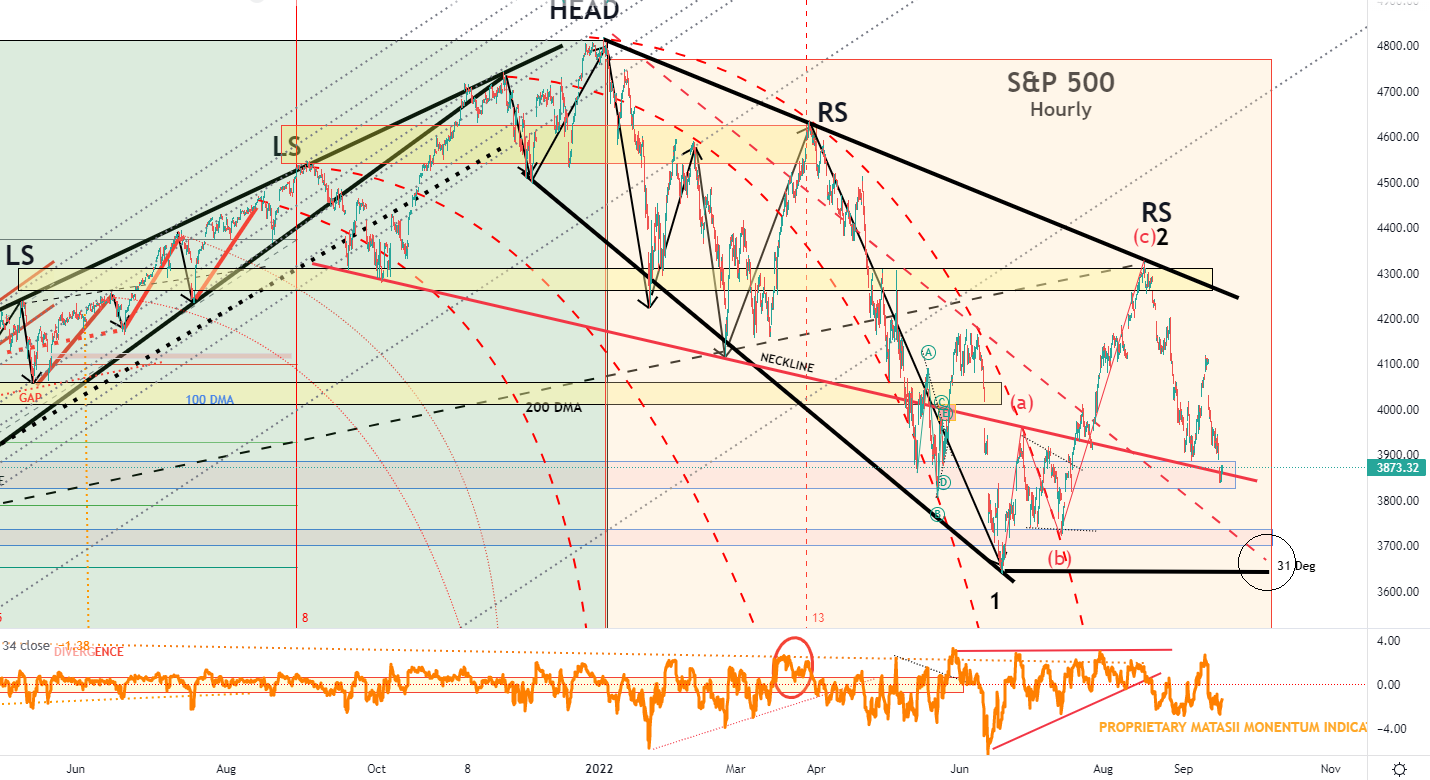 Another chart we have shown previously is updated above. It illustrates a large degree Head and Shoulders pattern formation.
The circled area in the chart is a key area in determining whether we experience a major reversal to test prior highs or whether the Zigzag formation pattern continues to our long held view that the markets are headed to 3270 in the S&P 500.
CONCLUSIONS
1- US DOLLAR
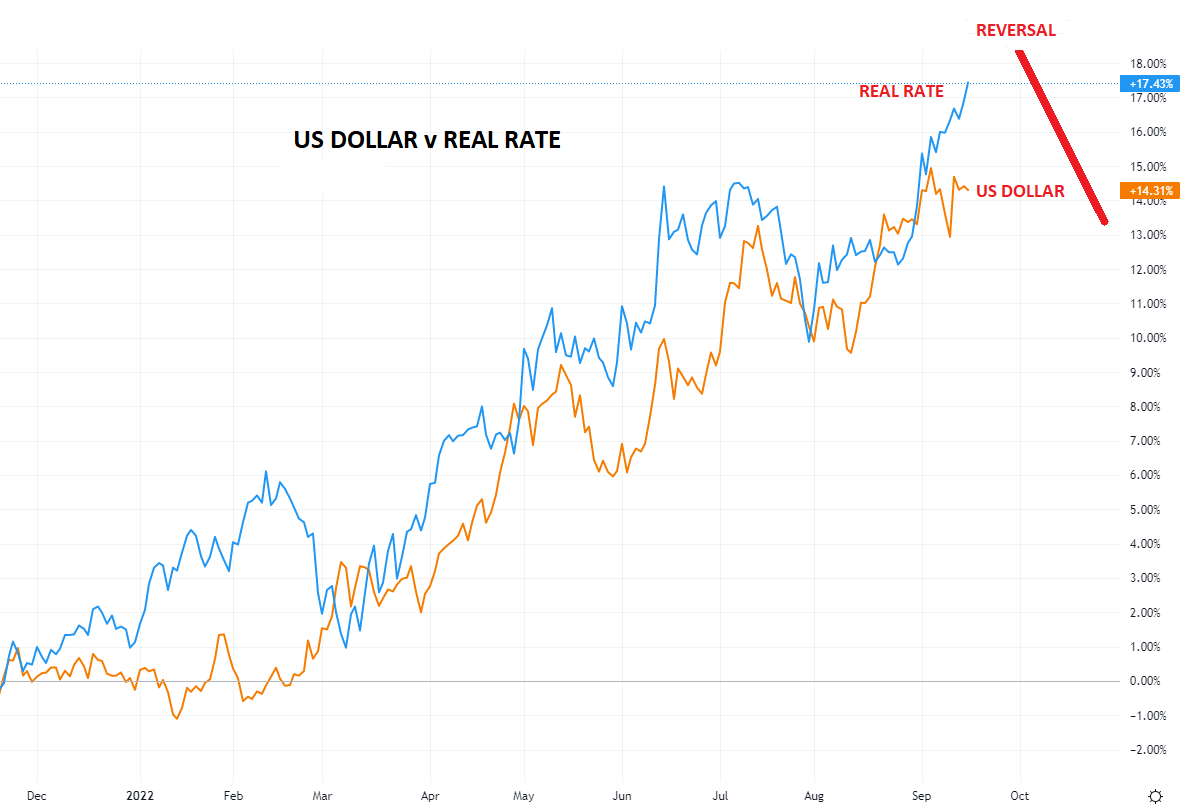 A critical determinate in whether the circled area (above) fails, is a reversal in the US Dollar. As the chart to right illustrates, the US Dollar has been a primary driver of rising US Real Rates over the last six months.
Institutional players are likely to soon begin to lock in high yield duration. With a potential to get “killed” by a US Dollar devaluation, we should expect them to hedge this risk. This has the potential of triggering a selling cascade in the dollar and US dollar denominated equities.
2 – EARNINGS
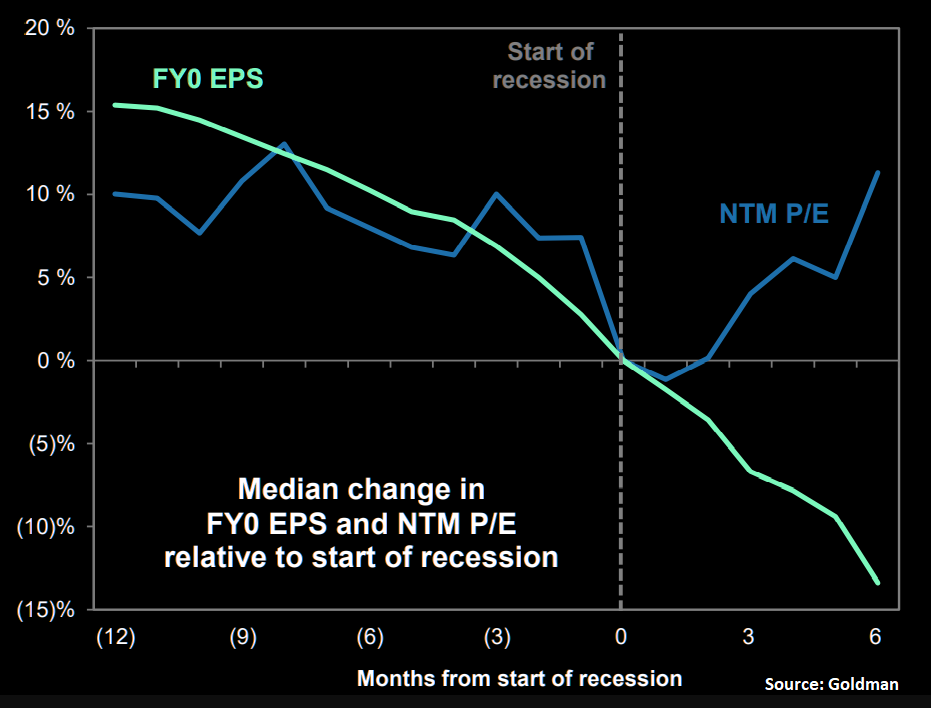 As we have also outlined in prior newsletters, the historical path of earnings and valuations around recessions is shown to the right.
Earnings typically continue to fall, but the P/E ratio stabilizes after the recession officially.
CHART BELOW
We have outlined previously that in an inflationary environment (inflation 5% or above) when earnings start to fall, then PE’S can be expected to rise. This has been happening in concert with the chart to the right when the recession starts. We have witnessed both lately as the market rebounded.
We believe this is a false early signal. Markets have further to fall AFTER completing the continuation triangle it is currently in. (SUBSCRIBER LINK TO CONTINUATION TRIANGLE CHART)
|
|
|
THE WORST IS STILL IN FRONT OF US,
EXPECT ANOTHER SHORT TERM BEAR MARKET COUNTER RALLY,
FADE THE UNFOLDING COUNTER RALLY – SELL THE RIPS.
Stay Defensive until:
-
- Initial unemployment claims are above 350k,
- Treasury yields are at or above 4%,
- Credit spreads have very much widened further,
- US dollar has backed-off.
Then pivot bullish, probably late Q1. At the lows you should:
-
- Sell the dollar.
- Buy banks,
- Buy Small caps,
- Buy EU,
- Buy EM,
- Buy Value and
- Buy New leadership of commodities.
Forget QE winners such as tech stocks…that trade is over.
LONG TERM GOLD “CUP & HANDLE” FORMATION PATTERN
YOUR DESK TOP / TABLET / PHONE ANNOTATED CHART
Macro Analytics Chart: SUBSCRIBER LINK
FAIR USE NOTICE This site contains copyrighted material the use of which has not always been specifically authorized by the copyright owner. We are making such material available in our efforts to advance understanding of environmental, political, human rights, economic, democracy, scientific, and social justice issues, etc. We believe this constitutes a ‘fair use’ of any such copyrighted material as provided for in section 107 of the US Copyright Law. In accordance with Title 17 U.S.C. Section 107, the material on this site is distributed without profit to those who have expressed a prior interest in receiving the included information for research and educational purposes. If you wish to use copyrighted material from this site for purposes of your own that go beyond ‘fair use’, you must obtain permission from the copyright owner.
NOTICE Information on these pages contains forward-looking statements that involve risks and uncertainties. Markets and instruments profiled on this page are for informational purposes only and should not in any way come across as a recommendation to buy or sell in these assets. You should do your own thorough research before making any investment decisions. MATASII.com does not in any way guarantee that this information is free from mistakes, errors, or material misstatements. It also does not guarantee that this information is of a timely nature. Investing in Open Markets involves a great deal of risk, including the loss of all or a portion of your investment, as well as emotional distress. All risks, losses and costs associated with investing, including total loss of principal, are your responsibility.