Gordon T Long
Global Macro Research | Macro-Technical Analysis
MACRO
REGIONAL ECONOMICS
CHINA’S XI JINPING RECEIVES THREE STANDING OVATIONS BY TOP S&P 500 CEOs?
OBSERVATIONS: SECRETARY JANET YELLEN IS OUTRIGHT GAMBLING WITH OUR FUTURE
In a recent newsletter entitled “Exploding US Debt Interest will require Massive Increases in Tax Revenues“, I penned in this spot “Yellen is not Simply a Misplaced Academic, It is Worse Than That!”, expressing my concerns with her ability to be US Treasury Secretary at this milestone in the future of America. It is abundantly clear we are presently barreling like an out of control freight train towards a US Debt Crisis. Janet Yellen locked in this debt crisis when, two weeks ago, she released the details of her Treasury Auctions for the next two quarters.
Next year 2024 is an election year. And Yellen is playing politics for the Biden Administration. After all, it’s hard to convince voters to re-elect someone when their 401(k)s are shrinking by the week, stocks are plummeting, a recession is resulting in unemployment surging and we are in the midst of exploding financial budget deficits thanks to her Bidenomics.
This is why Secretary Yellen chose to have the Treasury shift its issuance from its traditional breakdown of 15%-20% short-term debt & 80%-85% long-term debt to favor issuing more short-term debt for the foreseeable future. Doing this alleviates some of the pressure on long-term Treasuries as well as stocks which are priced based on the former’s yields.
This is THE reason why, since then, stocks have EXPLODED higher, with the S&P 500 rising 400 points in just two weeks. The BIG problem with this is that Secretary Yellen is choosing to rely heavily on short-term debt at a time when the Biden Administration is running its largest deficit as a percentage of GDP outside of WWII.
The U.S. has added nearly $2 TRILLION to the debt in the last 12 months alone. This is happening at a time when the Treasury is ALSO rolling over trillions of dollars worth of debt. By relying on short-term debt (12 months of less in duration), Secretary Yellen is setting the stage for an absolute disaster in late 2024/ early 2025. Why?
All of this short-term debt will be coming due between now and then. By late 2024, the U.S. will have nearly $35 trillion in debt. And if inflation hasn’t collapsed by then, all of the new short-term debt will need to be rolled over when rates are HIGH. Interest payments on the debt are already at $800 billion. What do you think will happen to them when the U.S. has $35 trillion in debt and needs to roll over a large amount of this while rates are still in the 4% range or higher?
Yellen is gambling by expecting the Federal Reserve to have made the long anticipated “Pivot” by then, has lowered the short term Fed Funds Rate dramatically and terminated Quantitative Easing. What she is speculating on is that the Longer Term Rates needed to finance the massive US debt will also have fallen. The “bet” she is making is yet another of her miscalculations.
A slowing global economy that will have necessitated the Fed taking all these actions will simply lack the financial demand to absorb this tsunami of unprecedented supply. The Treasury Auctions since her detailed release have already been a disaster and have increased the odd on her bet being right dramatically.
The long-term end of the bond market has figured this out. That is why it is now pricing long term US Treasuries as a mirror of US Credit Default Swaps for the first time in US history!
What does global money know when US debt is already more expensive than even Morocco & Vietnam??
 WHAT YOU NEED TO KNOW!
RESULTS ARE IN: “BIDENOMICS” SPIN A MEDIA FAILURE
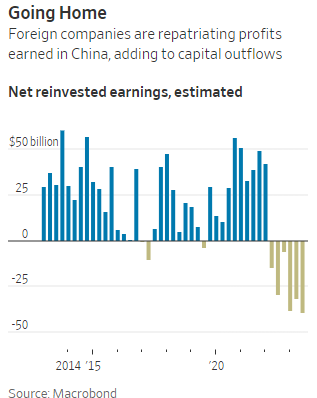
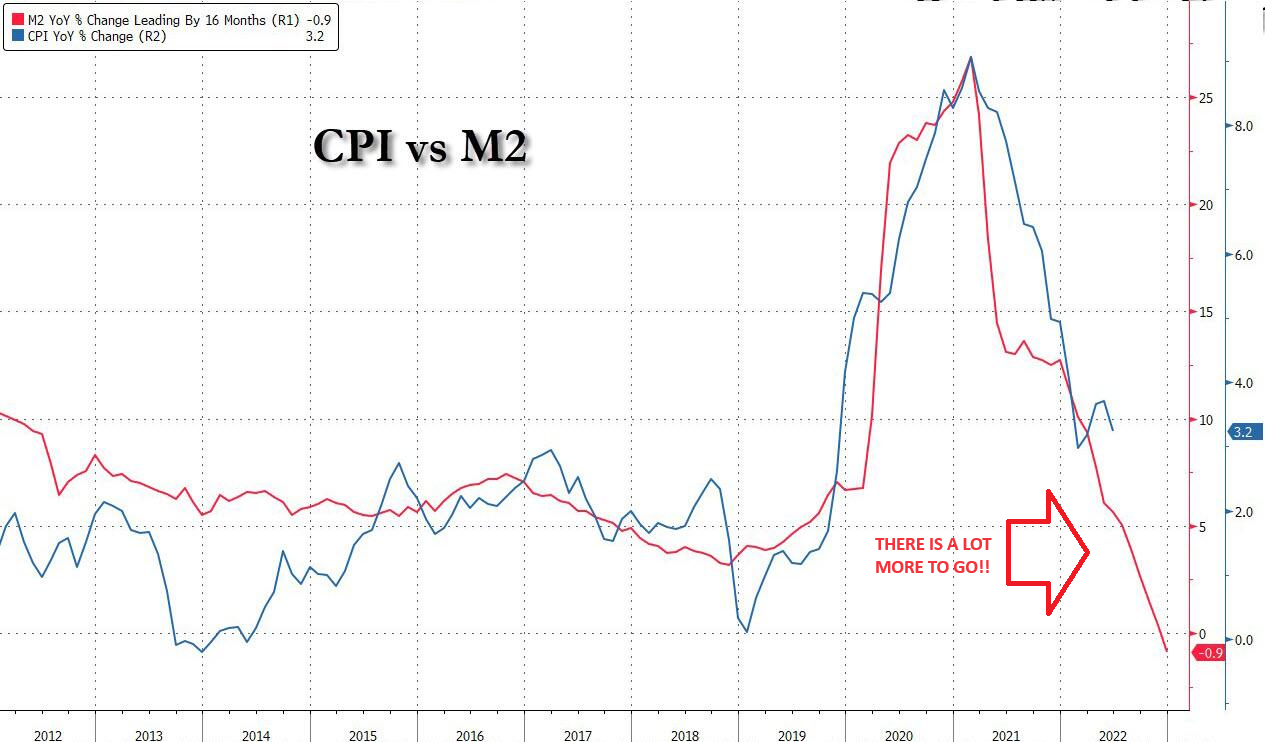
Have you wondered why other than in this newsletter Bidenomics has disappeared from media coverage? According to Politico, members of the Progressive Change Campaign Committee (PCCC) visited the West Wing in September and October and delivered a stark warning: The economic policies often referred to as “Bidenomics” were not resonating with most Americans. 7 out of 10 people surveyed believed the economy wasn’t getting better — even after they were explicitly told that inflation had eased and unemployment sat near record lows. That preface, designed specifically to persuade voters to brighten their view of the economy, did not even move them! The chart above nets out why.
RESEARCH
IS THE FED DONE AND RATES PEAKED JULY 26th?
-
- It’s likely that we’ve now morphed into a structural decline in market rates and a steeper curve.
- Most of the time a peak for the Fed, (we believe was on July 26th), correlates with a subsequent tendency for market rates to fall – it tends to be a good time to get long.
- Latest headline consumer price inflation has fallen to 3.2% and the latest 3 month annualized reading for the core personal consumer expenditure deflator is at 2.5%. That’s bang on the 20yr average for US inflation.
- The Federal Reserve does not need to hike rates further in order to sustain the pressure already beginning to be felt by the economy. As these pressures build, concern morphs away from inflation and towards sub-trend growth, and possibly recession.
DO YOU BELIEVE CHINA’S XI JINPING??
-
- China’s President was extraordinarily conciliatory at his meeting with President Biden in San Francisco?
- This was not the leader that over the last 6 years has shown contempt for the US and imposed increasingly anti-corporate policies. What has changed?
- What has changed is the Chinese Economy is in serious trouble. With ~ 43% of the Chinese economy depending on Foreign Investment, it can presently ill afford to limit continued US corporate investment or repatriation of US corporate earnings.
- Increasing geopolitical tensions are hampering China’s ability to attract FDI and instead favoring emerging markets that are more friendly to the West.
- Direct investment liabilities – a broad measure of FDI that includes foreign companies’ retained earnings in China – were a deficit of $11.8 billion during the July-September period, according to preliminary balance of payments data.
- A range of other factors have contributed to the profit exodus:
- Chilly relations between Beijing and the U.S.has led global companies to rethink their supply chains and exposure to China.
- Corporates are beginning to de-risk from China.
- Companies have also been pulling back on investment in China last year as the country rolled out pandemic restrictions. While those curbs have been removed, firms are still contending with other challenges from rising manufacturing costs in China and regulatory hurdles, as Beijing scrutinizes activity at foreign corporations due to national security concerns.
- Many foreign firms are looking for better uses for their money, as China’s economy slows. A widening gap between China’s interest rates and those in the U.S. and Europe has made it more attractive to park earnings in the West. While the Fed and other central banks have been raising rates to fight inflation, China has been cutting them as policy makers battle a prolonged downturn in its real estate market.
CHINA IS IN ECONOMIC TROUBLE AND THIS WAS A LEADER NEEDING US INVESTMENT TO CONTINUE!
GLOBAL ECONOMIC REPORTING: What This Week’s Key Global Economic Reports Tell Us?
-
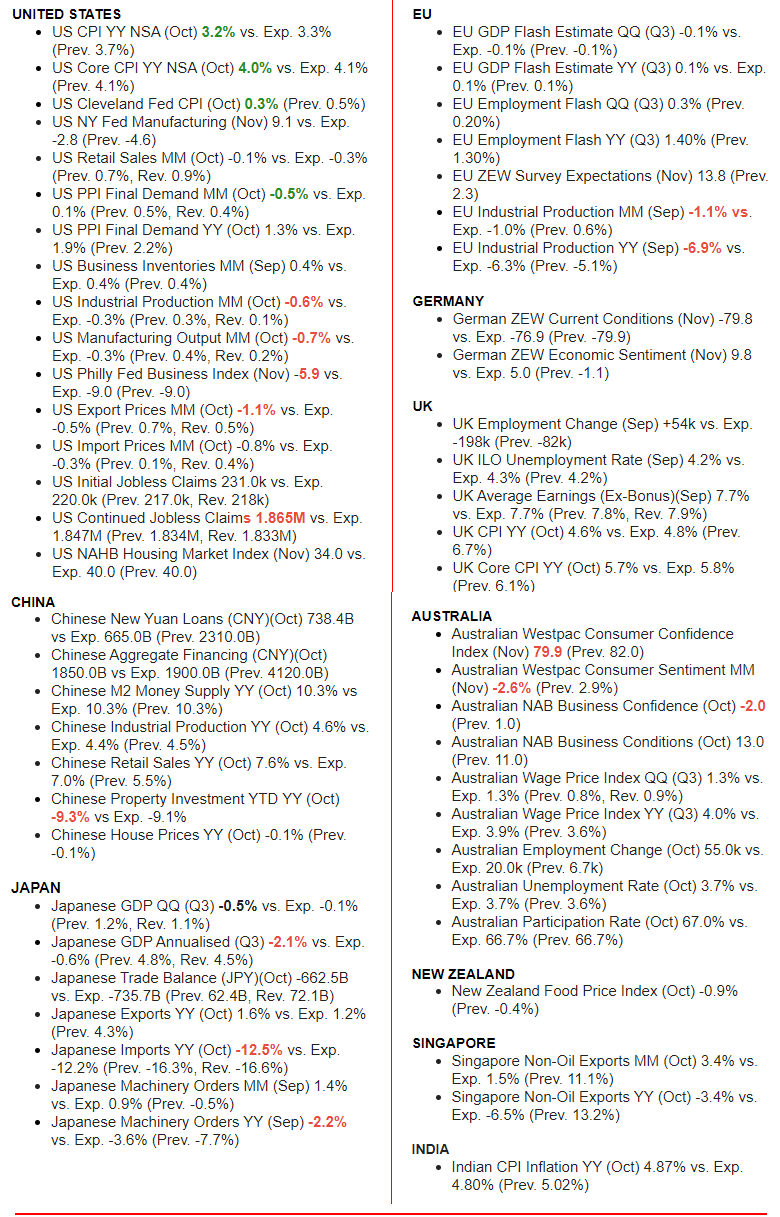
- CPI: US CPI YY NSA (Oct) 3.2% vs. Exp. 3.3% (Prev. 3.7%)
US Core CPI YY NSA (Oct) 4.0% vs. Exp. 4.1% (Prev. 4.1%)
US Cleveland Fed CPI (Oct) 0.3% (Prev. 0.5%)
-
- PPI: US PPI Final Demand MM (Oct) -0.5% vs. Exp. 0.1% (Prev. 0.5%, Rev. 0.4%)
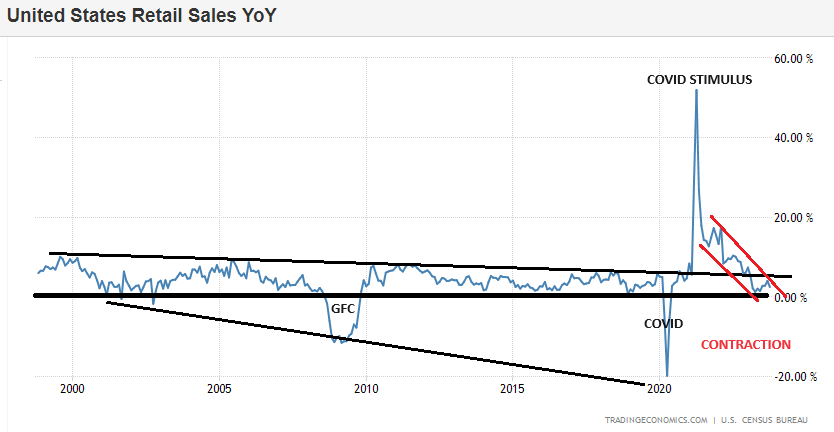
- RETAIL SALES: US October Retail Sales were not as bad as feared, falling 0.1% (exp. -0.3%), with prior revised up to +0.9% from +0.7%. The core beat at +0.1% M/M (exp. 0.0%) with the prior revised up to +0.8% from +0.6%.
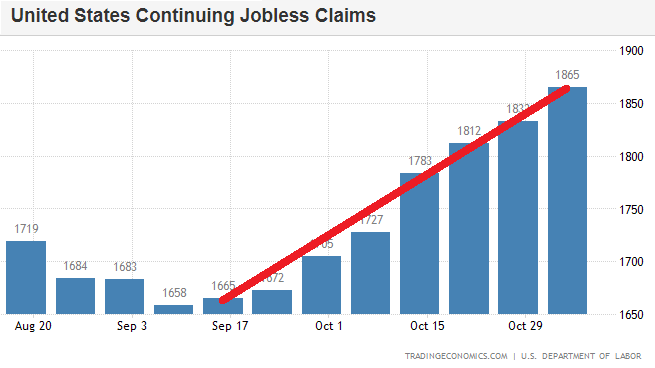
- JOBLESS CLAIMS: The continued claims data continues to rise, up to 1.865mln from 1.833mln, above the 1.847mln forecast, showing that those who are claiming unemployment benefits may be struggling to return to the labor market.
DEVELOPMENTS TO WATCH
WARNING ALERTS: “The Rate of Change”
We are witnessing the rate of change of key financial indicators that are sending strong warnings alerts, suggesting:
-
- The US Treasury has a funding problem in attracting sufficient buyers of the existing roll-over debt and surging new deficit spending.
- This problem is quickly becoming systemic (size of global demand versus US supply) and structural (Bank Primary Dealers ability to absorb auction shortfalls).
- US debt is increasingly being financed with short duration Bills versus longer duration Notes and Bonds leaving the US Treasury exposed to high interest payments and chronic budget deficits.
THE $2 TRILLION GLOBAL SHOCK: Government Budgets Can’t Handle This!
-
- Increasing Interest costs are crowding out critical funding for productive investments which deliver profits (savings) that increase the standard of living. The aggregate global standard of living will therefore come under increasing pressure. The global GDP is ~ $101T with global debt at ~ $35T. It cannot absorb $3T in interest expense without structural problems.
- “Every dollar that’s going to pay debt service is not a dollar that’s going to help education, to building infrastructure that will create growth. You see increases in poverty.”
IS THE FED DONE AND RATES PEAKED JULY 26th?
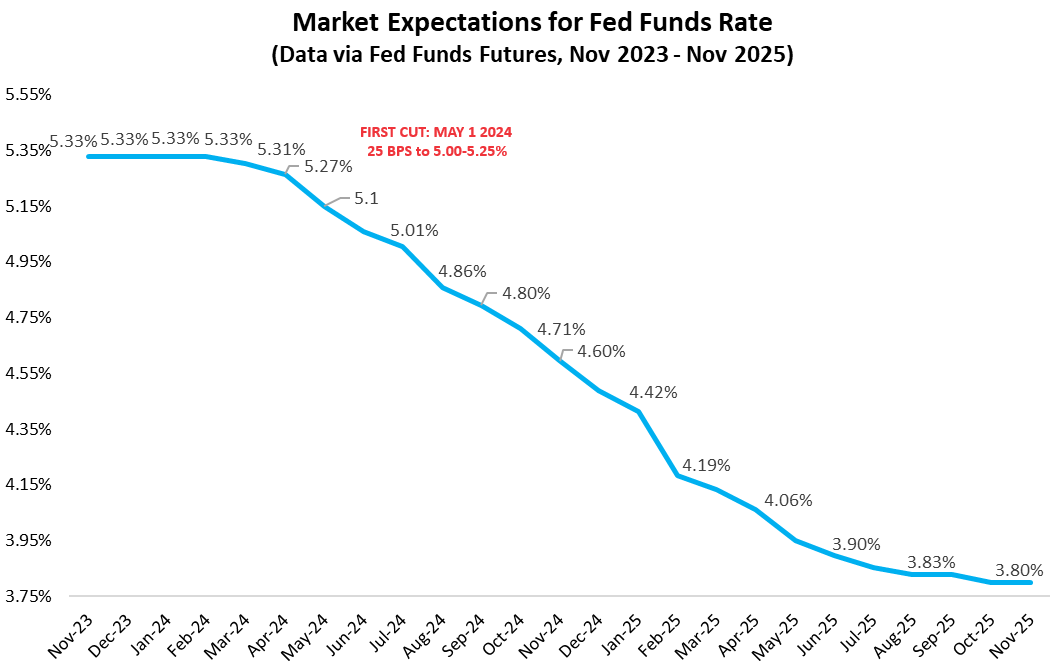 Have market rates peaked in the United States? Most probably yes. The 10Y hit 5% and the 2Y got to 5.25% in the past month or so. A move back toward 5% is not improbable for the 10yr, but it’s more likely that we’ve morphed into a structural decline in market rates and a steeper curve.
The Federal Reserve is likely done too. If true, the Fed has in fact been done since July 26th this year and has been at a peak rate for almost four months now. When the Fed peaks, it’s a key moment for markets. Most of the time a peak for the Fed correlates with a subsequent tendency for market rates to fall – it tends to be a good time to get long.
How convinced are we that the Fed has peaked? You can never be 100% sure on this, but the odds firmly favor the view that they’re done. Latest headline consumer price inflation has fallen to 3.2% and the latest 3 month annualized reading for the core personal consumer expenditure deflator is at 2.5%. That’s bang on the 20yr average for US inflation. It has to be said that the US has managed a remarkable easing in inflation, despite the ongoing firmness in the labor market.
But that labor market firmness won’t last. Every day the effective funds rate remains at 5.3%, the pressure builds on the typical credit card debt holder that finds themselves paying rates in excess of 20%. All debt holder subject to re-sets at higher rates face similar issues, ones that won’t go away as the Fed holds. Also, falling inflation does not mean falling aggregate prices, so living standard pressures from high prices remain. The transmission mechanism to the economy is through higher delinquencies and a wider lower spending link in consequence.
The Federal Reserve does not need to hike rates further in order to sustain the pressure already beginning to be felt by the economy. As these pressures build, concern morphs away from inflation and towards sub-trend growth, and possibly recession. That places rate cutting on the radar. Ahead of that, market rates tend to ease lower. And once we are about three months ahead of an actual cut, the 2yr yield will gap lower – it can move lower by 100bp in a matter of days and keeps going.
The engine that drives this is the Fed cutting from 5.5% currently to 3% by mid-2025 (starting by mid-2024). Market rates anticipate a lot of this ahead of time. The anticipatory move lower on the front end is where value comes from exposure to paying floating rates for liability managers. And for asset managers, that means lower funding costs, and moreover, downward pressure on longer tenor rates that are pulled lower by shorter tenor ones.
If that all plays out, then being long is the way to go in the coming few months. A mini back-up in market rates is far from improbable, as the deficit pressure has not gone away and the economy has not exactly imploded. We’d use any such back-up as an opportunity to average in, adding to interest rate exposure for asset managers and to floating rate liabilities for liability managers.
EXPECTED INSTITUTIONAL REACTION
Getting long can take on many guises to Institutional Investment Managers:
-
- For ASSET MANAGERS this means buying longer dated higher quality securities, even into an inverted curve, as this means locking in existing running yield for longer.
- For LIABILITY MANAGERS, getting long means setting fixed rate receivers, which is effectively like a funded long in a bond.
- It’s also code for SWAP TO FLOATING, where exposure to falling official rates is sought.
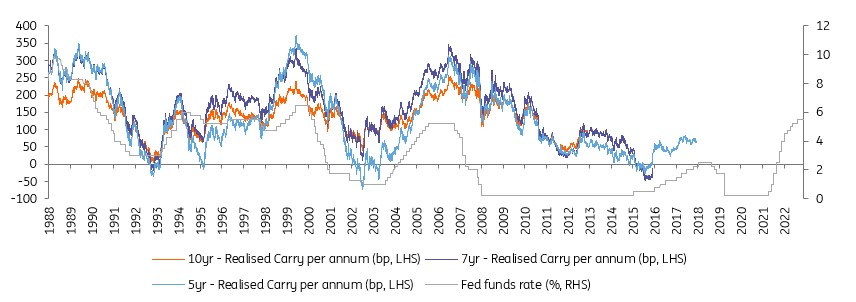
- CARRY TRADE It’s no surprise that over the long term being exposed to floating rates is the cheapest form of funding. Despite the volatility that is implied, an average upward sloping term structure tends to result in a lower cost of funding. In fact, there is no example of a 10Y fixed rate receiver resulting in negative carry at any time over the past number of decades, (as 10 years is long enough for floating rates to on average be lower than the 10Y rate that has been locked in). Moreover, when the Federal Reserve is at a peak, realized carry on fixed rate receivers tends to be maximized (graph below). It’s the opposite when we are at the bottom of the rate cycle, as this is the optimal time to set a swap to a fixed rate payer. Similarly, for the asset manager, this is the best time to be short on interest rate exposure, as the path ahead then is for the Fed to be hiking rates and pushing market rates higher. That’s for another day. Today we’re concerned with the peak in the cycle.
DO YOU BELIEVE CHINA’S XI JINPING??
CHINA IS IN ECONOMIC TROUBLE AND THIS WAS A LEADER NEEDING US INVESTMENT!
 Xi’s introductory words were interesting, remembering it has been 6 years since he bothered to visit the US:
The Chinese president said his country’s relationship with the U.S. has “never been smooth sailing” over the last 50 years, “yet it has kept moving forward” with twists and turns.
“It is unrealistic for one side to remodel the other, and conflict and confrontation has terrible consequences for both sides,” he said. “The world at large is big enough for the two countries to succeed.”
TERRIBLY CONCILIATORY BASED ON RECENT COMMUNIQUES
-
- Chinese President Xi said China has no plan to replace the US and that he hopes the two countries can be partners, respect each other and coexist peacefully. Xi added that both sides should have more dialogue, discuss more and handle differences calmly, as well as promote mutually beneficial cooperation in fields, including the economy, trade, agriculture, climate change and AI. Furthermore, he said the US should stop arming Taiwan and support China’s peaceful reunification with Taiwan, while he hopes the US will lift its unilateral sanctions and provide a fair and just environment for Chinese companies.
- Chinese President Xi said during his APEC address that the door of US-China relations cannot be shut and the world needs China and the US to work together. Xi also stated China is ready to be a partner and friend of the US and that the US should not bet against China, while he added that there is plenty of room for US-China cooperation and that it is wrong to view China as a threat and play a zero-sum game.
- US senior administration official said the Biden-Xi meeting lasted for over 4 hours and both leaders acknowledged that they want to keep lines of communication open, while there are no plans for another visit between Biden and Xi at this time, although they kept the door open to it.
- China’s state planner said it will continue to expand domestic demand and promote high growth in services consumption. NDRC added it will coordinate the link between macro policies this year and next year and make sure there is a good start to the economy in 2024, while it will roll out policy measures to attract foreign investment with bigger efforts and will increase household income in urban and rural areas, as well as improve consumption capability of low- and mid-level income groups.
- “China’s Ministry of Commerce said on Thursday it will implement tariff reduction and exemption for imported equipment for foreign investment projects encouraged by the government”, according to Global Times. “The Ministry also urged responsible authorities to study relevant policies encouraging foreign investment and help the involved enterprises to report corresponding projects in accordance to national policies.”
- US President Biden said talks with Xi were constructive and productive, while they made real progress and are restarting cooperation on counter-narcotics, as well as resuming military-to-military contact. Biden also raised concerns about people detained in China and about China’s human rights abuses in Xinjiang, Tibet and Hong Kong. He emphasised the US would take actions to prevent US technology from being used to undermine US security. He also said that Chinese President Xi is a dictator.
BOTTOM LINE
Xi Jinping presumably hopes more soothing rhetoric and more moderate diplomacy will undercut momentum toward tougher policies by the US. A few small comforting things were agreed to. They were enough to make military strategists relax slightly and retreating corporate investors give China a second look.
WHY XI JINPING’S WANTED TO (MUST) SPEAK TO US CEO’S
From 1960 to 2021, China’s average capital investment as a percentage of GDP was 36.34%. The minimum was 15.74% in 1962 and the maximum was 46.66% in 2011. The latest value from 2021 was 42.84%.
However this level of contribution to Chinese GDP is under serious threat for two reasons: i) Global De-Risking Strategies and ii) Slowing Chinese Growth.
 1- CHINA: DE-RISKING STRATEGIES REPATRIATING CHINESE EARNINGS
-
- A range of factors have contributed to the profit exodus, economists and corporate executives say. Those include a widening gap between China’s interest rates and those in the U.S. and Europe that has made it more attractive to park earnings in the West. While the Fed and other central banks have been raising rates to fight inflation, China has been cutting them as policy makers battle a prolonged downturn in its real-estate market.
- Many foreign firms are looking for better uses for their money, as China’s economy slows and geopolitical tensions rise.
- Chilly relations between Beijing and the U.S.-led West have pushed global companies to rethink their supply chains and exposure to China.
- “Corporates are beginning to de-risk from China,” said Peter Kinsella, global head of foreign-exchange strategy at Union Bancaire Privé.
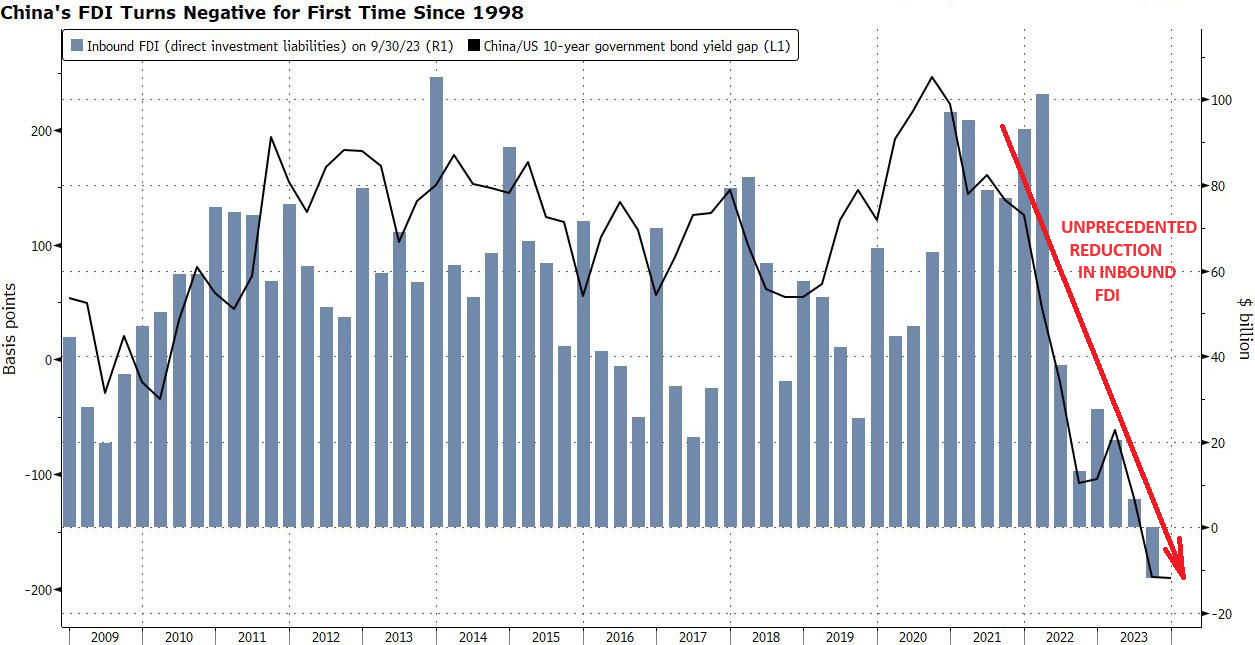 2- CHINA: UNPRECEDENTED REDUCTION OF INBOUND FDI
-
- Direct investment liabilities – a broad measure of FDI that includes foreign companies’ retained earnings in China – were a deficit of $11.8 billion during the July-September period, according to preliminary balance of payments data.
- Increasing geopolitical tensions are hampering China’s ability to attract FDI and instead favor emerging markets that are more friendly to the West.
- Aside from geopolitical risks, companies have also been pulling back on investment in China last year as the country rolled out pandemic restrictions. While those curbs have been removed, firms are still contending with other challenges from rising manufacturing costs in China and regulatory hurdles, as Beijing scrutinizes activity at foreign corporations due to national security concerns.
“Some of the most damaging things have been the abrupt regulatory changes that have taken place,” according to reportng pointing to this year’s anti-espionage campaign, which resulted in some firms having their offices raided by local authorities.
“Once you damage the sort of perception of the business environment, it’s quite difficult to restore trust. I think it will take some time.”
While foreign companies make up less than 3% of the total number of corporations in China, they contribute to 40% of its trade, more than 16% of tax revenue and almost 10% of urban employment, state media has reported. They’ve also been key to China’s technological development, with foreign investment in the country’s high-tech industry growing at double-digit rates on average since 2012, according to the official Xinhua News Agency.
“A decline in trade and investment links with advanced economies will be a particularly significant headwind for a catching up economy such as China, weighing on productivity growth and technological progress.”
Since youth unemployment – the single, most direct precursor to the one thing Beijing fears most of all, social unrest – is already at an all time high and will continue to rise, (even if China will no longer report on what it is), the likelihood that Beijing will pursue some bazooka stimulus, both fiscal and monetary, only grows with every month that Beijing does not pursue such a critical, if temporary, measure to prevent catastrophe.
READ: More Executives Vanish in China, Casting Chill Over Business Climate WSJ 11/09/23
CHINA WITH 43% OF ITS ECONOMY DEPENDENT ON FOREIGN INVESTMENT DESPERATELY NEEDS TO KEEP US INVESTMENT IN CHINA GOING (AT LEAST TEMPORARILY)!
GLOBAL ECONOMIC INDICATORS: What This Week’s Key Global Economic Releases Tell Us
 CPI
CPI
Core inflation dropped to its lowest level in two years. This resulted in a major market event reflected by:
-
- Triggered Fed swaps pricing in 50 basis points in rate cuts for the July 2024 FOMC meeting,
- The dollar was pounded down 1%, its most significant decline in a year. The Bloomberg dollar index collapsed – the biggest daily drop since Nov. 11, 2022.
- Gold jumped about 1% to $1,964 an ounce as the dollar dumped.
- US equity futures erupted after the CPI print – sending S&P500 and Nasdaq futures up as much as 2%. Dow Jones futures were up 1.5%.
- About 95% of companies in the S&P 500 were green in the session, with the index up 2%.
- The market no longer is pricing in any more rate hikes in December or otherwise and instead, it is now giving roughly 25% odds to a rate cut in March and has fully priced in two rate cuts by July. (It takes 8 months on average from the last rate hike to the first rate cut. So that suggests March).
- The October payroll report and inflation report strongly suggest the Fed’s last rate rise was in July. The big debate at the next Fed meeting is shaping up to be over whether and how to modify the post meeting statement to reflect the obvious: the central bank is on hold.
- INFLATION BREAKEVENS: 5yr BEI -5.0bps at 2.243%, 10yr BEI -3.4bps at 2.303%, 30yr BEI -3.9bps at 2.399%.
 THE ACTUAL REPORTED RESULTS
-
- US CPI was cooler than expected in October, offsetting some fears of a hotter print due to the annual adjustments.
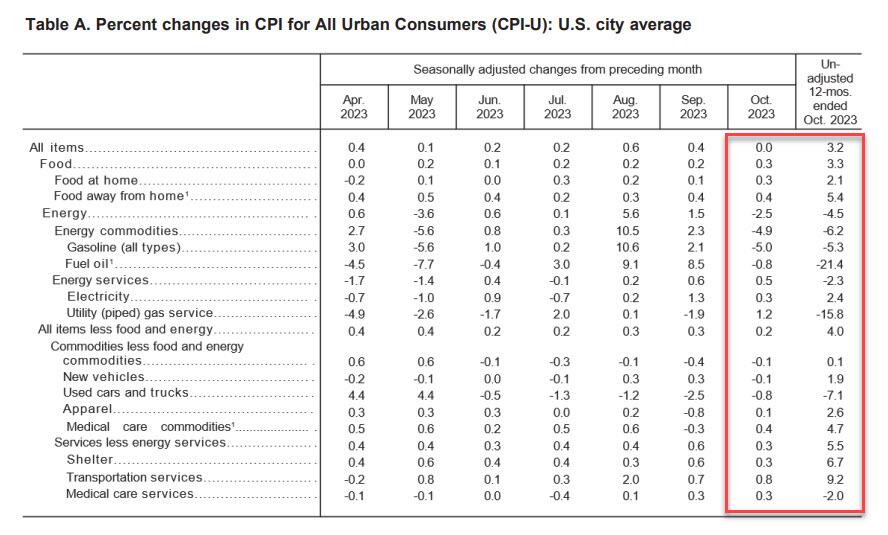
- Headline M/M prices were flat in October, beneath the expected +0.1% rise and cooling from September’s +0.4%, while the Y/Y eased to 3.2% from 3.7%, beneath the 3.3% forecast.
- The core metrics were also soft despite risks of upward pressure due to medical care annual adjustments: Core M/M rose 0.2%, softer than the prior and expected 0.3%, while Core Y/Y rose 4.0%, beneath the prior and expected 4.1%.
-
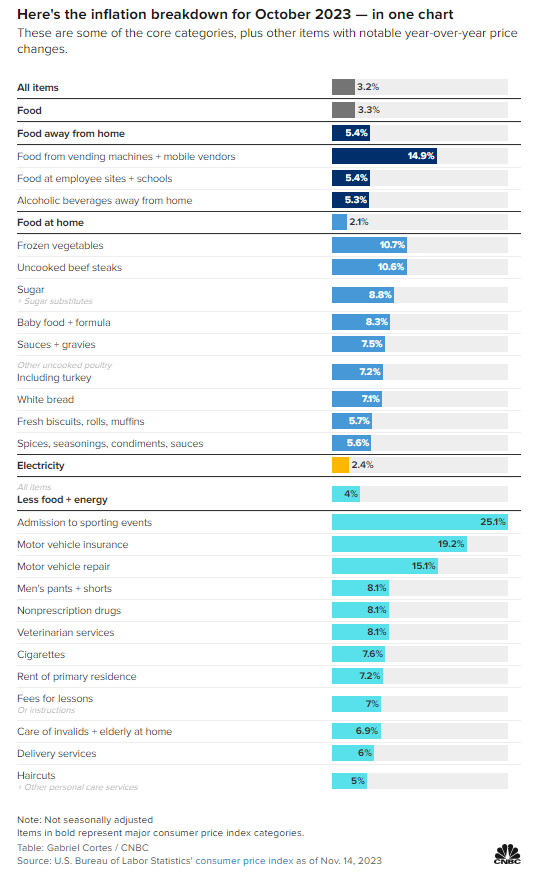
 Looking into the report, the index for shelter continued to rise in October but was offset by the declines in gasoline prices, seeing the headline M/M unchanged.
- Food prices accelerated to 0.3% from 0.2%.
- Other indexes which increased in October include rent, owners’ equivalent rent, motor vehicle insurance, medical care, recreation and personal care.
- The indices for lodging away from home, used cars and trucks, communication, and airline fares were among those that decreased over the month.
- On core services ex-shelter, Oxford Economics highlighted that it rose by the smallest amount since July. However, “momentum is still running hot, helped by a surge in auto insurance costs and a rebound in medical care inflation. Inflation in this category largely reflects a continued rapid wage growth and will be the slowest to normalize.”
- The report will likely see a reduction in Fed officials commenting on the potential for another rate hike. We may get some more calls that policy is now “sufficiently restrictive”, given it would likely require a sizeable upturn in November CPI and an ebullient November NFP report to bring the December meeting into play.
- On the other hand, it’s worth noting the Fed has made it clear recently that it wants to see inflation well on its way to 2% before it talks about cutting rates, in part because it wants to prevent any further loosening of financial conditions.
 PPI
PPI
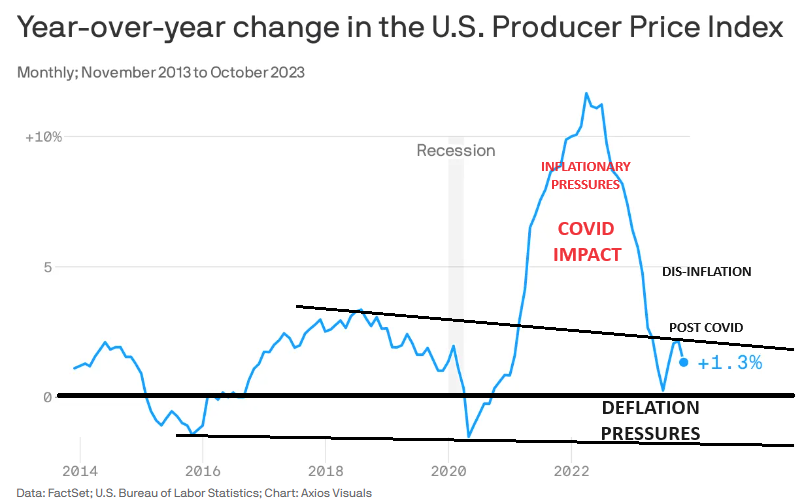
October US headline PPI fell 0.5% M/M, a big surprise against the expected 0.1% rise and down from the prior month’s 0.5% rise; Y/Y rose 1.3%, also well beneath the expected +1.9% and down from the prior +2.2%.
-
- The headline figures were pressured lower by a plunge in energy prices, mostly in the gasoline segment, but also electricity prices, with food prices little changed.
- For the core figures, M/M prices were flat, beneath the expected and prior +0.3%, with the core Y/Y rising 2.4%, beneath the prior and expected 2.7%.
- The core figures saw good prices rise a meagre 0.1% and services prices unchanged.
- Pantheon Macroeconomics writes, “Combining the PPI data with the CPI numbers released yesterday, we expect a 0.25% increase in the October core PCE deflator, so it could round either to 0.2% or 0.3%.
- In any event, what really matters is the core services print, which should rise by less than the 0.45% gain in September.”
 RETAIL SALES
US October Retail Sales were not as bad as feared, falling 0.1% (exp. -0.3%), with the prior revised up to +0.9% from +0.7%.
-
- The core beat at +0.1% M/M (exp. 0.0%) with the prior revised up to +0.8% from +0.6% and the Control Group, which feeds into the GDP report, was in line with expectations at 0.2% with the prior revised up to 0.7% from 0.6%.
- The greatest declines were seen in furniture and home furniture stores (-2%) and miscellaneous store retailers (-1.7%), with notable falls also in motor vehicle and parts dealers (-1.0%).
- On the flip side, the largest gains were seen in Health and personal care stores (+1.1%), electronic and appliance stores (+0.6%), and food and beverage stores (+0.6%). Elsewhere prices were roughly flat with gasoline stores -0.3%, while food services and drinking places were +0.3%.
- Regarding the control group, analysts at ING suggests this indicates decent resilience and supports their view that Q4 GDP growth may not be as weak as the consensus 0.7% annualised growth. ING looks for 1.5% growth while the latest Atlanta Fed GDPNow tracker was raised to 2.2% from 2.1%.
 JOBLESS CLAIMS:
-
- Initial Jobless Claims for the week ending 4th November rose to 231k from 218k, a sizable increase compared to recent averages and above the 220k forecast, supportive of a rebalancing labour market.
- The jump in claims brought the 4wk average to 220.25k from 212.5k, the highest since 14th September.
- Meanwhile, the continued claims data continues to rise, up to 1.865mln from 1.833mln, above the 1.847mln forecast, showing that those who are claiming unemployment benefits may be struggling to return to the labor market.
- The seasonal factors had expected a decrease of 10,261, while the unadjusted number of initial claims was at 215.9k.
- Nonetheless, when taken with the cooler-than-expected CPI and PPI reports, the rising jobless claims this week support the view that rate hikes are behind us, particularly if the upward trend continues.
GLOBAL MACRO
WHAT DOES YOUR SCAN OF THE DATA BELOW TELL YOU? – THE MEDIA AVOIDS BAD NEWS!
We present the data in a way you can quickly see what is happening.
THIS WEEK WE SAW
Exp=Expectations, Rev=Revision, Prev=Previous
DEVELOPMENTS TO WATCH
 WARNING ALERTS: “The Rate of Change”
We are witnessing the rate of change of key financial indicators that are sending strong warnings alerts. Just a few include:
-
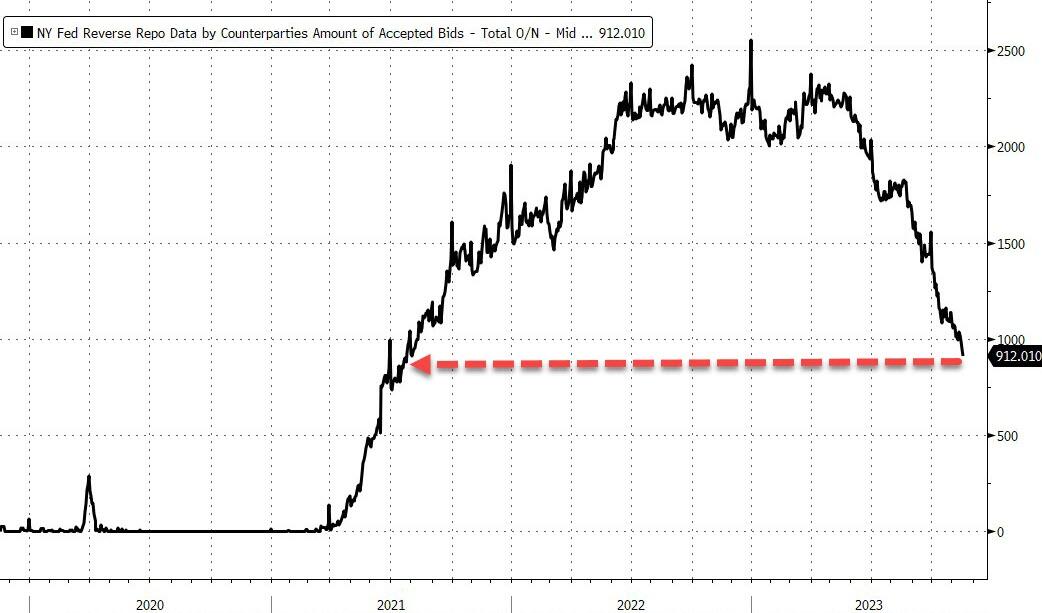
- FED REVERSE REPO HOLDINGS – Has been reduced from >$2.5T to <$1T?
- BANK DEPOSITS: Continue to steadily erode and thereby increasing the Fed’s BTFP.
- GLOBAL OIL PRICES: WTIC has fallen from the mid $90/bl to the low $70/bl?
- FINANCIAL CONDITIONS INDEX: Have reversed from Tightening to Loosening?
- US CREDIT DEFAULT SWAP RATE: Continue to surge.
WHAT MIGHT THESE RATE CHANGES SUGGEST?
-
- The US Treasury has a funding problem in attracting sufficient buyers of the existing roll-over debt and surging new deficit spending.
- This problem is quickly becoming systemic (size of global demand versus US supply) and structural (Bank Primary Dealers ability to absorb auction shortfalls).
- US debt is increasingly being financed with short duration Bills versus longer duration Notes and Bonds leaving the US Treasury exposed to high interest payments and chronic budget deficits.
 THE $2 TRILLION GLOBAL SHOCK: Government Budgets Can’t Handle This!
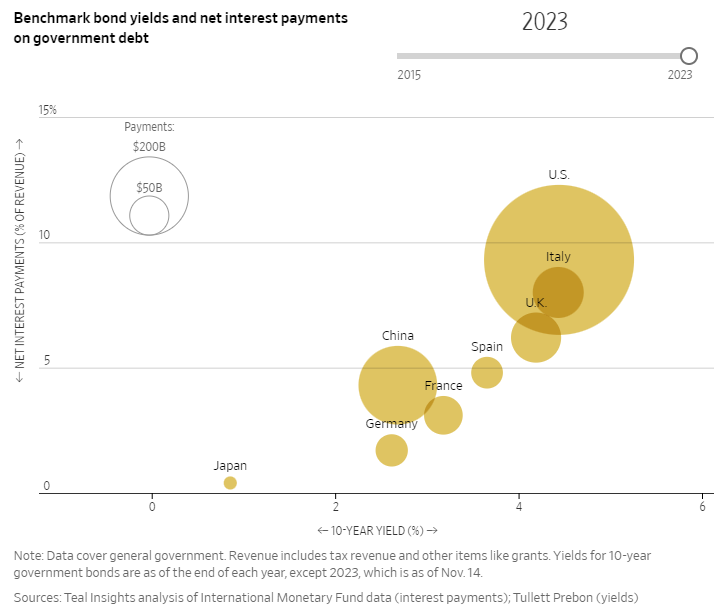
Governments are expected to spend a net $2 trillion paying interest on their debt this year as higher interest rates make borrowing more expensive, up more than 10% from 2022. By 2027 borrowing could top $3 trillion.
As debt servicing takes up more revenue, politicians face unpopular decisions to raise taxes, cut spending or keep running deficits that will add to interest costs.
-
- Debt-servicing costs complicate plans in many countries for more military, climate spending and supporting entitlement programs.
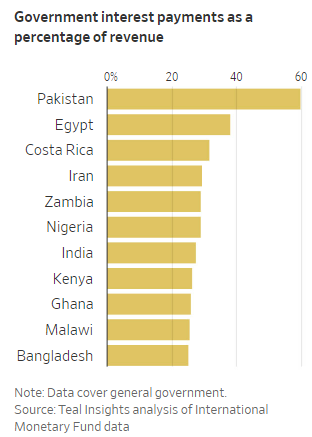
- In the developing world, trade-offs are even starker—between paying debt and making other necessary payments, such as for public servants’ salaries or for imports such as wheat and fuel.
- Additionally, the cost of repaying bonds that are maturing or interest owed by consumers and companies on their debt is problematic.
- In poorer countries, policy makers are already choosing between spending on citizens and crucial imports or paying debt.
 The U.S. federal government spent a record $659 billion on net interest payments last fiscal year, according to the Treasury Department. At 2.45% of gross domestic product, net interest payments were the highest share of the economy since 1998, according to Treasury.
Increasing Interest costs are crowding out critical funding for productive investments which deliver profits (savings) and increase the standard of living. The aggregate global standard of living will therefore come under increasing pressure. The global GDP is ~ $101T with global debt at ~ $35T. It cannot absorb $3T in interest expense without structural problems.
“Every dollar that’s going to pay debt service is not a dollar that’s going to help education, to building infrastructure that will create growth. You see increases in poverty.”
A COUNTER RALLY FOR THE HISTORY BOOKS!
A RALLY THAT SHOULD NOW BE FADED?
Click All Charts to Enlarge
1 – SITUATIONAL ANALYSIS
 We have just witnessed the fastest 3-weeks’ surge in stocks since the days when the Fed was buying ETFs in 2020. The speed and size of the rally took almost eveyone by surprise!
We just witnessed a 10% S&P 500 rally in 10 days as the result of:
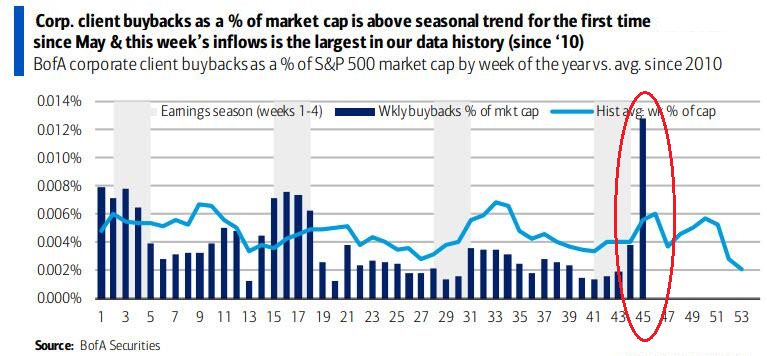
1- BUYBACKS: A flurry of stock buybacks – some $5BN per day – unleashed after the Q3 blackout period ended resulting in going from virtually nothing on Monday to nearly $40B by the end of the Nov 17 week.
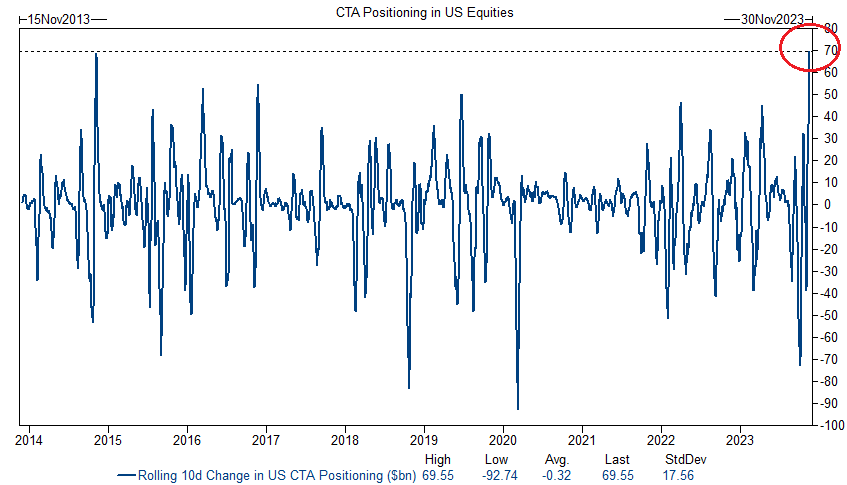 CHART ABOVE: This was the largest weekly buyback in data history going back to 2010.
2- CTA BUYING: Massive CTAs stock buying purely on vol signals resulting in nearly $70B of US equities being bought in the largest 10 day buying on record. (CHART RIGHT)
However that party is now fizzling out. When you consider:
-
- High Yield (HY) spreads have now collapsed by 110bps.
 We have had a jump in big shorts of leverage (RTY, KRE), the distressed tech (XBI, ARKK) and China-plays (IYM).
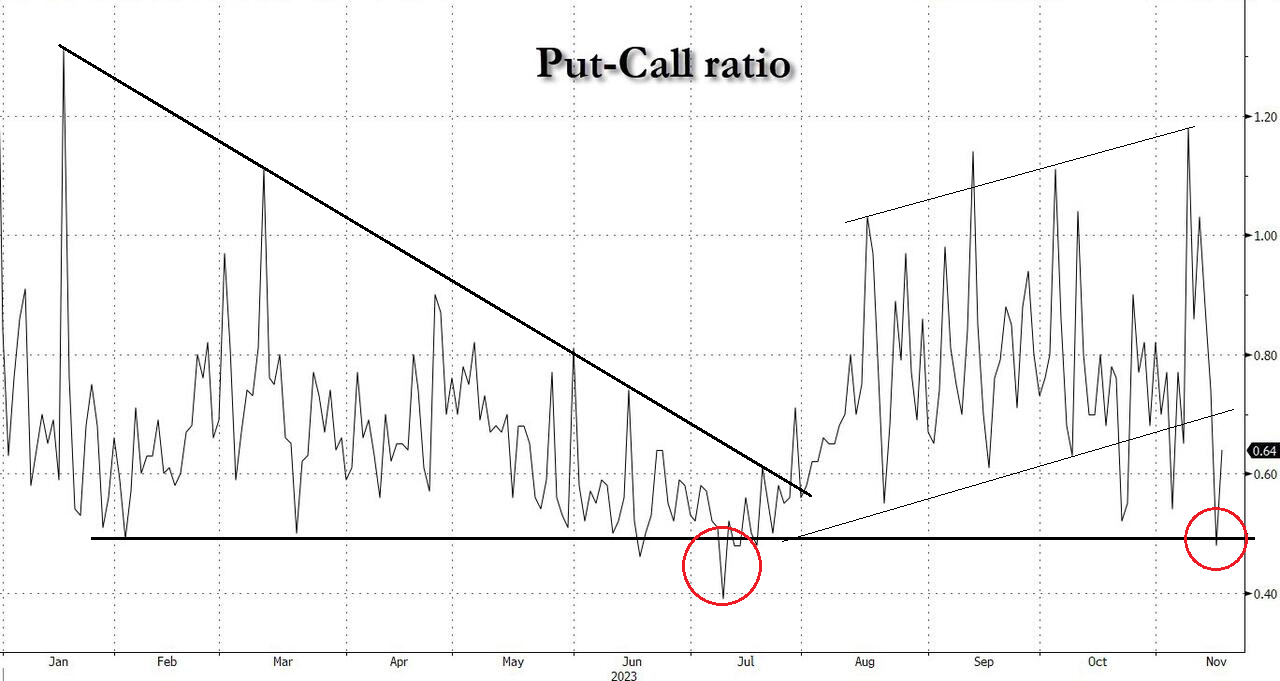
- The put/call ratio slumping to 0.48 (2nd lowest of ’23 – chart right).
…. it typically means we have reached the point where it may be time to “Fade It”?
Additionally, the recent move in yields and oil suggests the probability of a soft-landing is becoming increasingly tenuous.
-
 5% to 4% bond yields = easier financial conditions = bullish risk”
- 4% to 3% yields = recession = bearish risk
- Meanwhile, after hitting $95 less than two months ago, oil is now in a bear market (-22% from Sept high) on either: i) recessionary demand or ii) “peak geopolitical risk” or iii) both!
FUND MANAGER SURVEY
The latest Fund Manager Survey shows the 2024 investor base case is:
-
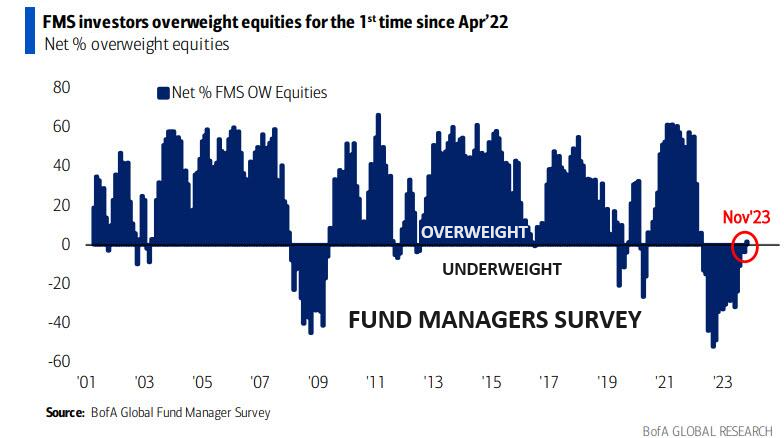 A “soft landing” (67%)
- Lower inflation (82%)
- Rates (80%)
- Bond yields (61%)
- Weaker US $ (65%)
… all pushing stocks to the upper end of the S&P range basically through monopolistic tech & health care stocks.
2 – FUNDAMENTAL ANALYSIS
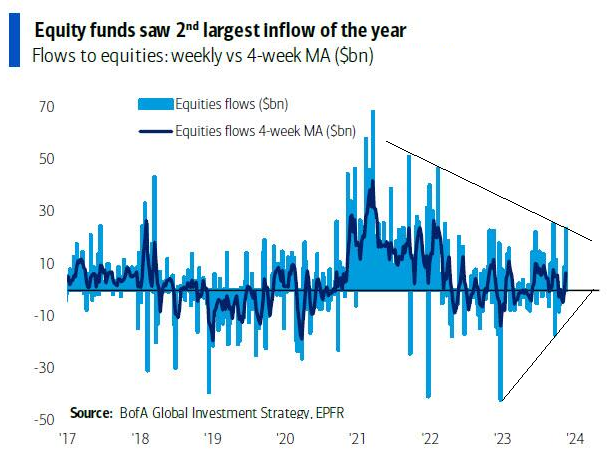 Last week saw a $23.5BN inflow to stocks, the second largest ‘23. (Chart Right)
What we see in the charts on inflows (chart right and two charts below) is the volatility associated with continuation triangles. This is suggestive of shorter term weakness before inflows continuing again.
Fade the rally in the near term over 4550 on the S&P 500, but there is more left to go before we again head lower in this larger degree Bear Market.
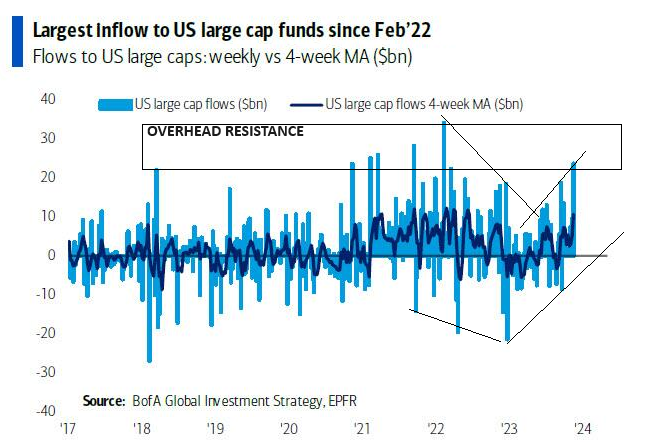
US LARGE CAP STOCKS saw the largest inflow since Feb’22 ($23.7bn).
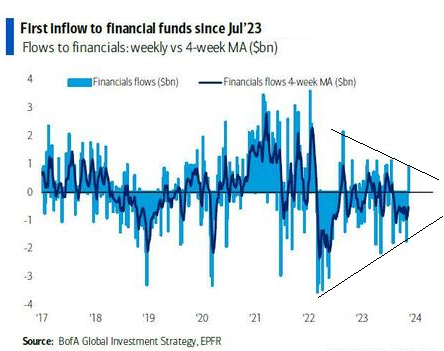
FINANCIALS: 1st inflow since Jul’23 ($0.9bn)
3 – TECHNICAL ANALYSIS
EQUITY MARKETS
S&P 500 – DAILY
EXPECT A COMING PERIOD OF CONSOLIDATION WITH THE S&P 500 MOVING DOWN TO THE 100 DMA AREA AND FILLING THE UNFILLED GAP
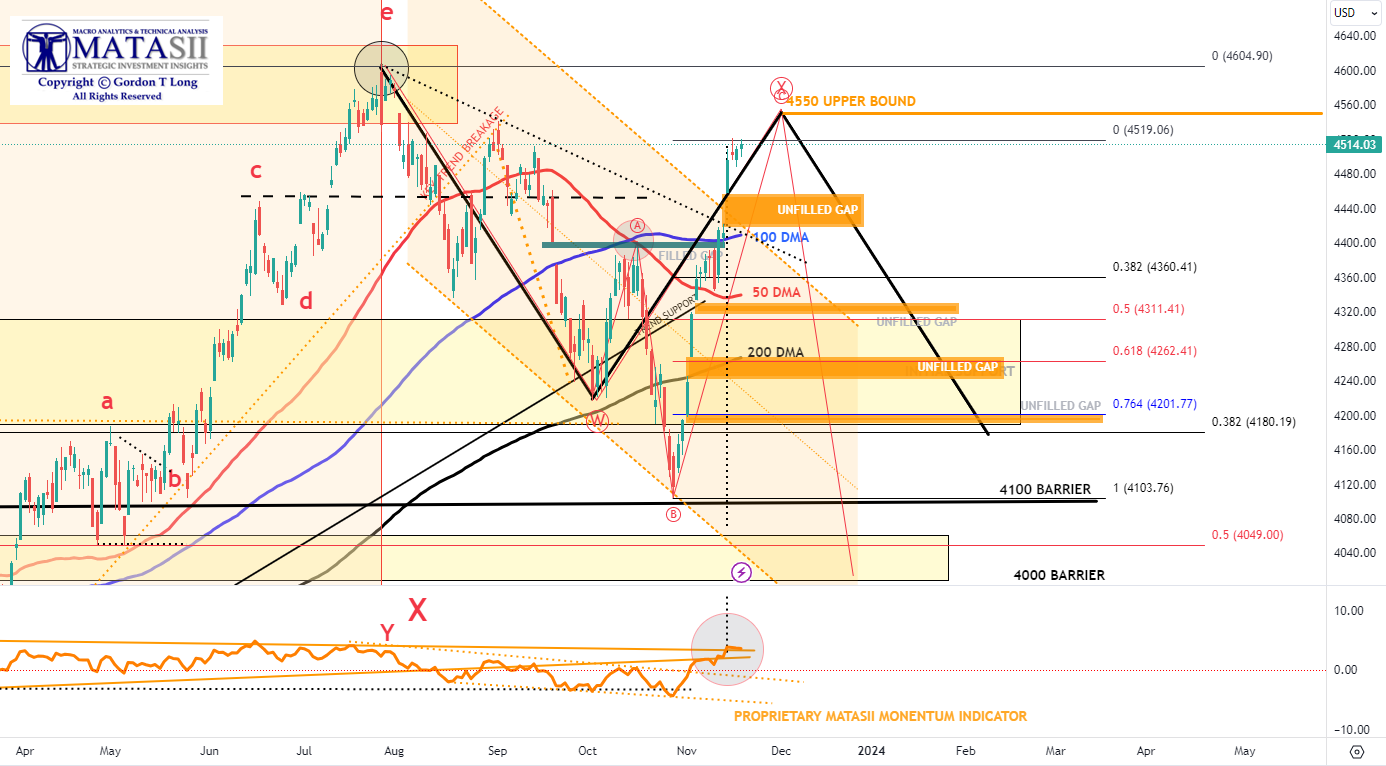
YOUR DESKTOP / TABLET / PHONE ANNOTATED CHART
Macro Analytics Chart Above: SUBSCRIBER LINK
RUSSELL 2000
Equity ETFs: Long iShares Russell 2000 ETF (IWM)
NOTE: The Russell 2000 is the “King of Mean Reversion”. Trading mean reversion is often very painful, especially at turning points, as you end up buying the most brutal selling and end up shorting the most intense buying. The Russell continues to be the king of range trading….bouncing violently once again.
WE CLOSED THE GAP (IN GREEN) AND TOUCHED THE 200 DMA BEFORE PULLING BACK.
EXPECT A COMING PERIOD OF CONSOLIDATION BETWEEN OVERHEAD RESISTANCE AND SUPPORT.
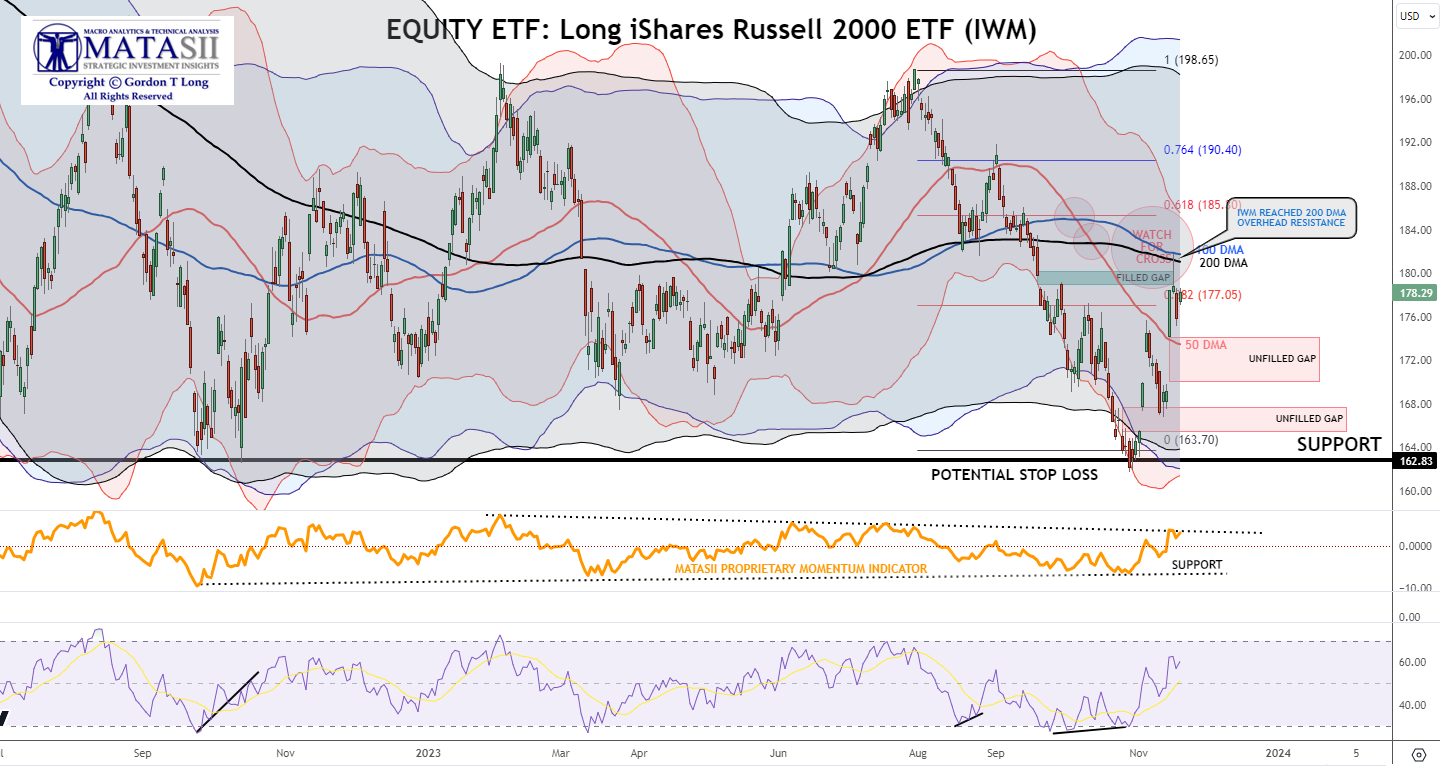
YOUR DESK TOP / TABLET / PHONE ANNOTATED CHART
Macro Analytics Chart Above: SUBSCRIBER LINK
NVDA – Daily
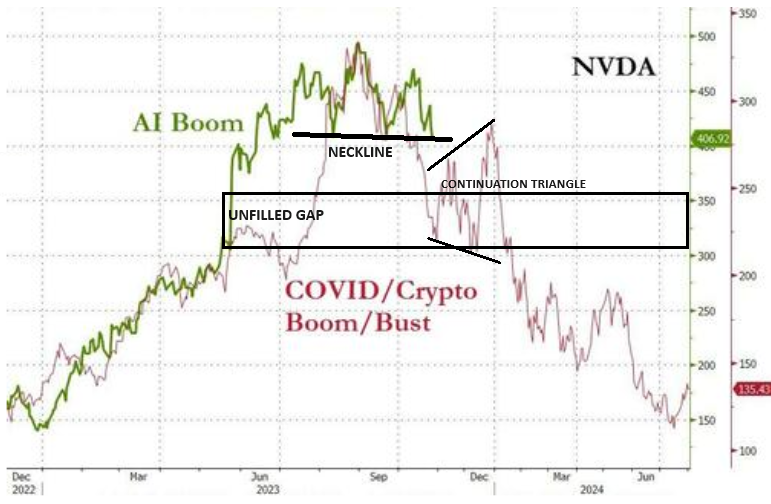
NOTE: Don’t forget the Head & Shoulders analogy model outlined below. (The lift to the upper trend channel shown above is not marked on the analog we forwarded in prior newsletters).
EXPECT A COMING PERIOD OF CONSOLIDATION WITH NVDA MOVING TOWARDS THE CIRCLED TARGET AREA
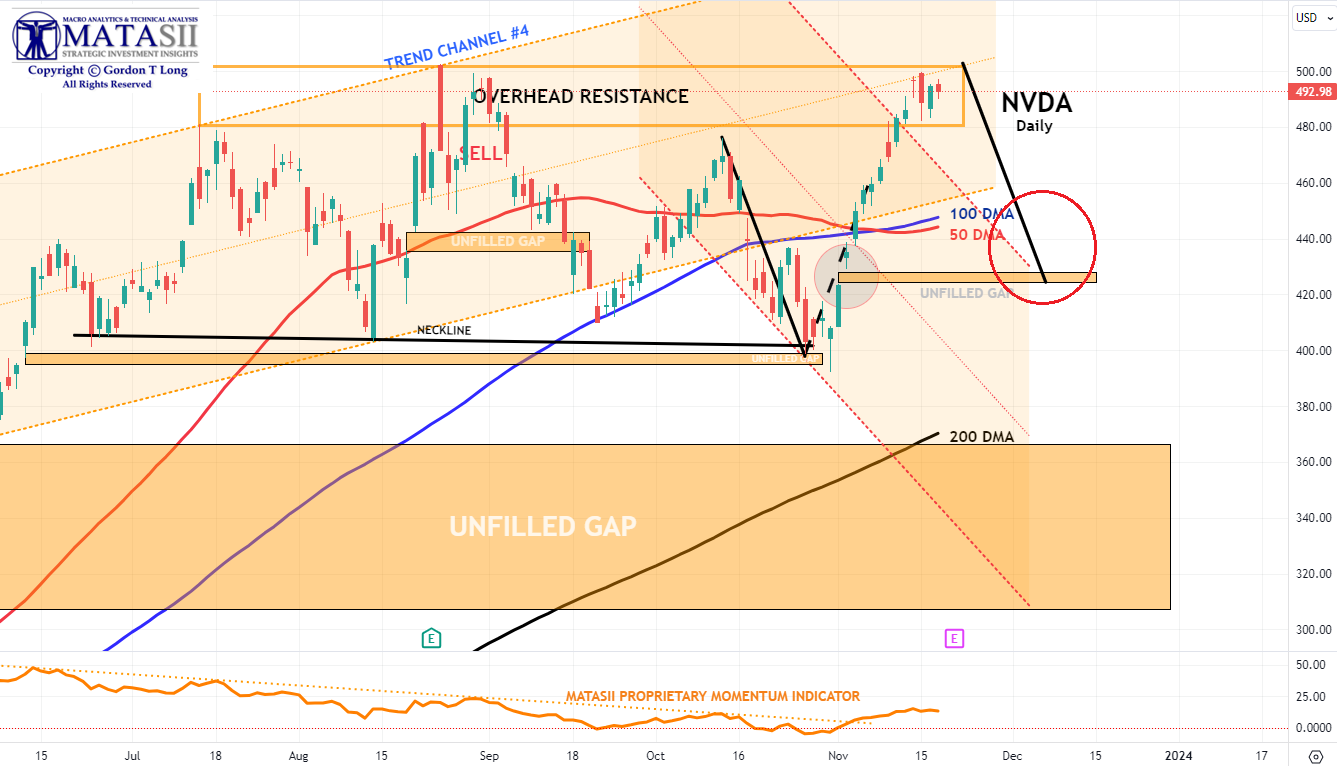
YOUR DESK TOP / TABLET / PHONE ANNOTATED CHART
Macro Analytics Chart Above: SUBSCRIBER LINK
US TREASURY MARKET
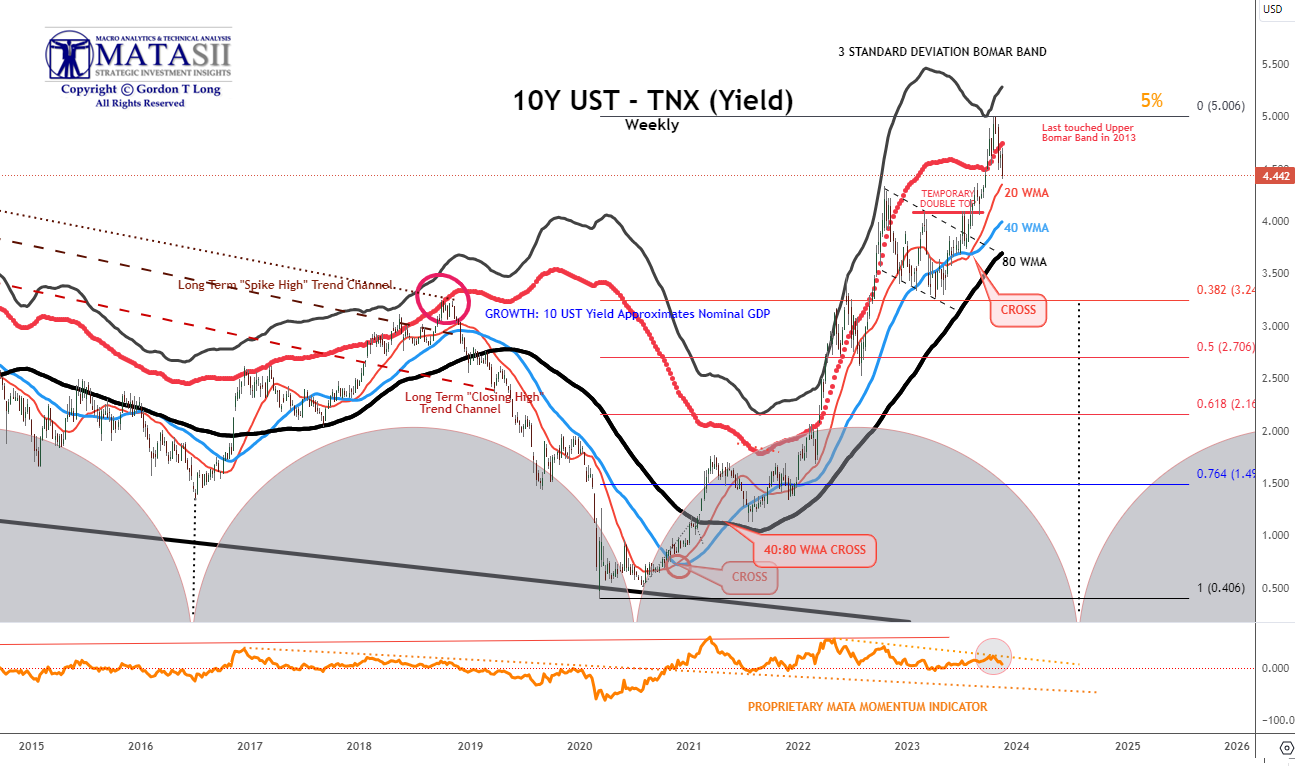
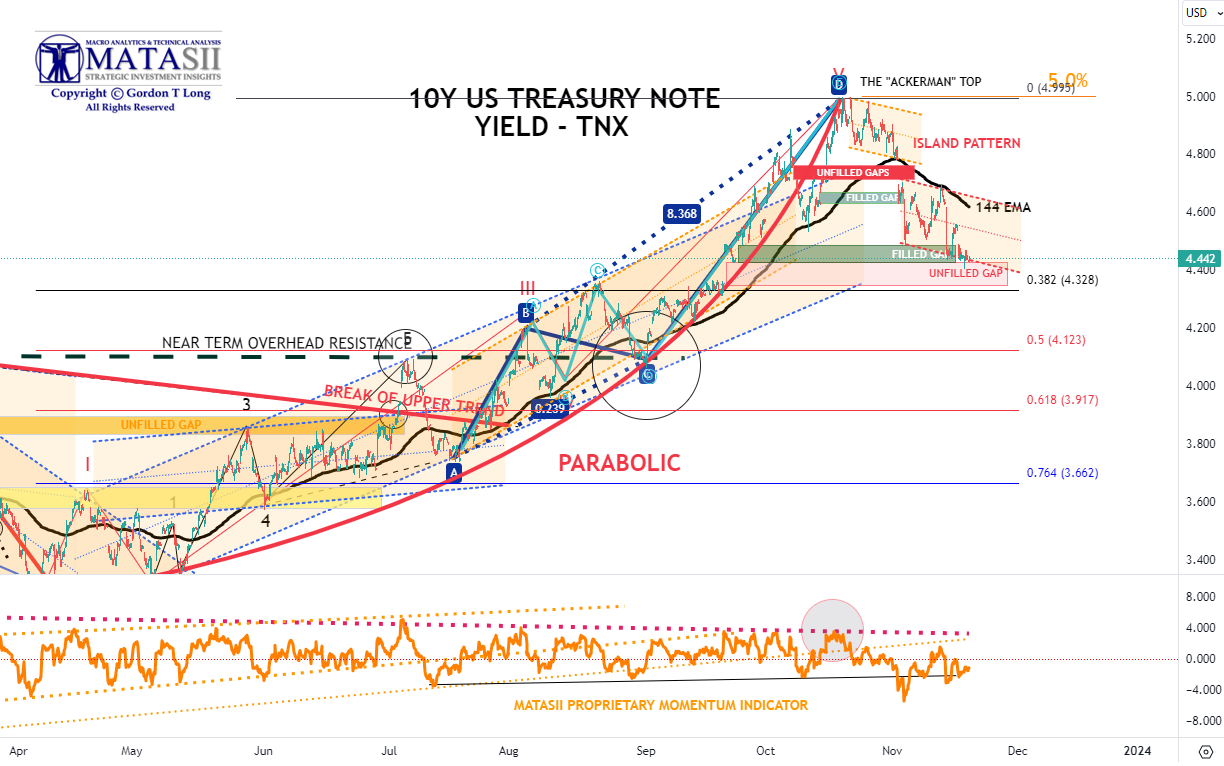
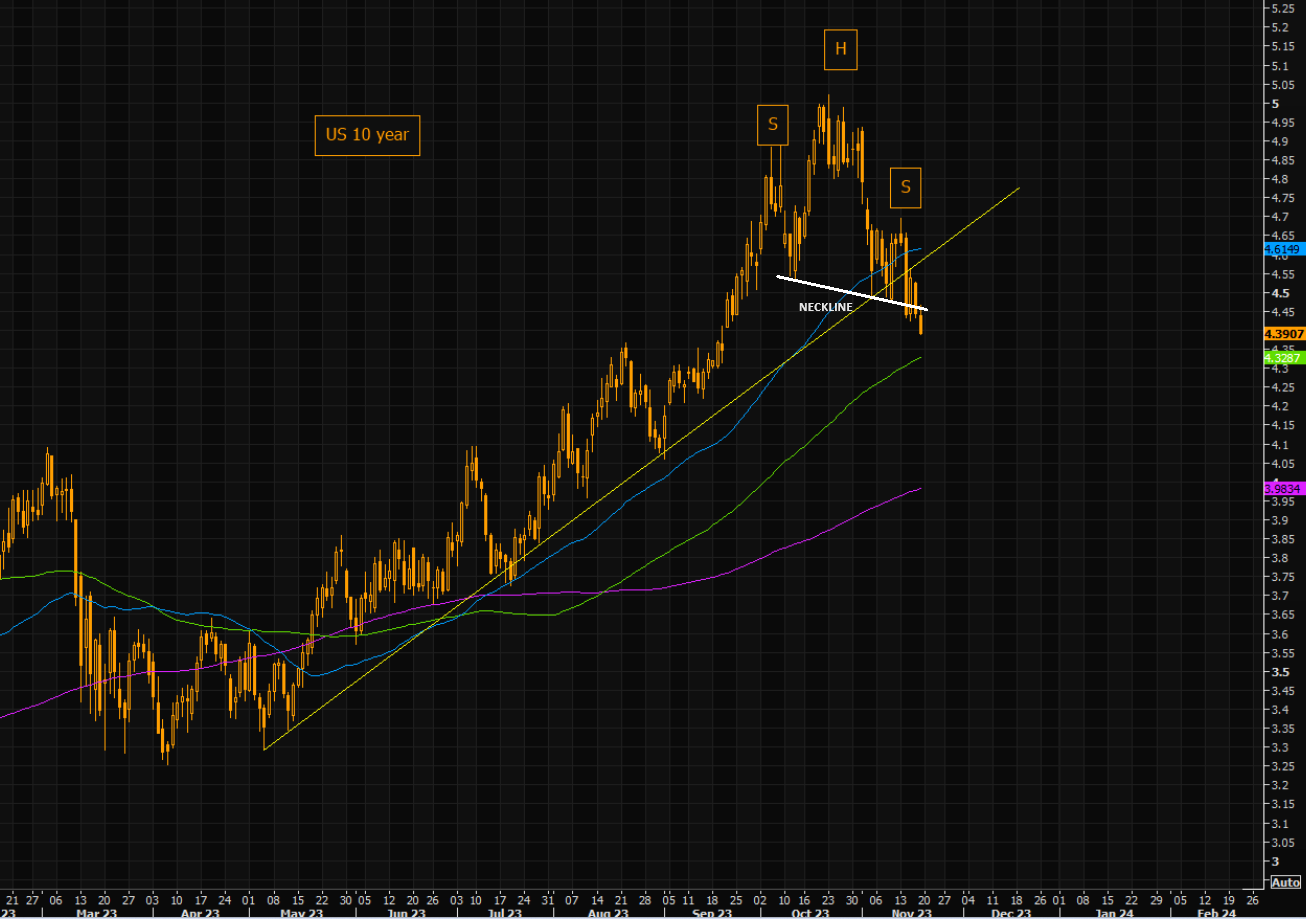 10Y US TREASURY YIELD – TNX
CHART RIGHT:
We have a broken neckline on a possible Head and Shoulders formation pattern for the TNX.
US 10Y TREASURY YIELD – TNX – WEEKLY
The Weekly TNX looks to want to fund support at the 20 WMA (~4.35 – 4.4%).
YOUR DESK TOP / TABLET / PHONE ANNOTATED CHART
Macro Analytics Chart Above: SUBSCRIBER LINK
US 10Y TREASURY YIELD – TNX – DAILY
This chart highlights that the 50 DMA acted as initial support last week. The rising 100 DMA is likely the next level of support which approximates 4.37%.

YOUR DESK TOP / TABLET / PHONE ANNOTATED CHART
Macro Analytics Chart Above: SUBSCRIBER LINK
US 10Y TREASURY YIELD – TNX – HOURLY
The hourly TNX suggest near term support levels are likely at a 38.2% Fibonacci retracement level of ~4.328% from the low in April, after filling two major open gaps.
YOUR DESK TOP / TABLET / PHONE ANNOTATED CHART
Macro Analytics Chart Above: SUBSCRIBER LINK
FAIR USE NOTICE This site contains copyrighted material the use of which has not always been specifically authorized by the copyright owner. We are making such material available in our efforts to advance understanding of environmental, political, human rights, economic, democracy, scientific, and social justice issues, etc. We believe this constitutes a ‘fair use’ of any such copyrighted material as provided for in section 107 of the US Copyright Law. In accordance with Title 17 U.S.C. Section 107, the material on this site is distributed without profit to those who have expressed a prior interest in receiving the included information for research and educational purposes. If you wish to use copyrighted material from this site for purposes of your own that go beyond ‘fair use’, you must obtain permission from the copyright owner.
NOTICE Information on these pages contains forward-looking statements that involve risks and uncertainties. Markets and instruments profiled on this page are for informational purposes only and should not in any way come across as a recommendation to buy or sell in these assets. You should do your own thorough research before making any investment decisions. MATASII.com does not in any way guarantee that this information is free from mistakes, errors, or material misstatements. It also does not guarantee that this information is of a timely nature. Investing in Open Markets involves a great deal of risk, including the loss of all or a portion of your investment, as well as emotional distress. All risks, losses and costs associated with investing, including total loss of principal, are your responsibility.