Gordon T Long
Global Macro Research | Macro-Technical Analysis
MACRO
US ECONOMICS
ELECTION YEAR “GIMMICKS” ABOUT TO UNFOLD
OBSERVATIONS: Yellen’s Treasury “Gimmicks” Are Coming!
It likely comes as no surprise to you that the U.S. federal government has borrowed so much money over the past year that it has had to spend one-fifth of all the money it collected just on debt interest—which came to almost $880 billion. Americans paid some $450 billion less in income taxes for the year, trapping the government in the pincers of a fiscal crunch.
Debt cost has skyrocketed by more than 50 percent between 2019 and 2023. Government debt stood above $33 trillion in fiscal year 2023, (the 12 months that ended on Sept. 30). That’s about $1.7 trillion more than the year before. Over the past year, it has already surpassed the entire military budget. The problem is only getting worse, as old debt issued at low interest rates matures is rolled over into higher rates.
The real problem however is the government for some inescapable reason is incapable of resisting spending at even further increasing levels?
The 2024 debt is already $33.7 since YE September and will be $34T within the 100 days when congress enacts the next Continuation Resolution (CR) when it returns in January. Annual interest expense is now on its way to $1.25T and we can expect the 2024 deficit to be $1.6-$2.0T by March 1st. In the 9 months from when congress enacts the next CR until fiscal YE we can fully expect the fiscal deficits to approach $4T. This is the level of fiscal insanity that is in control of Washington. There is no return when a country’s national debt is larger than its GDP without debasing the purchasing value of your currency.
The only solution is Congress must immediately and dramatically curb deficit spending to instill confidence in investors who are steadily losing faith (along with Fitch downgrades in June and Moody’s in October) in America’s ability to satisfy its obligations. Increasingly weak US Treasury auctions are now signaling and evoking further global institutional unrest and hesitancy in buying US debt.
Instead Yellen and other political operatives are huddled in the White House working on election year spin and deflection narratives to hide this crisis. We should expect the following political gimmicks to soon emerge:
Gimmick #1: While the government pays some of the interest to itself, as it holds about 20 percent of the debt in various trusts and funds, interest from that portion of the debt is supposed to pay for future expenses of programs such as Medicare and Social Security. That money is already slated to go out the door. It just hasn’t gone out the door yet. It’s not as if the government has that cash on hand to spend?
Gimmick #2: Issue a $1T Bitcoin is being trial ballooned around the White House planning tables.
Gimmick #3: The easiest “Slight-of-Hand’ will be to push the narrative that servicing the debt isn’t much of a worry, since the Fed can print the cash necessary to cover the interest or even buy up the debt. The Treasury would then pay the interest on the debt to the Fed, which would then use the money to cover the cost of its operations and send the surplus back to the Treasury. The government would, in effect, pay the interest to itself.
This is the easiest with a compliant media always ready to assist in deflection and a public too poorly educated to understand that about 20 percent of the government debt is held by the Fed already (result of QT). Therefore the reality doesn’t necessarily follow this logic, because they actually now lose money. The reason is that so much of the Treasuries they have on the books was purchased in 2020 and even early 2021 when rates were near zero, so those assets are earning almost nothing. Anything the Fed does collect on its portfolio, it immediately pays out to banks and money market funds in interest on reserves and reverse repurchase agreements. The point of those operations is to stem inflation— keeping liquid cash locked in its vaults so that it can’t multiply in the banking system. These operations now cost the central bank some $700 million per day, forcing it into a “huge deficit”. It’s not sending Treasury a dime.
All these factors seem to be souring investor confidence in the bonds. And once spoiled, investor trust is hard to restore.
WHAT YOU NEED TO KNOW!
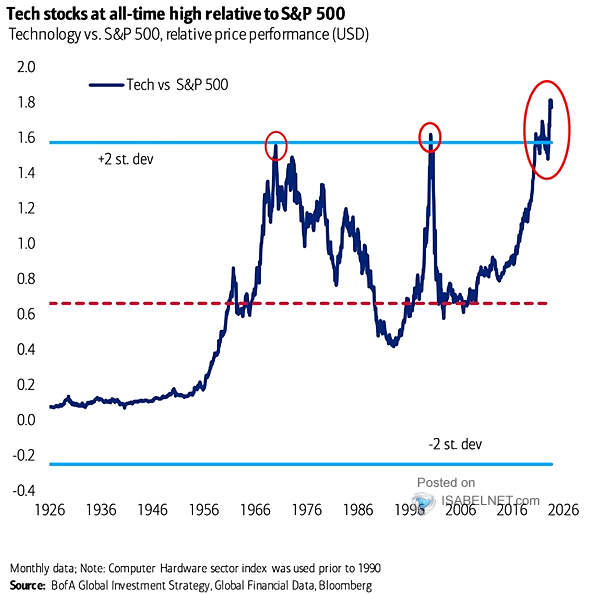
 THE “CLEANEST DIRTY SHIRT” IN THE LAUNDRY?
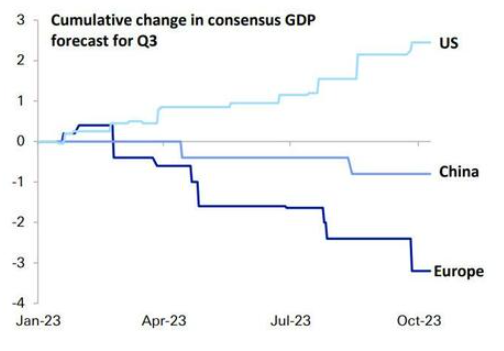
The US Stock Market has just experienced one of the strongest rallies in the shortest period of time in history. The chart to the right suggests it may be because the US is currently the best place to “park” global risk money. However, with the US economy spending in excess of its budget by $1.7T, this is resulting in the “I” (for Investment for foreign buying of US T-Bills), the “G” (Government spending and Transfer Payments) and the “C” (Consumption from depleted savings, credit card balances and borrowing against 401Ks). This leads to ONLY a temporary surge in GDP (GDP = C+G+I+ (Exp-Imp)). The operative word here is “temporary”, unless US debt growth accelerates at an even faster pace. Normally, this is not sustainable?
RESEARCH
THE MARKET CONSENSUS IS ALMOST ALWAYS WRONG!
-
- Not so surprisingly is that the contrarian moves from the Fund Managers Survey (FMS) are significantly inline with MATASII.com independent research.
FIVE ECONOMIC INDICATORS TO BE THANKFUL THIS HOLIDAY SEASON
-
- The Unemployment Rate is Below 4%
- Low unemployment claims
- Inflation is Decreasing
- Mortgage Delinquency Rate Near the Lowest Level since at least 1979
- Household Debt burdens at Low Levels
GLOBAL ECONOMIC REPORTING: What This Week’s Key Global Economic Reports Tell Us?
- LEADING ECONOMIC INDICATOR (LEI): The Leading Economic Index (LEI) was down again in October. For more than a year and a half this bellwether has signaled a recession that has yet to arrive. We look at prior cycles to consider to what extent the severity of decline in LEI is indicative of the magnitude of recession.
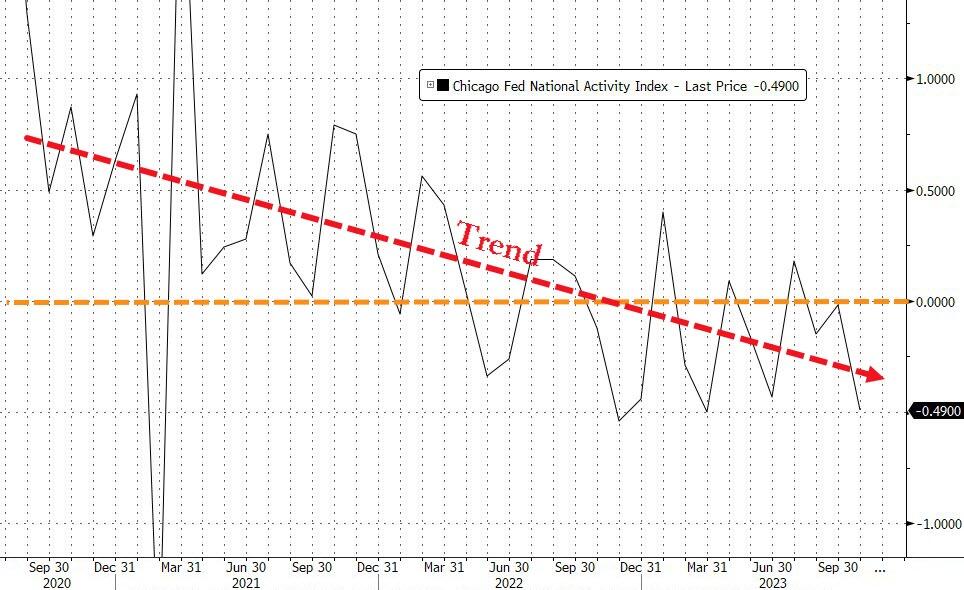
- NATIONAL ACTIVITY INDEX (Chicago Fed): The Chicago Fed National Activity Index (CFNAI) tumbled to -0.49,(below 0 meaning below-trend growth), well below expectations of 0.0 and September’s -0.02 print.
- CONTINUING JOBLESS CLAIMS: Jobless claims surged on an un-adjusted basis to four month highs.
- DURABLE GOODS: October Durable Goods declined more than expected to -5.4% (exp. -3.1%, prev. 4%).
DEVELOPMENTS TO WATCH
 Q3 EARNING CALLS: KEY CEO FOCUS
-
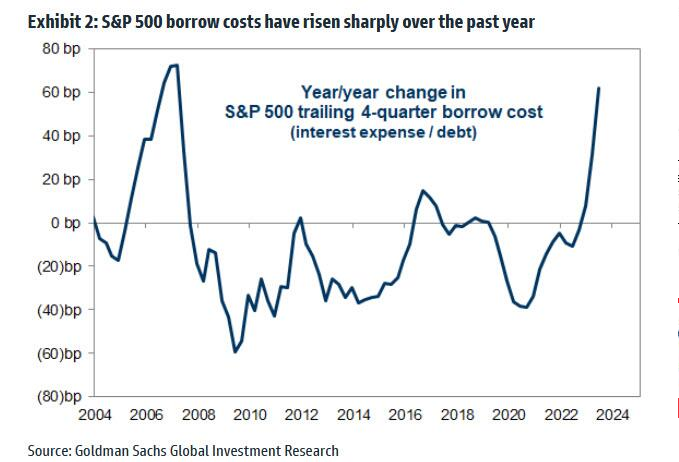
- INTEREST EXPENSE: Managements discussed increases in interest expense in a higher rate environment.
- DEBT PAYDOWN: Debt paydown and Leverage Ratios were a priority relative to other capital spending alternatives.
- CONSUMER SPENDING: Firms shared their perspectives on the health of the consumer, where opinions are split down the middle.
- ADOPTION OF AI: Firms have continued to highlight the uses of AI in their business to boost productivity and enhance product offerings.
Q4 EARNINGS: ANOTHER YE “HOCKEY STICK” DISAPPOINTMENT
-
- Analysts are often wrong with annual earnings by a large degree – Often right up to YE before they have to finally acknowledge they were wrong all along.
- Q3 Earnings Season is over. How did you do? Just wait until you seek Q4. Are you tired of being suckered?
Better luck with 2024!
THE MARKET CONSENSUS IS ALMOST ALWAYS WRONG!
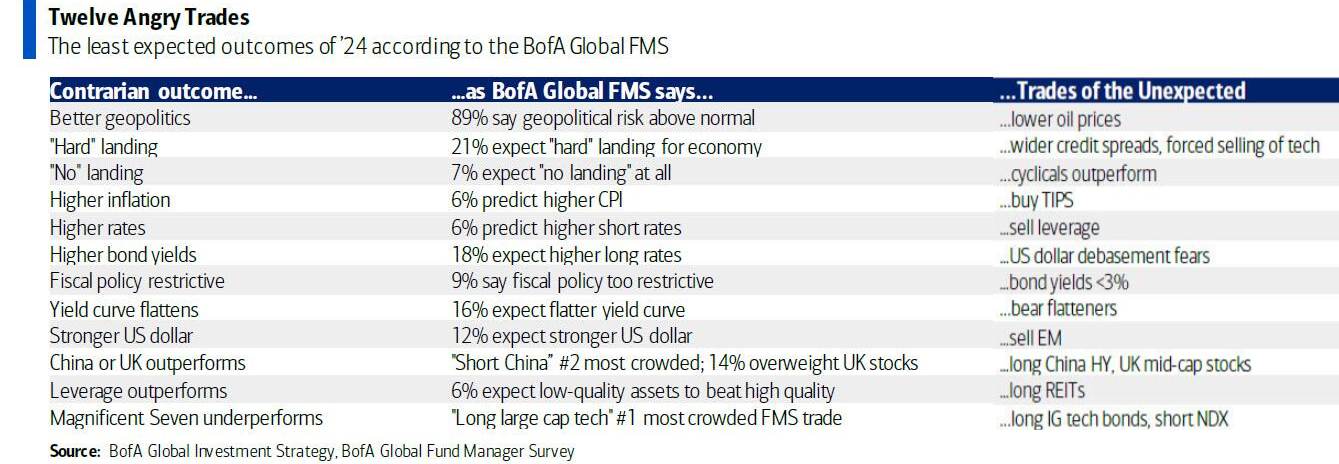
 One of the few analysts that has been consistently right throughout a tumultuous 2023 is Michael Hartnett, the Managing Director & Head of Portfolio Strategy at Bank of America Merrill Lynch. I therefore found it particularly interesting when he recently stated that the only value of the well followed Fund Manager Survey is to “fade it”.
Seeing how the BoA publishes this survey I suspect he must get heat from his BofA bosses to allow him to state this opinion? For job security, if I was him, I would personally ensure I had some degree of proof?
The 2024 FMS base case is
-
- A “soft landing” (67%), MATASII sees Hard Landing by Q3 2024
- Lower inflation (82%), MATASII sees Higher Inflation later in 2024
- Lower Rates (80%), MATASII sees Hard Landing
- Lower Bond yields (61%), MATASII sees Higher Bond Yields in H2 2024
- Weaker US $ (65%), MATASII sees Weak US$ short term to Intermediate but Higher Longer Term
- All pushing stocks to the upper end of the S&P range via monopolistic tech & health care stocks
Below is what Hartnett feels the recent FMS suggests to him:
Not so surprisingly is that the contrarian moves are significantly inline with our independent research at MATASII.com.
FIVE ECONOMIC INDICATORS TO BE THANKFUL THIS HOLIDAY SEASON
There are a number of economic and financial indicators that we need to be thankful for this holiday season! These indicators are closely followed and have kept the financial markets from going into a tailspin!
For full disclosure I believe all these indicators are being seriously distorted (whether or intentionally we will leave for another day so as not to take away from this happy time) by newly created seasonal adjustments, distorting one time factors or showing unusually delayed readings because of massive temporary government spending.
Nevertheless, the fact they give us these positive reasons is a thing to be thankful for – at least during this happy holiday period.
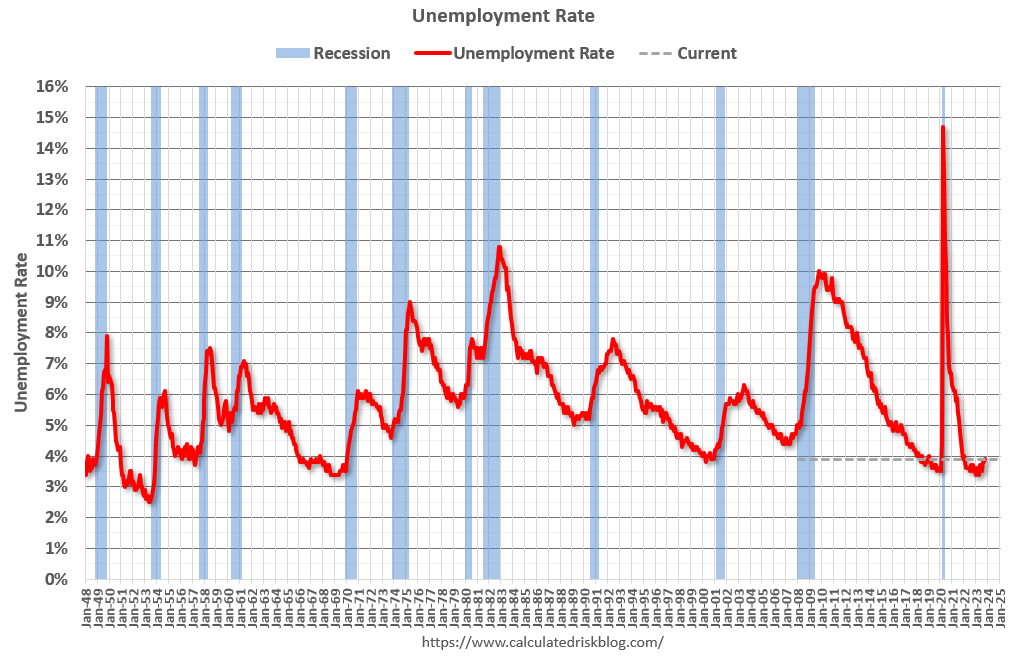 1) The Unemployment Rate is Below 4%
The unemployment rate was at 3.9% in October. The unemployment rate is down from 14.7% in April 2020 (the highest since the Great Depression).
The unemployment rate is up from 3.7% a year ago (October 2022).
This was up from 3.4% in April 2023 – and that matched the lowest unemployment rate since 1969!
 2) Low unemployment claims.
This graph shows the 4-week moving average of weekly claims since 1971.
Weekly claims were at 209,000 last week.
The dashed line on the graph is the current 4-week average.
Even though weekly claims have bounced around a little recently, the 4-week average is close to the lowest level in 50 years.
 3) Inflation is Decreasing
This graph shows the year-over-year change in three measures of inflation since 1970: CPI, Core CPI, and Core CPI ex-shelter.
CPI was up 3.2% YoY in October, down from the recent peak of 8.9%.
Core CPI was up 4.0% YoY, and Core CPI ex-shelter was up 2.0% YoY in October.
Overall inflation is moving back to the Fed’s 2% target.
 4) Mortgage Delinquency Rate Near the Lowest Level since at least 1979
This graph, based on data from the MBA through Q3 2023, shows the percent of loans delinquent by days past due. Even though delinquencies increased in Q3, mortgage delinquencies were near the lowest level since the MBA survey started in 1979.
Note: The sharp increase in 2020 in the 90-day bucket was due to loans in forbearance (included as delinquent, but not reported to the credit bureaus).
The percent of loans in the foreclosure process decreased year-over-year in Q3 even with the end of the foreclosure moratoriums and are historically low.
 5) Household Debt burdens at Low Levels
This graph, based on data from the Federal Reserve, shows the Total Debt Service Ratio (DSR), and the DSR for mortgages (blue) and consumer debt (yellow).
The Household debt service ratio was at 13.2% in 2007 and has fallen to under 10% now., and the DSR for mortgages (blue) are near the lowest level for the last 35 years.
This data suggests aggregate household cash flow is in a solid position.
A Happy Thanksgiving & Holiday Season to All!
GLOBAL ECONOMIC INDICATORS: What This Week’s Key Global Economic Releases Tell Us
 LEADING ECONOMIC INDICATOR (LEI)
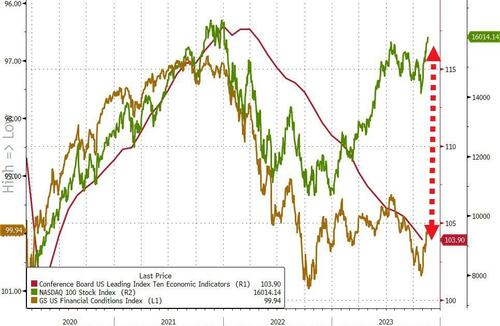
Leading Economic Indicators continued their worst-since-Lehman path to recession but somehow ‘goldilocks’ economic narratives dominant of barely-any-landing-at-all & slowing inflation and financial conditions continue to loosen, erasing more and more of “The Fed’s work”, prompting a potential FCI-Doom-Loop to return.
CHART RIGHT: The Leading Economic Indicator (LEI) in red in the chart below, along with the Financial Conditions Index (FCI) in gold have diverged in a major way. As we wrote in last weekend’s “Market Perspectives”, we sense that we are close to beginning to “Fade this Market”. Financial conditions are near the tightest they have been this cycle and Leading Economic Indicators have fallen at their fastest pace since Lehman… as the Nasdaq nears record highs. – spot the odd one out??
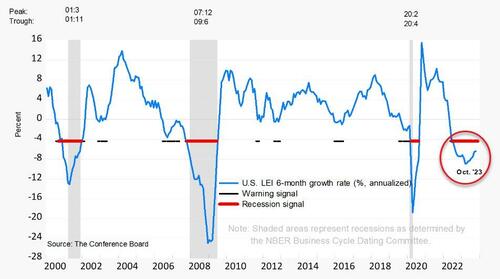 The Leading Economic Indicator (LEI) was down again in October. For more than a year and a half, this bellwether has signaled a recession that has yet to arrive. We look at prior cycles to consider to what extent the severity of decline in LEI is indicative of the magnitude of recession.
The Leading Economic Index (LEI) is supposed to make it easy to keep tabs on the economy, so why is making sense of it so hard? The composite of multiple leading indicators fell another 0.8% in October and has now declined for 19 consecutive months (chart). Yet the first estimate for third quarter real GDP growth was a red-hot 4.9%, revised data next could put a 5-handle on that growth rate.
What gives?
After 19 straight monthly declines, usually we’d be in a recession by now. We looked at the peak-to-trough declines in this bellwether in prior cycles to find a similar period and we found one. Between April 2000 and October 2001, the LEI contracted 12.1%. We’ve very nearly matched the magnitude of that decline in this cycle. Through today’s October numbers, the LEI is down 11.7%.
The chart above shows how drops in the LEI line up with recession related declines in real GDP. In the early 2000s, the LEI began its descent in May 2000 and fell 7.8% by March 2001, which was the official starting month of that recession. The LEI bottomed in October 2001, just one month prior to the official cycle trough in November of that year.
The sustained warning from the LEI has been at odds with the resilience in broad economic activity, but we remain cautious to wave it all off as an anomaly no matter how fast the economy grew in Q3. The nearby chart that lines up the cycle turning points also reveals some big divergences in the 1990s. The LEI broke through the zero line during the mid-cycle slowdown in 1995 and touched it again during the so-called Asian contagion in 1998, when volatility in foreign fixed income and FX markets caused a scare. Yet there wasn’t a recession in either of those periods. When looking at the peak to trough changes, the LEI tends to overshoot the contraction in GDP, yet larger LEI declines are typically met with worse economic contractions. The point being: growth in the LEI and GDP don’t always move in step, though the divergence today is clearly larger than most.
WELLS FARGO: https://wellsfargo.bluematrix.com/links2/html/f45072d8-6ec0-4201-aa65-5f15b0d2a351
US Leading Indicators Tumble For 19th Straight Month, Worst Streak ‘Since Lehman’
“Conference Board expects elevated inflation, high interest rates and contracting consumer spending – due to depleting pandemic saving and mandatory student loan repayments – to tip the US economy into a very short recession…”
 NATIONAL ACTIVITY INDEX (Chicago Fed)
The Chicago Fed National Activity Index (CFNAI) tumbled to -0.49, (below 0 meaning below-trend growth), well below expectations of 0.0 and September’s -0.02 print.
Only 24 of the 85 individual indicators made positive contributions to the CFNAI in October, while 61 made negative contributions.
The slump was broad-based with all four broad categories of indicators used to construct the index decreased from September, and all four categories made negative contributions in October.
 CONTINUING JOBLESS CLAIMS
Jobless claims surged on an un-adjusted basis to four month highs.
It’s going to get worse, as Goldman suggests (chart right) that ongoing seasonal distortions have increasingly weighed on the level of continuing claims over the last six months, and now expect that the reversal of those distortions could exert a cumulative boost of 375k to the level of continuing claims between now and March.
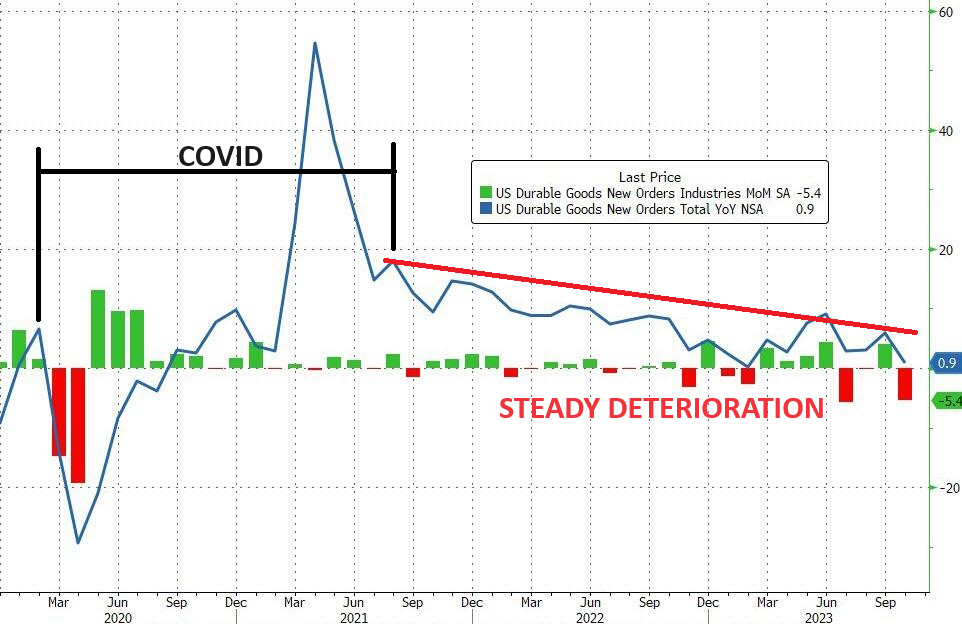 DURABLE GOODS
October Durable Goods declined more than expected to -5.4% (exp. -3.1%, prev. 4%).
-
- Ex-defense plunged 6.7% (prev. +5.0%).
- Nondefense capital goods orders ex-air dipped 0.1% (exp. +0.1%, prev. -0.2%).
- Orders ex-transportation was unchanged (exp. +0.1%).
-
- As Pantheon Macroeconomics details, the fall in headline orders was primarily due to a 57.9% plunge in civilian aircraft orders, on top of a 3.8% slide in auto orders, which largely reflects disruptions caused by the UAW strikes. As such, Pantheon believes rebound in November auto orders is a decent bet.
- Overall, the consultancy adds “the upshot from the [durable goods] report is that real business equipment investment is on course for another decline in Q4, after declining at a 3.8% annualized rate in Q3.”
- In addition, “some of the weakness in core capital goods shipments in recent months has been offset by strength in business purchases of autos over the past couple years, however, business auto purchases flattened in Q3, and a period of outright declines is entirely plausible now, given extremely high financing costs and depressed capital spending intentions”.
GLOBAL MACRO
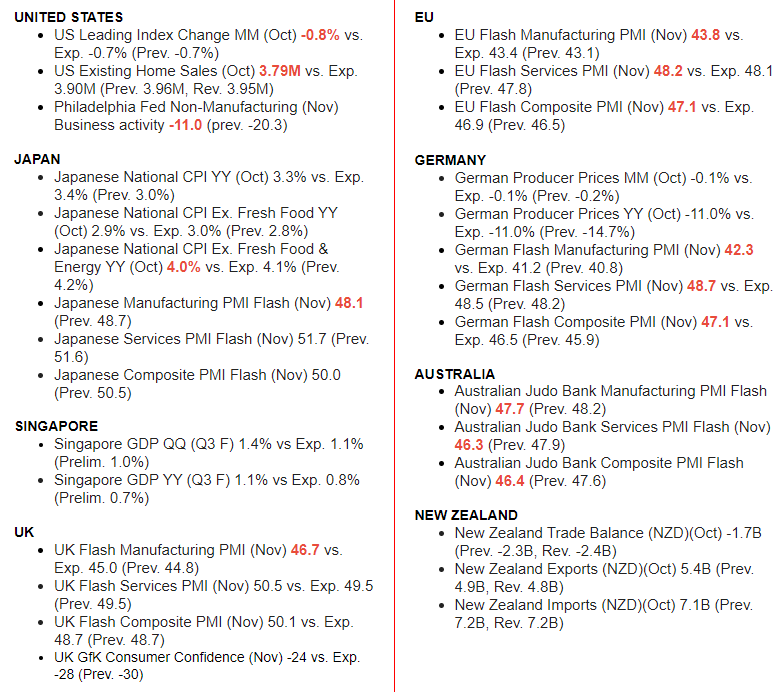
WHAT DOES YOUR SCAN OF THE DATA BELOW TELL YOU? – THE MEDIA AVOIDS BAD NEWS!
We present the data in a way you can quickly see what is happening.
THIS WEEK WE SAW
Exp=Expectations, Rev=Revision, Prev=Previous
DEVELOPMENTS TO WATCH
Q3 EARNING CALLS: KEY CEO FOCUS
-
- INTEREST EXPENSE: Managements discussed increases in interest expense in a higher rate environment.
- DEBT PAYDOWN: Debt paydown and Leverage Ratios were a priority relative to other capital spending alternatives.
- CONSUMER SPENDING: Firms shared their perspectives on the health of the consumer, where opinions are split down the middle.
- ADOPTION OF AI: Firms have continued to highlight the uses of AI in their business to boost productivity and enhance product offerings.
Q4 EARNINGS: ANOTHER YE “HOCKEY STICK” DISAPPOINTMENT
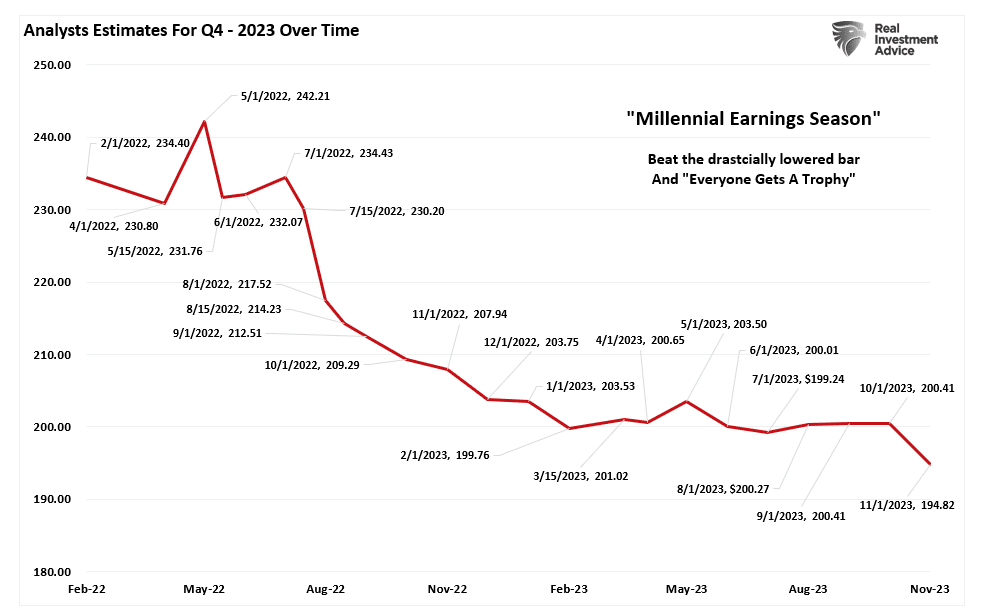
Analysts are often wrong with annual earnings by a large degree – often right up to YE before they have to finally acknowledge they were wrong all along.
This is why some call Q4 the ‘Millennial Earnings Season.’ Wall Street continuously lowers estimates as the reporting period approaches so ‘everyone gets a trophy,’ even though they were hopelessly wrong. You get the losses for believing them and they get the trophy.
The chart right shows the changes in Q4 earnings estimates from February 2022, when analysts provided their first estimates.
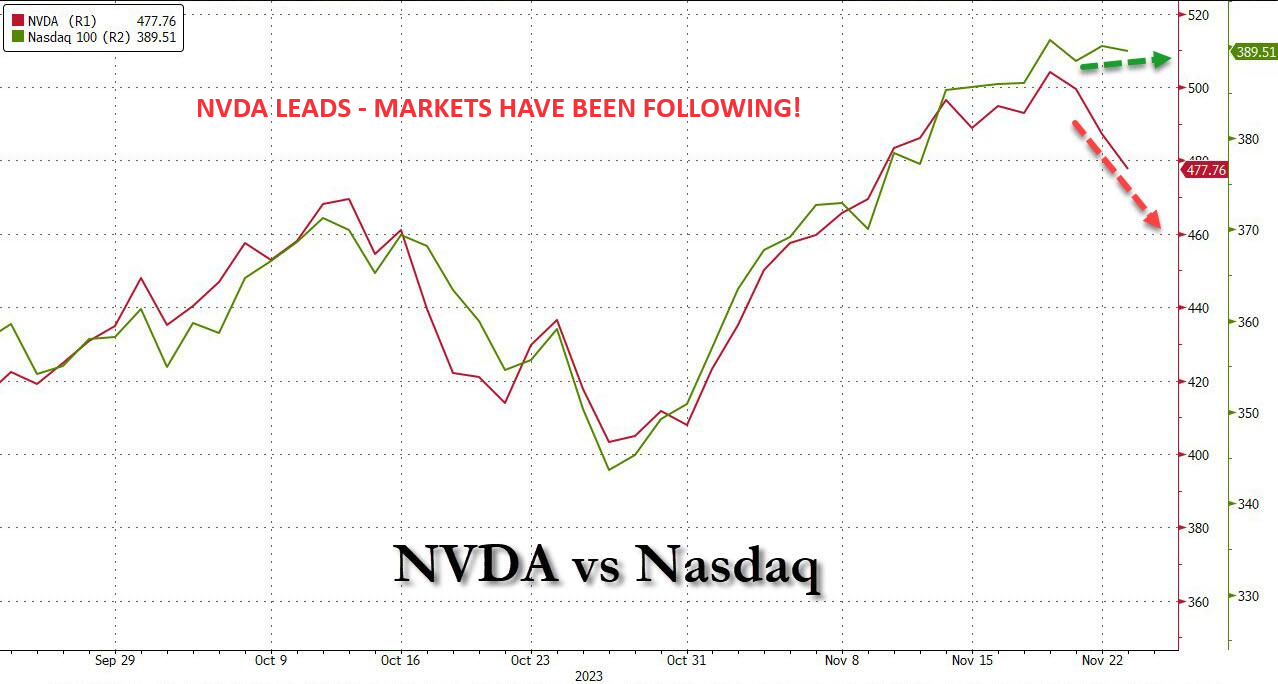
WILL AI MOMENTUM SUSTAIN THE RALLY?
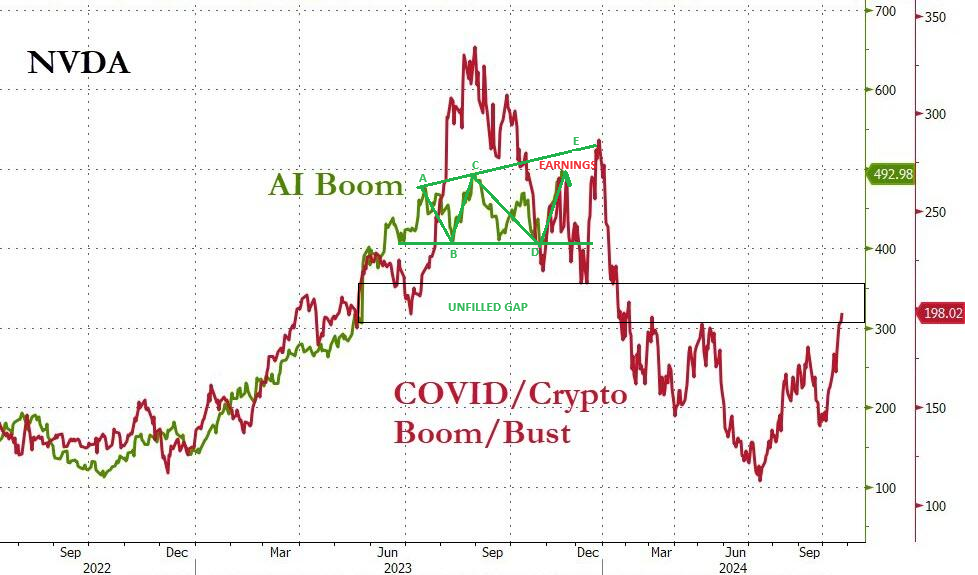
NVIDIA EARNINGS WARNING THE BIG NEWS OF THE WEEK
Click All Charts to Enlarge
1 – SITUATIONAL ANALYSIS
 THANK GOD FOR AI & NVDA
The 2 month back test shows the strongest period for market performance over the last 25 years. Year-to-Date returns:
-
- Amazon +82%
- MSFT +65%
- Google 63%
- Apple +54%
Q3 EPS GROWTH – Year-Over-Year % CHANGE.
Looking at it this way and knowing that markets love momentum, it is almost like we should be higher.
-
- Nvidia: +1,274%
- AMD: +350%
- Amazon: +315%
- META: +163%
- Google: +41%
- Microsoft: +27%
- Netflix: +20%
- Apple: +13% (Bilello)
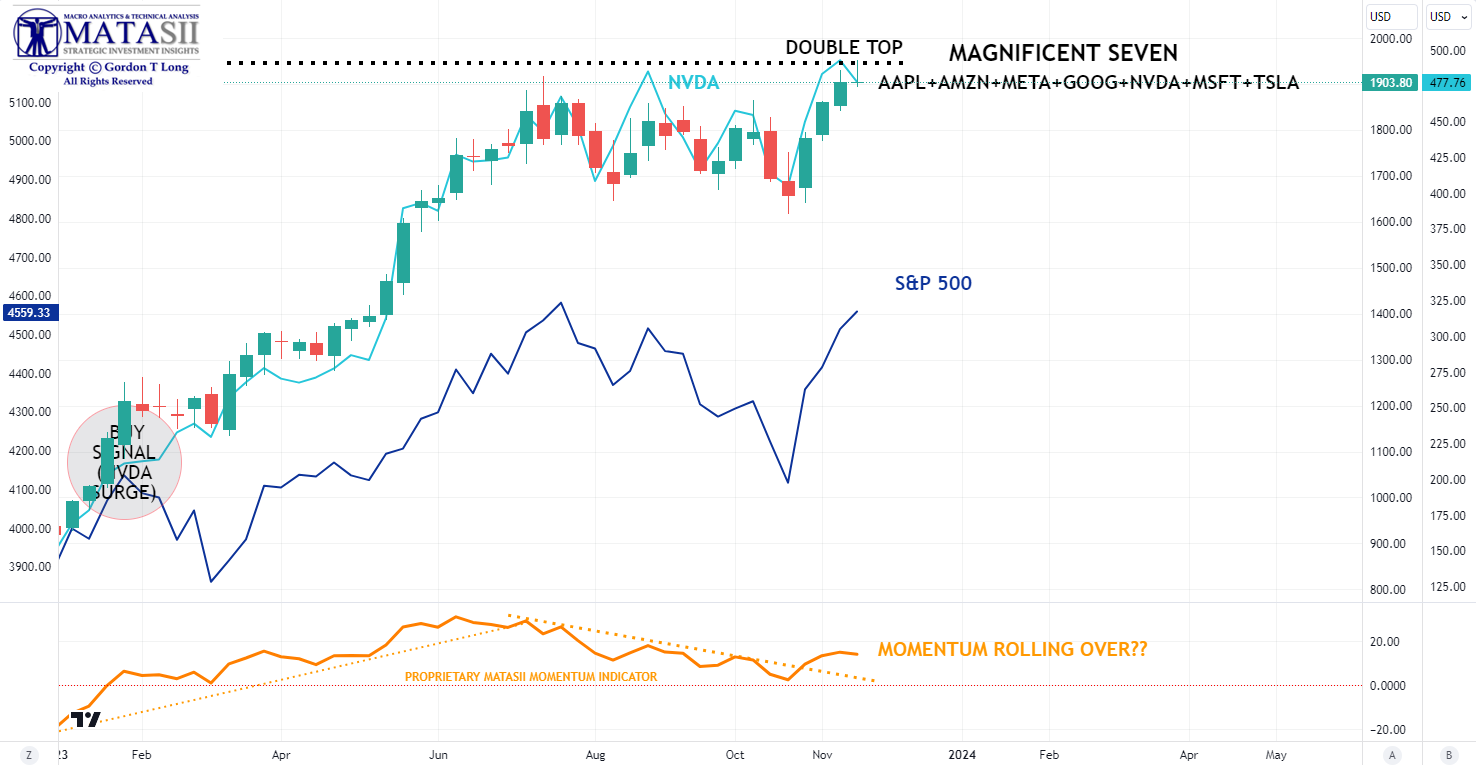
WITHOUT NVIDIA & AI
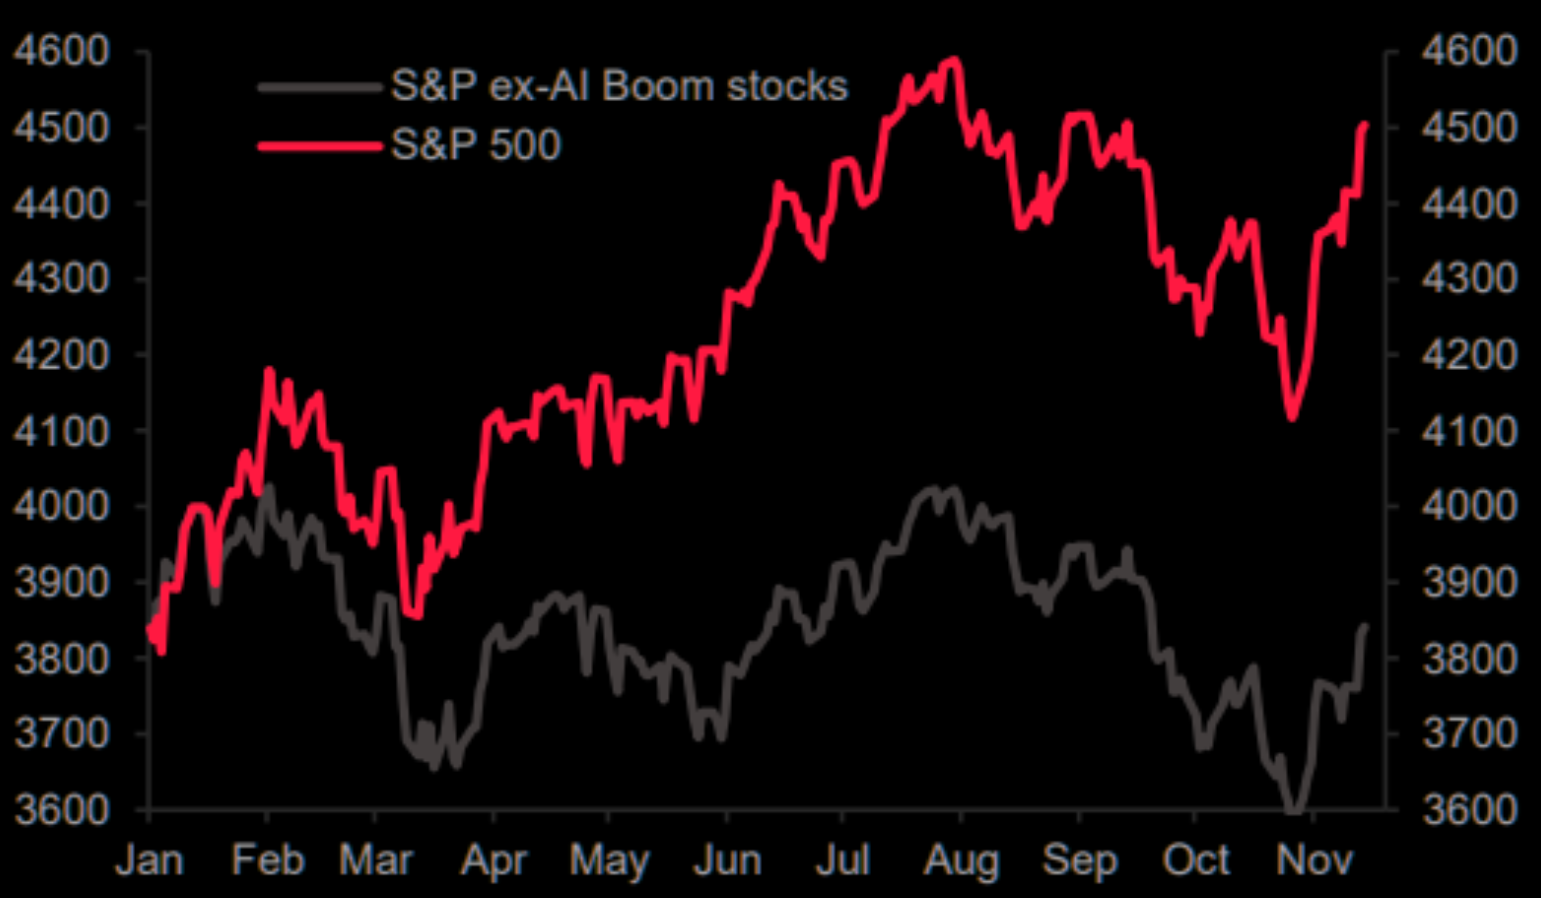 As good as the above results are, they are dramatically lower without AI & NVDA. Overall markets are being held up by the Magnificent 7 and NVDA is the major contributor to the Magnificent 7
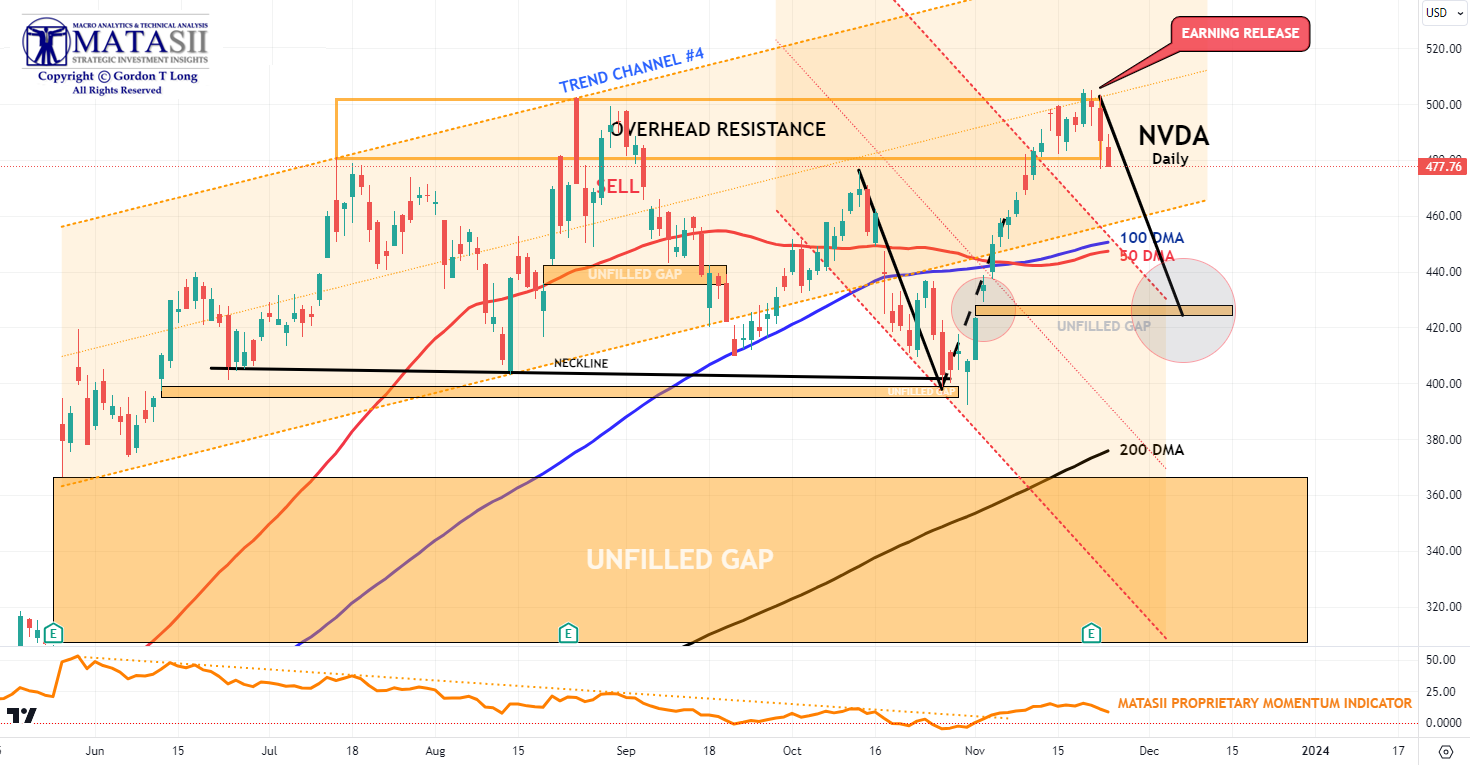
NVDA EARNINGS RESULT: “Sell on the News”
-
- TUESDAY 11-21-23: Nvidia (NVDA) – Q3 adj. EPS 4.02 (exp. 3.37), Q3 revenue USD 18.12bln (exp. 16.18bln)
- Nvidia (NVDA) had a blowout report; top and bottom line beat with Q4 revenue guidance better-than-expected.
- Although it did state it expects sales to China to decline significantly in Q4, but it will be offset by growth in other regions, noting its competitive position has been harmed from US export controls.
- Post-earnings, NVDA’s PT was lifted at numerous brokerages including, but not limited to BofA, UBS, MS, WFC, GS and JPM.
- Some analysts cited by Bloomberg suggested that the results “failed to satisfy the loftier expectations of shareholders who have bet heavily on an AI boom. Bloomberg suggested that the results “failed to satisfy the loftier expectations of shareholders who have bet heavily on an artificial intelligence boom.”
- The chipmaker settled 1.75% lower after hours initially falling as much as 6.3%.
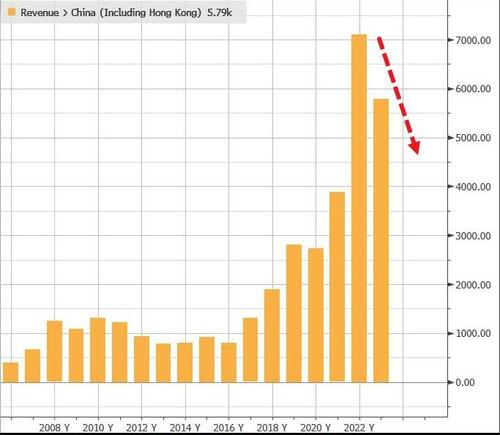 THE REALITY OF A SLOWING GLOBAL ECONOMY
-
- Friday 11-24-23 – Nvidia (NVDA) has reportedly informed customers that it is delaying the launch of the China-targeted H20 AI chip until Q1 2024 with the delay, due to issues server manufacturers are having integrating the H20 chip, according to Reuters sources. (NVDA was down -2.3% in pre-market announcement trading.)
39 PAGE INVESTOR SLIDE PRESENTATION
NVIDIA INCOME STATEMENT VISUALIZED – Q3 2024
BEWARE: Hedge Funds Are Quietly Dumping Tech Stocks Amid Record Buybacks, Retail Buying Spree and Rate of Market Rise
YOUR DESKTOP / TABLET / PHONE ANNOTATED CHART
Macro Analytics Chart Above: SUBSCRIBER LINK
2 – TECHNICAL ANALYSIS
 S&P 500
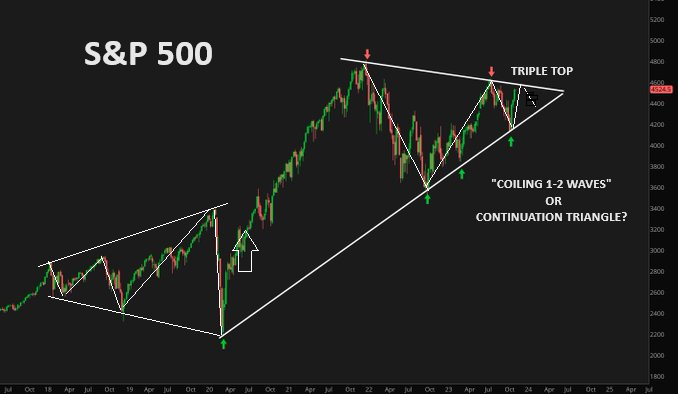
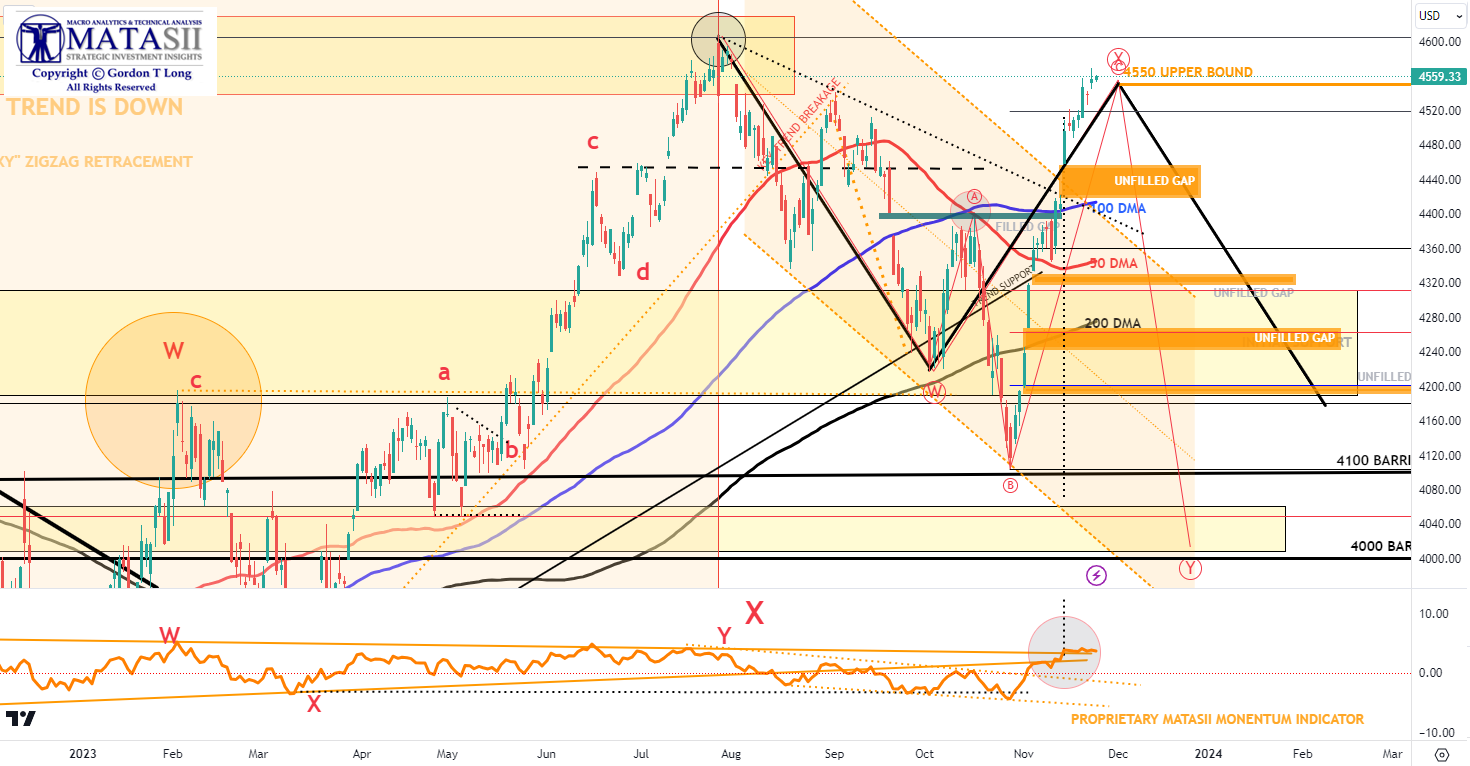
Markets always confuse the most number of investors and exert “maximum pain”! The S&P 500 chart to the right demonstrates that we have either a “Coiling” set of Elliott Wave 1-2 Waves, (saying we are headed lower), or an emerging Continuation Triangle, (suggesting we are headed higher)?
We suspect it turns out to be a continuation triangle that delivers a larger double top (Santa Claus Rally & strong seasonal influence), but with only a little more upside. The market then falls making the “Coiling 1-2” counts viable.
I have seen this sort “head fake” resolution before!
SOON EXPECT A PERIOD OF CONSOLIDATION WITH THE S&P 500 MOVING DOWN TO THE
100 DMA AREA AND FILLING THE UNFILLED GAP.
YOUR DESK TOP / TABLET / PHONE ANNOTATED CHART
Macro Analytics Chart Above: SUBSCRIBER LINK
RUSSELL 2000
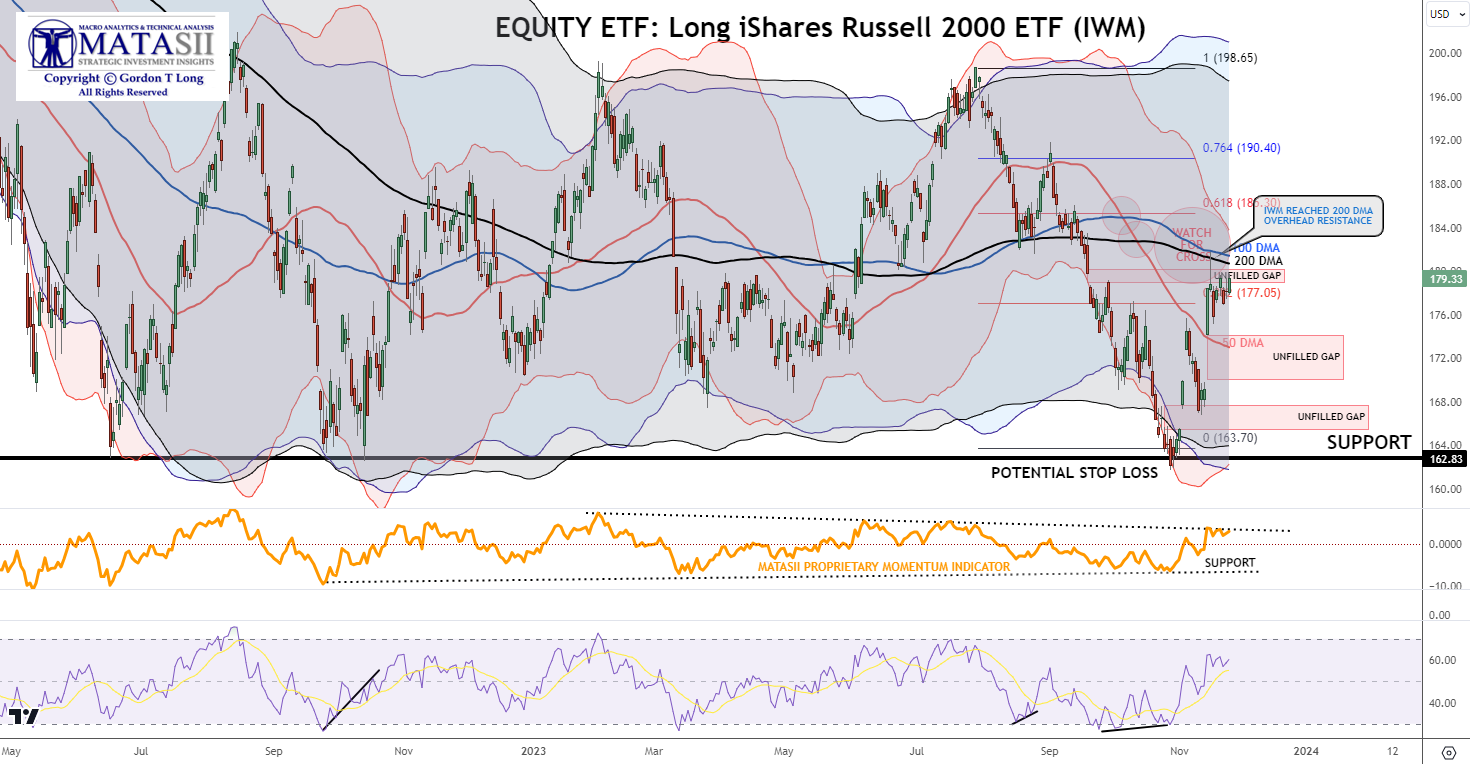
Equity ETFs: Long iShares Russell 2000 ETF (IWM)
NOTE: The Russell 2000 is the “King of Mean Reversion”. Trading mean reversion is often very painful, especially at turning points, as you end up buying the most brutal selling and end up shorting the most intense buying. The Russell continues to be the king of range trading….bouncing violently once again.
WE SUSPECT THE IWM WILL STAY BELOW (BUT TEST) THE 100-200 DMAs NEXT WEEK, ALLOWING THEM TO CROSS – A DOWNWARD CROSS IS NEGATIVE & SELL SIGNAL FOR INSTITUTIONAL INVESTORS.
EXPECT A PERIOD OF CONSOLIDATION BETWEEN OVERHEAD RESISTANCE AND SUPPORT.
YOUR DESK TOP / TABLET / PHONE ANNOTATED CHART
Macro Analytics Chart Above: SUBSCRIBER LINK
FAIR USE NOTICE This site contains copyrighted material the use of which has not always been specifically authorized by the copyright owner. We are making such material available in our efforts to advance understanding of environmental, political, human rights, economic, democracy, scientific, and social justice issues, etc. We believe this constitutes a ‘fair use’ of any such copyrighted material as provided for in section 107 of the US Copyright Law. In accordance with Title 17 U.S.C. Section 107, the material on this site is distributed without profit to those who have expressed a prior interest in receiving the included information for research and educational purposes. If you wish to use copyrighted material from this site for purposes of your own that go beyond ‘fair use’, you must obtain permission from the copyright owner.
NOTICE Information on these pages contains forward-looking statements that involve risks and uncertainties. Markets and instruments profiled on this page are for informational purposes only and should not in any way come across as a recommendation to buy or sell in these assets. You should do your own thorough research before making any investment decisions. MATASII.com does not in any way guarantee that this information is free from mistakes, errors, or material misstatements. It also does not guarantee that this information is of a timely nature. Investing in Open Markets involves a great deal of risk, including the loss of all or a portion of your investment, as well as emotional distress. All risks, losses and costs associated with investing, including total loss of principal, are your responsibility.