Gordon T Long
Global Macro Research | Macro-Technical Analysis
MACRO
US ECONOMICS
PUBLIC FRUSTRATION WITH THE ECONOMY IS ACCELERATING!
OBSERVATIONS: The Bidenomics Scorecard As We Enter An Election Year…
An increasing number of surveys clearly show the US public is frustrated with the economy. The simple reality is people are worse off today than they were when President Biden assumed office. More people are voicing their dissatisfaction, but the Biden regime remains stubbornly defiant. This begs the question, why are so many down on the economy when the White House is constantly touting its economic record? It seems to be a consistent refrain of “don’t believe your lying eyes but rather believe our data”?
As an example of what is blatantly going on, last week the White House touted that “the US was seeing lower prices on items from fuel to food”. The media, from news feeds like Reuters to mainstream media, diligently pumped this exact narrative – unaltered. The problem is that it was completely wrong. Inflation is down but prices are actually higher. A falling inflation rate actually means prices are going up at a slower rate. This is not an opinion but an undeniable fact. This is the sort of nonsense we are fed. I suspect in this case it was as much incompetence as it was spin? The result is the same – growing public disbelief!
The truth is people are demonstrably worse off, and even the administration’s own figures on inflation, jobs and falling household incomes, clearly prove it! Yet instead of acknowledging the facts, the administration makes excuses, while its media “lap dogs” try, but fail to gaslight Americans. Excuses however only last so long before public tolerance stops buying them and begins getting angry every time they pay their rent, buy food or shop. I sense we have reached that point?
Since President Biden took office:
- Real earnings have plummeted as prices outpace wages.
- Inflation-adjusted weekly earnings are down about 5%.
- The drop in real earnings has been piled onto the sharp increase in borrowing costs over the last couple of years.
The effect has cost the typical American family the equivalent of almost $7,400 in lost annual income. That’s more than a month’s pay for the median household. It’s even worse if you’re trying to buy a home today. The monthly mortgage payment on a median-price home has more than doubled under Mr. Biden and will cost a family an extra $13,000 every year for the same house. Homes are affordable in just five major metropolitan areas in the country, while rents are equally unaffordable.
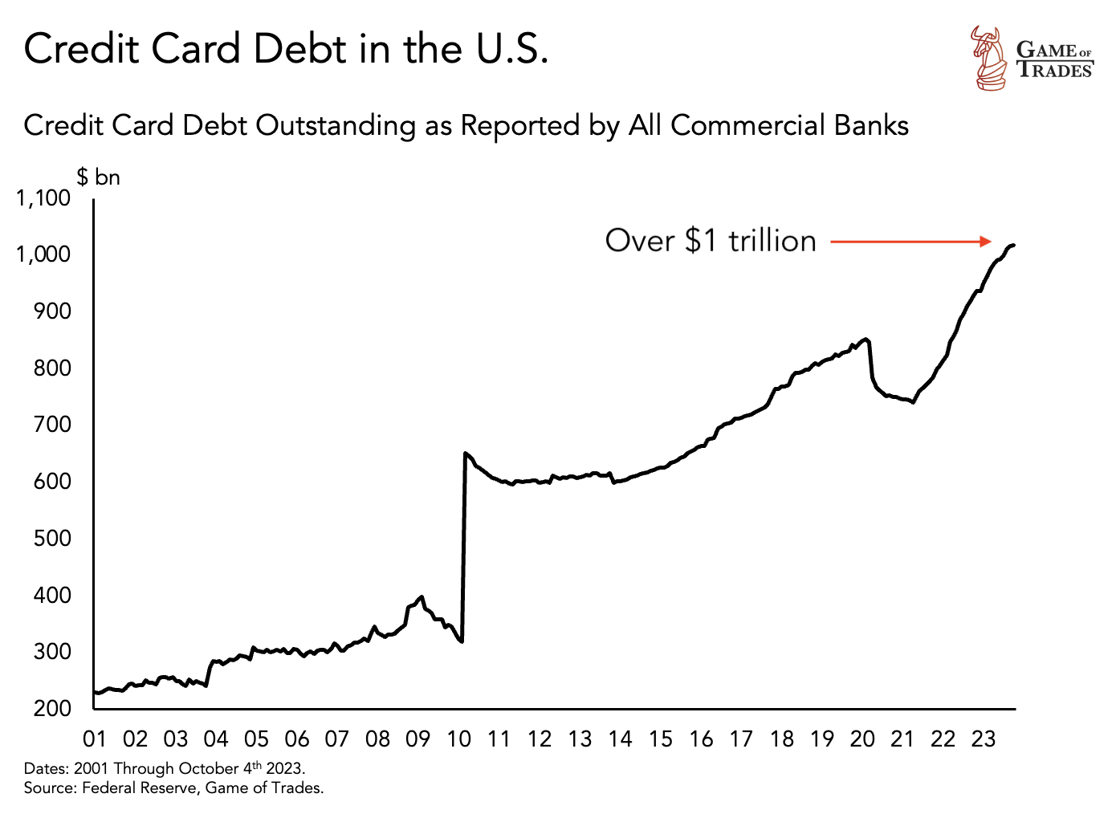
Facing a cost-of-living crisis, it’s no wonder Americans are drowning in over $1 trillion of credit card debt as they struggle to make it from paycheck to paycheck, taking on multiple jobs at the highest level on record. With such a gloomy backdrop, of course, people have soured on Bidenomics. With real earnings having fallen behind inflation for 27 of the last 31 months, the public generally have just had enough.
Additionally, most people are beginning to reject the government takeover of their lives, the confiscation of their earnings and the inflation with debt that comes with it. The White House has shown little willingness to fix things and instead are relying on the media to spin and cover for them.
The public isn’t buying the excuses anymore. Bidenomics is clearly increasingly seen to have been a failure.
WHAT YOU NEED TO KNOW!
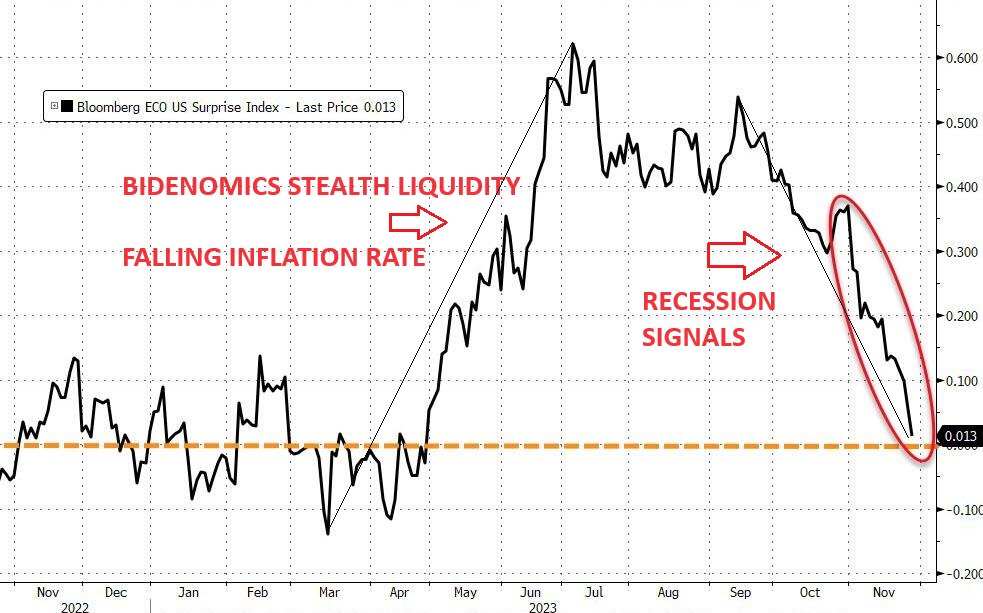 AN ABRUPTLY PLUNGING NEGATIVE US SURPRISE INDEX
This week we have had a steady stream of weak to negative US Economic Data confirming a slowing US economy. This has contributed to a plunging US Surprise Index. First, it was ugly home sales data and a dismal dip back into contraction for Texas manufacturing production. Then it was the Case-Shiller home-prices rising at their slowest rate since March. This was followed with significant downward revisions in the Conference Board consumer confidence data (and labor market weakness). Then the Richmond Fed Manufacturing and Dallas Fed Services showing anything but resilience as the temporary highs of Bidenomics’ spending spree came crashing back to earth as continuing the trend of disappointing macro data.
RESEARCH
SITUATIONAL ANALYSIS: US INDICATORS
- The state of American finances presents a worrisome landscape, characterized by declining savings rates, escalating consumer debt levels and increasing economic vulnerability.
- With only a fraction of Americans prepared for emergencies and a significant portion relying on credit cards to make ends meet, the financial strain is evident.
- As debt accumulates and savings dwindle, the potential for economic repercussions looms, emphasizing the need for individuals and policymakers to address these challenges and promote financial resilience.
- The labor market is undoubtedly deteriorating and sending signals that have been historically valuable warnings of a coming recession. However, the massive fiscal stimulus and odd behavioral changes occurring since 2020 should make us consider that this time may be different. It’s tough to tell if the labor market is warning of a recession or just normalizing to a more sustainable level of employment.
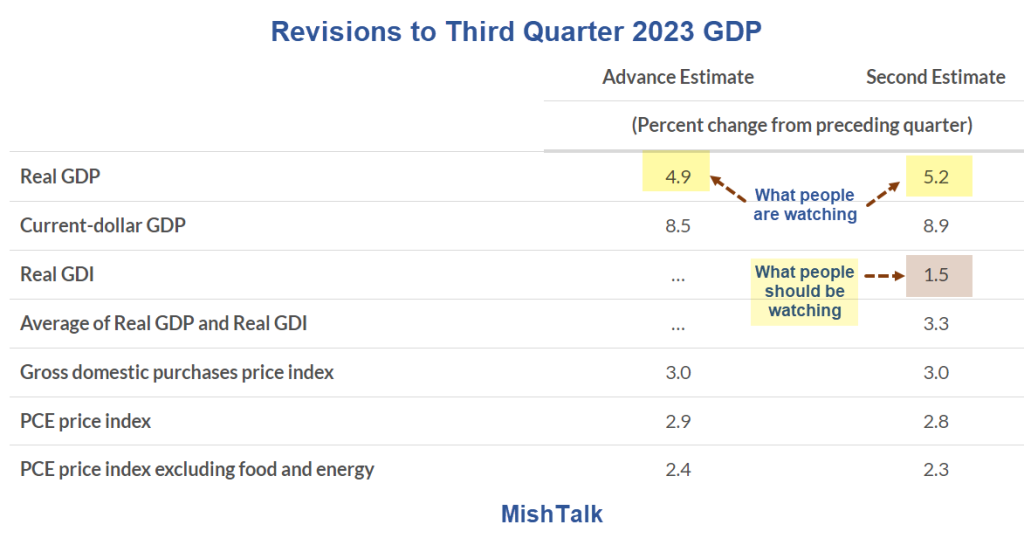
THE MONSTROUS GDP v GDI GAP TELLS US WHAT IS WRONG – The US Consumer Is Increasingly Tapped Out
-
- The gap between growth of GDP and Gross Domestic Income (GDI) hasn’t been this large since 2007!
- Q3 GDP: 5.2%. Q3 GDI: 1.5%
- This tells us that the US economy is in significantly worse shape than currently perceived.
- Based on GDI, a very reasonable case can be made that the economy went into recession and/or is still flirting with recession.
COP-28: An Attempt At Halting The Fracturing of Climate Change Commitments
-
- Delegates meeting in the United Arab Emirates will attempt decisions and agreement about issues including:
- The fate of coal, oil and natural gas
- Cutting greenhouse gas pollution
- The trillions of dollars needed to avoid and respond to catastrophes
- Dozens of countries — including fossil-fuel-dependent nations like China and the U.S. — are backing a push to triple renewable energy capacity and double energy efficiency.
- COP-28 is expected do so amid hardening divisions over trade, wars on two continents and economic instability.
- Delegates meeting in the United Arab Emirates will attempt decisions and agreement about issues including:
GLOBAL ECONOMIC REPORTING: What This Week’s Key Global Economic Reports Tell Us?
-
- CONTINUOUS JOBLESS CLAIMS: Surge to Two Year High!
- US PMI: A 13 Sigma Variance Shocker with no real explanation of what changed so quickly?
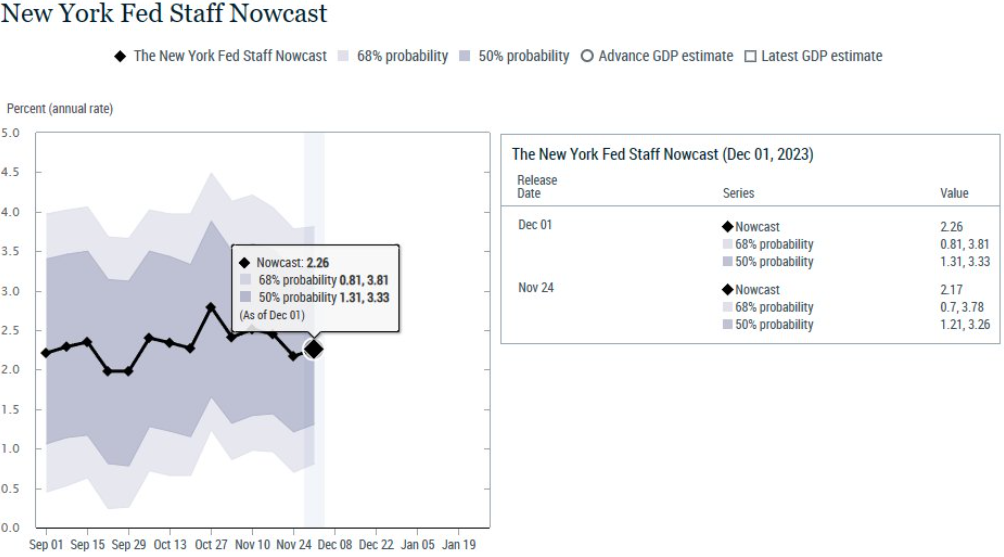
- US Q3 GDP: Raised to 5.2%, meanwhile Q4 expectations were lowered to < 2%??
DEVELOPMENTS TO WATCH
 CHINA GOLD PURCHASES – China Is Back Buying Again, as They Did Last Fall!
-
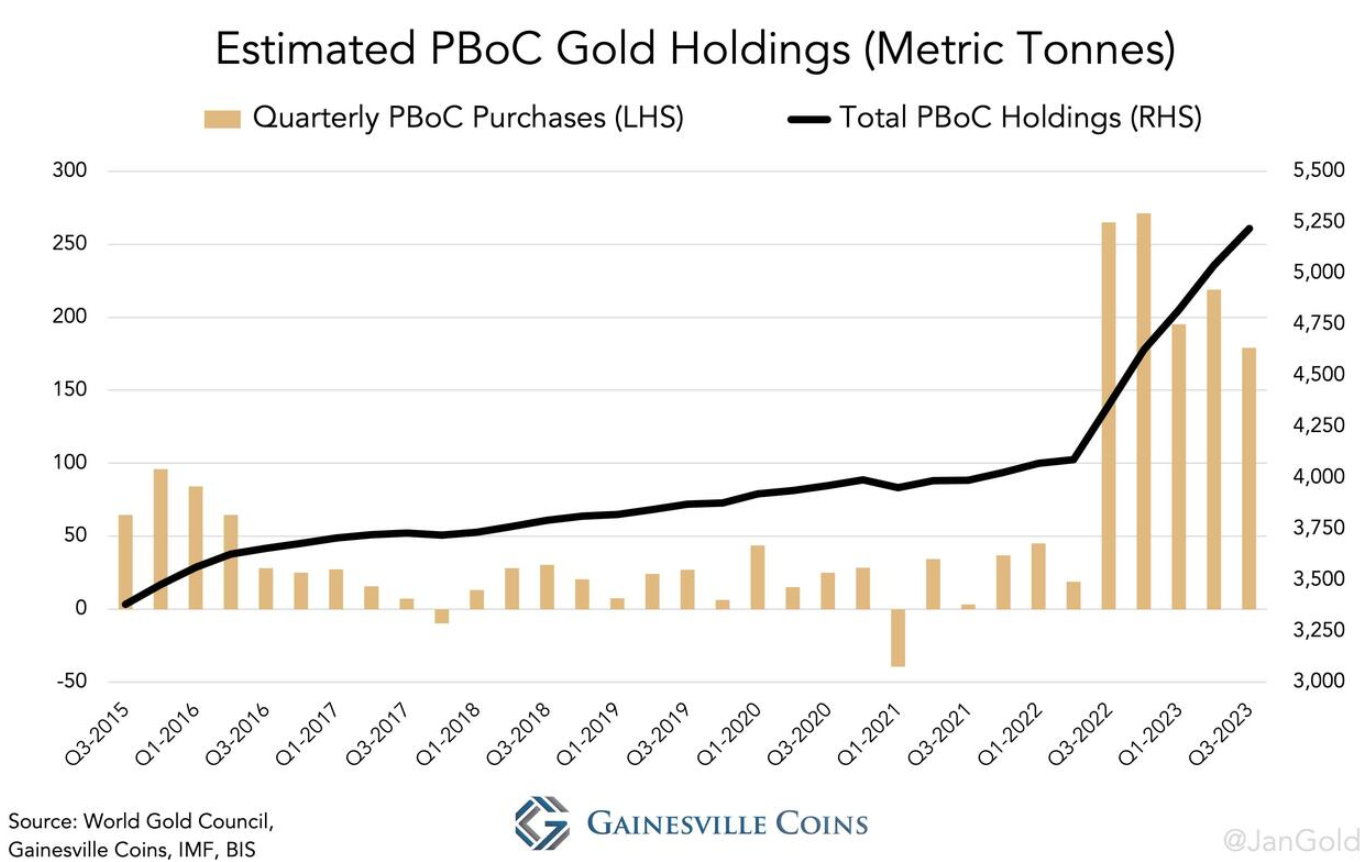
- According to unofficial tallies – such as that kept by Gainesville Coins analyst Jan Nieuwenhuyse – total gold purchases by the Chinese central bank (reported and unreported) are significantly bigger than what has been officially disclosed, and in Q3 alone China purchased 179 tones of physical. Year-to-date the PBoC bought 593 tones, which is 80% more than what it bought in the first three quarters last year.
- As such, China’s total estimated gold holdings are 5,220 tones, more than twice what’s officially disclosed at 2,192 tones.
SITUATIONAL ANALYSIS: US INDICATORS
Rising Debt, Falling Savings and Economic Vulnerability
As the American economy continues to evolve, it is crucial to assess the state of personal finances and their potential impact on the broader financial landscape. Let’s delve into the concerning trends in savings, debt levels and economic vulnerability that are prevalent among Americans today, through a set of charts published last week by Game of Trade .
Declining Savings and Financial Strain
A recent study revealed that only 39% of Americans have enough savings to cover a $1,000 emergency expense, highlighting the precarious financial situation faced by many individuals. Surprisingly, even among those earning $150,000 or more annually, one-third are living paycheck to paycheck and rely on credit cards to make ends meet. This underscores the widespread financial strain experienced across income brackets.
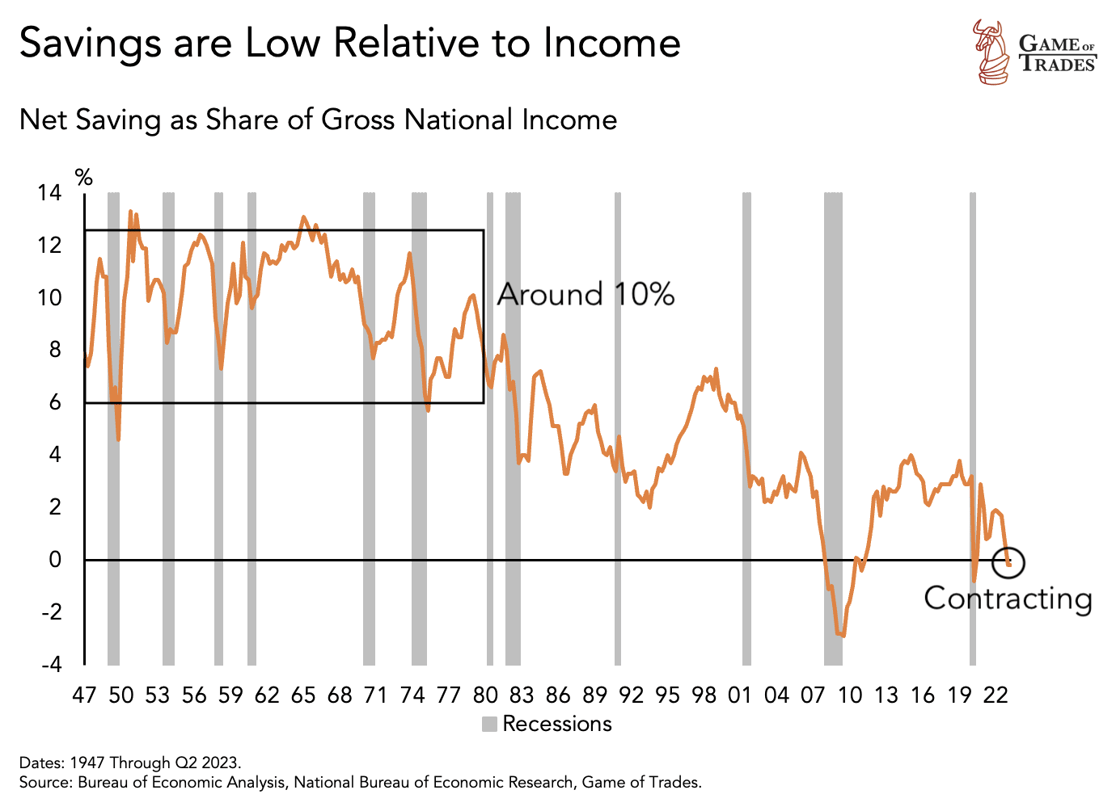
Historically, Americans saved around 10% of their income annually from the 1940s to the 1970s. However, in recent years, this savings metric has been contracting, indicating a concerning trend of spending more than earning. The decline in savings relative to income signifies a growing challenge in building financial security and preparing for the future.
Soaring Consumer Debt Levels
 The Fed’s decision to raise rates from 3% to 5% in 1929 was an attempt to curb stock market speculation.
However, it was followed by the largest stock market crash in US history. This raises the question of whether today’s economy can withstand rates higher than those during the Financial Crisis and the Great Depression.
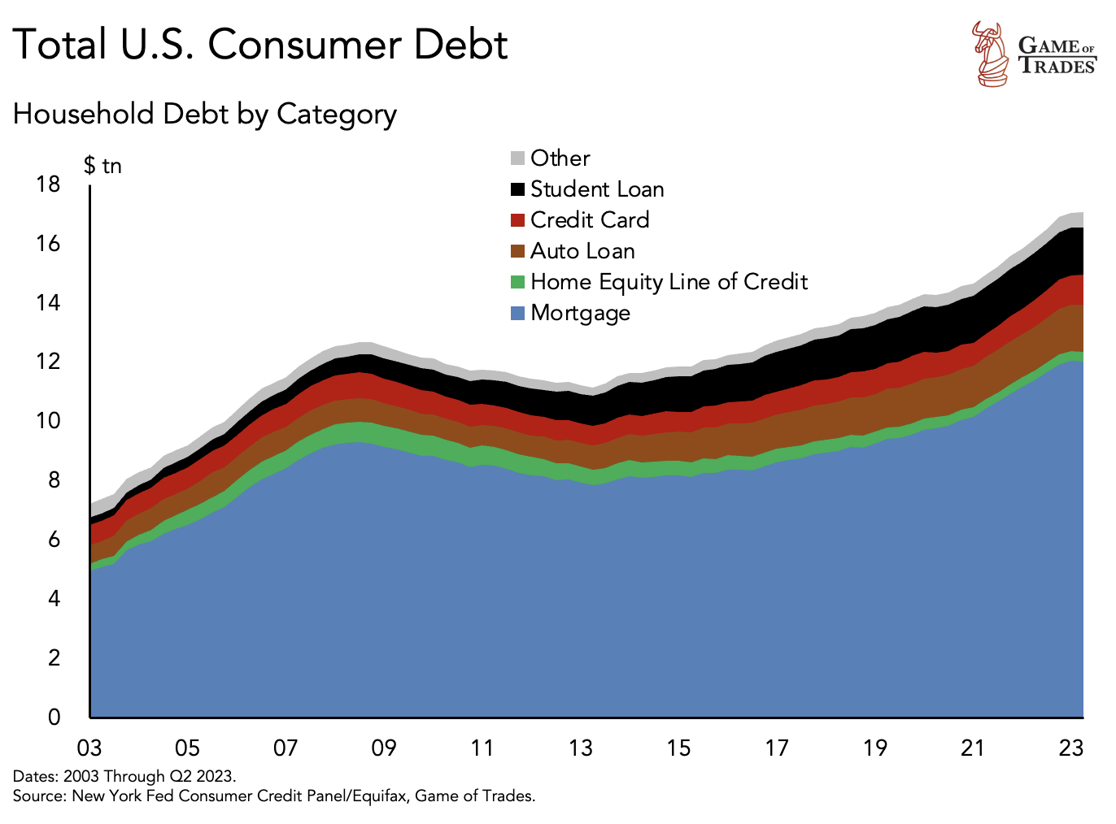
In 2023, total consumer debt reached a staggering $17 trillion, with mortgages constituting a significant portion. The increase in mortgage debt was a key factor behind the 2008 Financial Crisis. While mortgage debt has come down substantially relative to total household debt since then, rising home prices and high mortgage rates have contributed to housing unaffordability.
Financial Struggles and Vulnerability
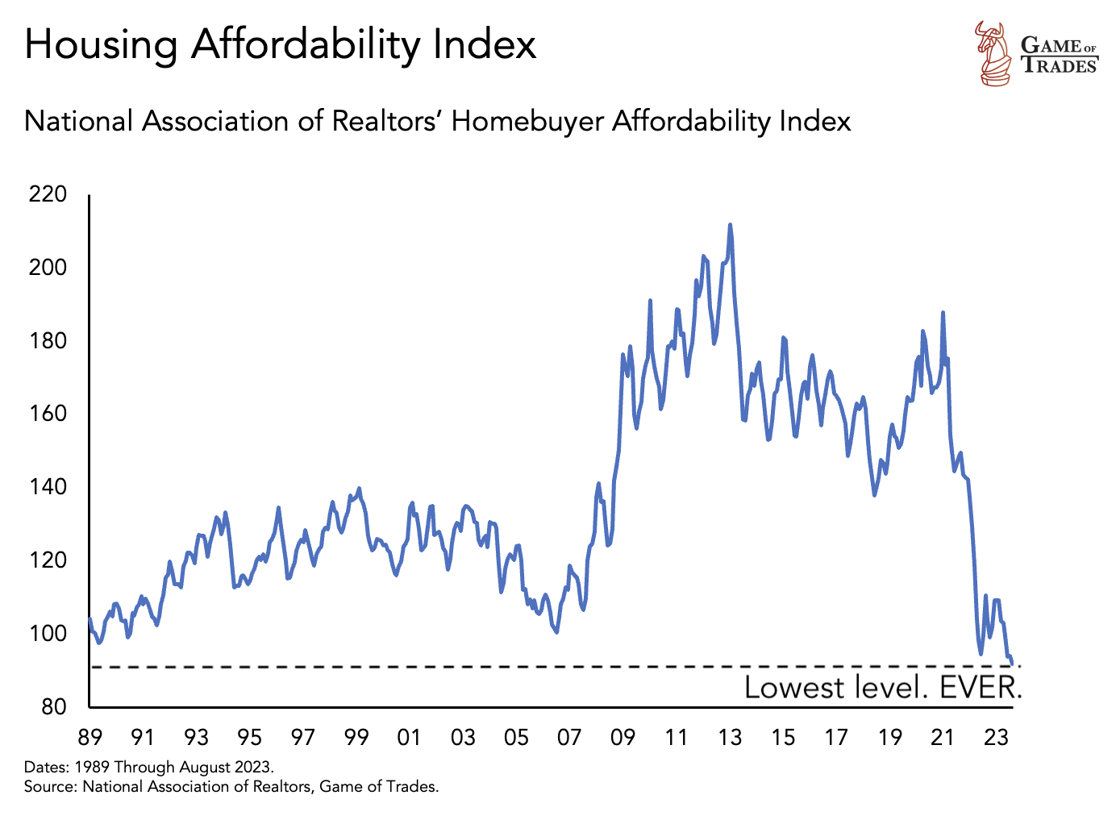 The housing affordability index is currently at its lowest levels since the 1980s, indicating a significant challenge for prospective homebuyers.
Rising home prices, nearly doubling since 2012, coupled with mortgage rates at 20+ year highs, have made home purchases extremely expensive.
This adds to the financial strain experienced by many Americans.
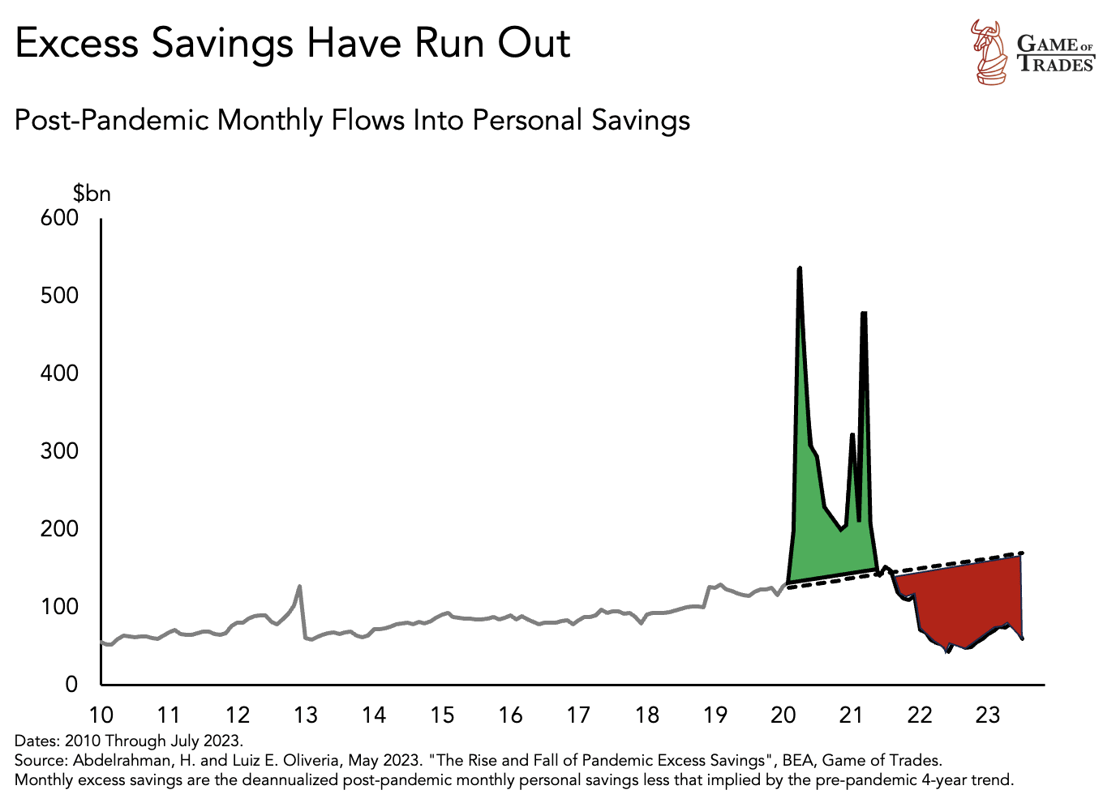
The economic impact of the COVID-19 pandemic has left many individuals struggling to make ends meet. As a result, numerous people have depleted their post-pandemic savings, exacerbating their financial vulnerability.
Escalating Credit Card Debt and Defaults
 Over the past two decades, there has been a significant increase in credit card debt accumulation. In the last year alone, the yearly change in credit card debt rose by over 20%, marking the largest increase since 2000. This trend is currently continuing with a growth rate of 10%.
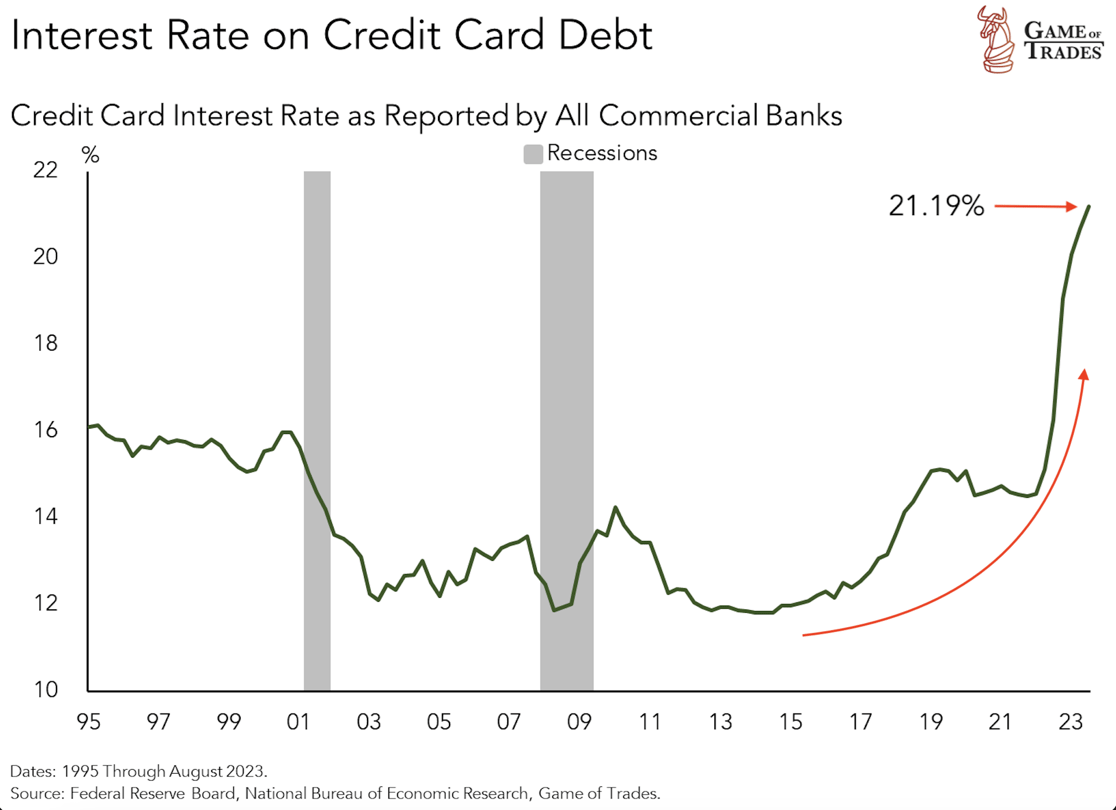
Credit card interest rates have reached their highest level ever, surpassing 21%. Compared to 2014 when rates were at 12%, it is now almost twice as expensive to carry credit card debt. These elevated rates contribute to the financial burden faced by individuals, making it even more challenging to escape the cycle of debt.
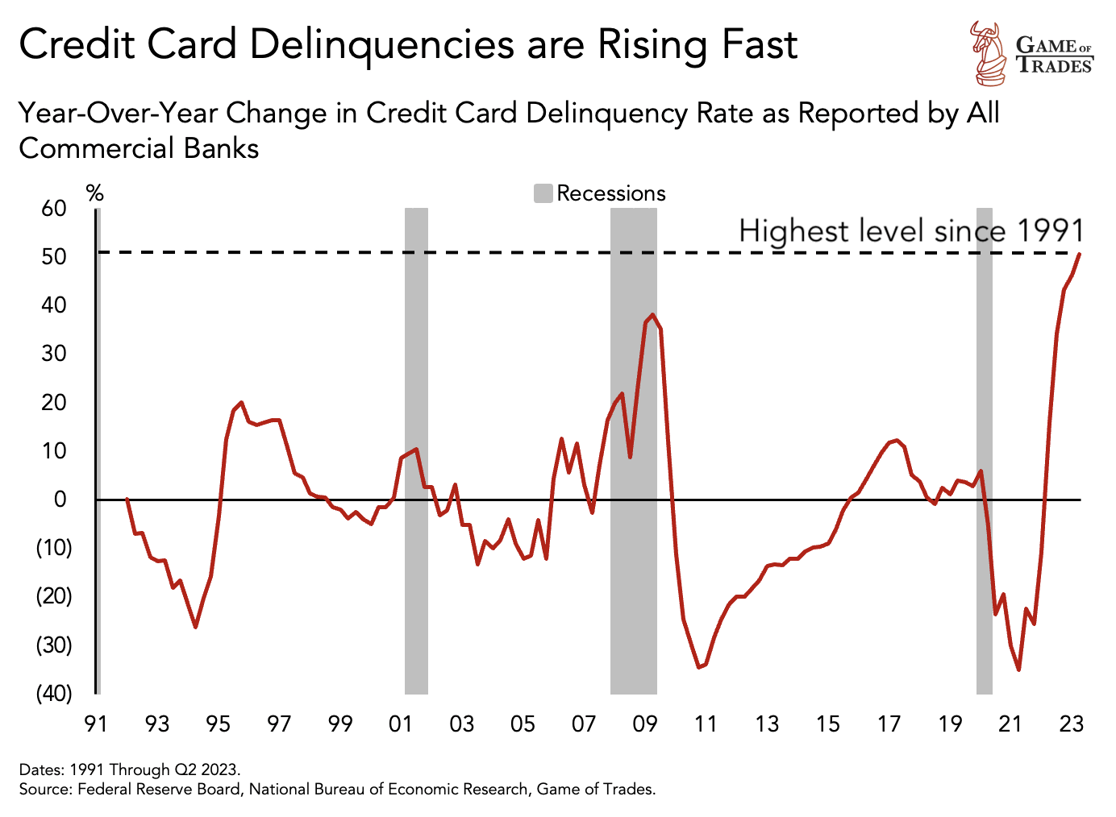 As a consequence of rising debt and high interest rates, credit card defaults have risen substantially in the past two years.
Although current levels remain historically low, the rate of change in credit card defaults is now at the fastest pace ever.
In 2023, defaults have increased by 50% compared to just a year ago, surpassing levels seen during the Financial Crisis.
Economic Vulnerability and Future Outlook
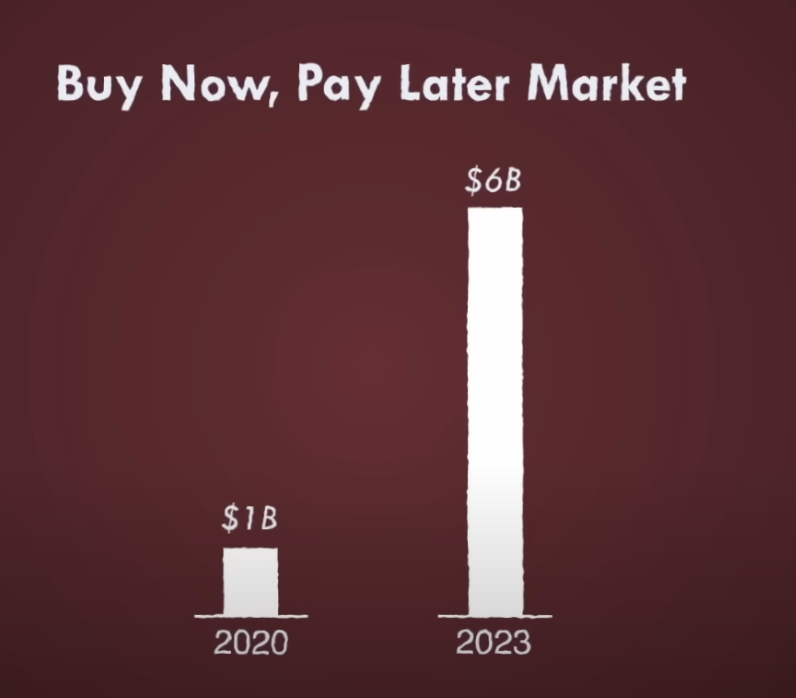 Consumer behavior has undergone a radical shift, as evidenced by the rapid growth of the Buy Now Pay Later market. Within just three years, this market has expanded from $1 billion to $6 billion, indicating a growing reliance on credit for immediate purchases.
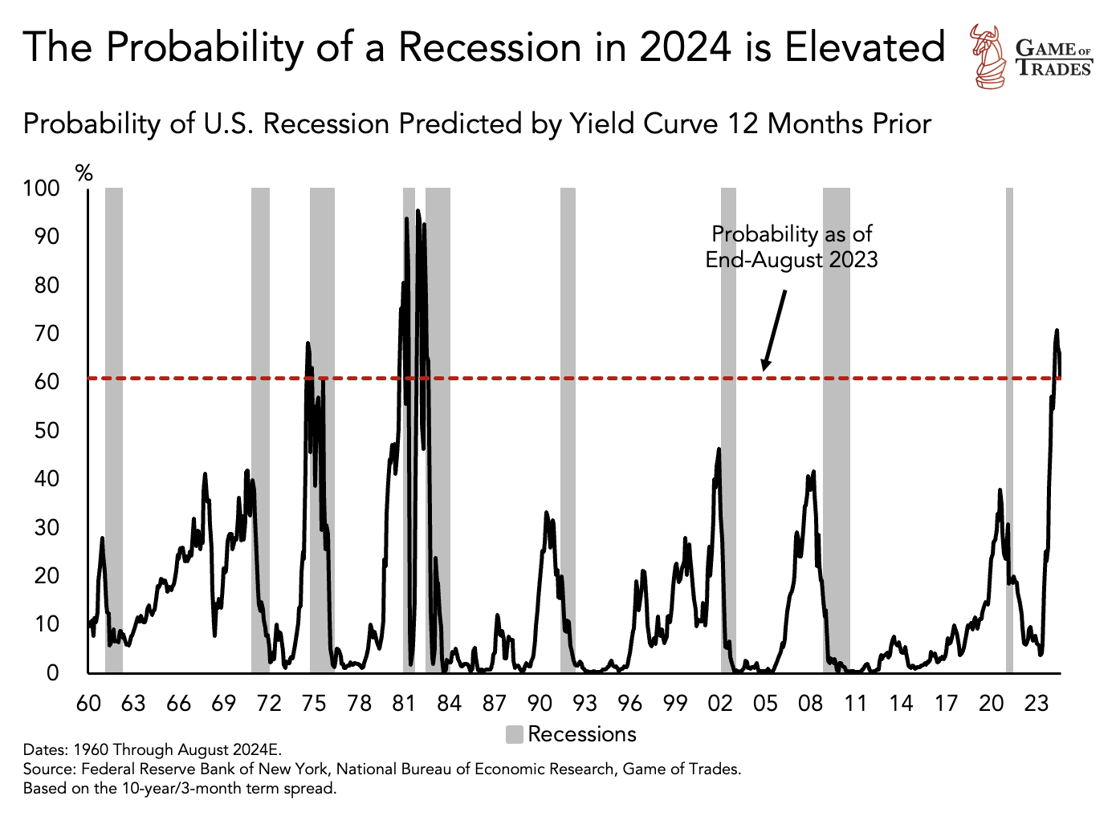
Considering the rising debt levels, diminishing savings and economic vulnerability, the ability of Americans to withstand a future recession is doubtful. The probability of a recession, predicted by the yield curve, stands at around 60%. Historically, such levels have often resulted in sharp economic downturns. In the event of a recession, the government may need to print more money to mitigate economic volatility, further exacerbating the existing spending problem and triggering long-lasting negative effects in the economy and financial markets.
Conclusion
The state of American finances presents a worrisome landscape characterized by declining savings rates, escalating consumer debt levels and increasing economic vulnerability. With only a fraction of Americans prepared for emergencies and a significant portion relying on credit cards to make ends meet, the financial strain is evident. As debt accumulates and savings dwindle, the potential for economic repercussions looms, emphasizing the need for individuals and policymakers to address these challenges and promote financial resilience.
Michael Lebowitz of RealInvestmentAdvice.com also published a series of charts that are more short term than those above, but further embellish on where the US Economy currently stands.
ECONOMIC DETERIORATION OR NORMALIZATION?
That question best defines the quandary the employment market presents us in determining where the US Economy is headed.
The labor market is undoubtedly deteriorating and sending signals that have been historically valuable warnings that a recession is coming. However, the massive fiscal stimulus and odd behavioral changes occurring since 2020 should make us consider this time may be different.
It’s tough to tell if the labor market is warning of a recession or just normalizing to a more sustainable level of employment.
Chart Links To Examine:
Time will tell, and you now have some data to watch closely to help you answer our question.
THE MONSTROUS GDP v GDI GAP TELLS US WHAT IS WRONG: The US Consumer Is Increasingly Tapped Out
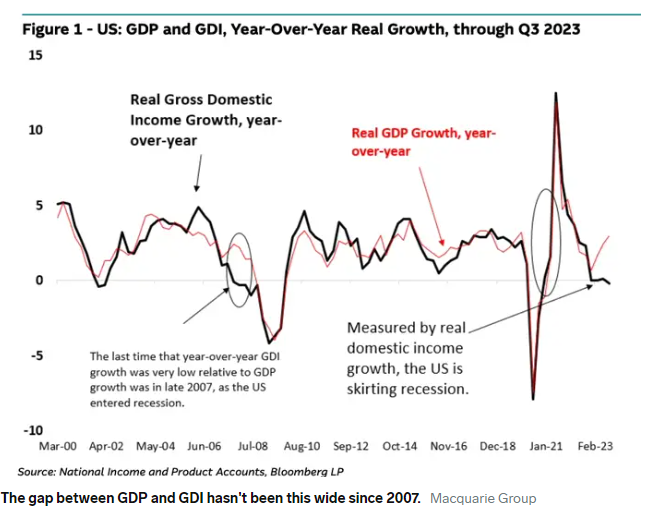 The gap between growth of GDP and Gross Domestic Income (GDI) hasn’t been this large since 2007! This tells us that the US economy is in worse shape than currently perceived.
That’s evidenced by a worrying indicator, which hasn’t flashed a warning this loud since right before the 2008 recession. The US’s monster GDP growth over the third quarter, with the economy expanding at a revised clip of 5.2% has led some commentators to assume the economy is nowhere near a slowdown, but a closer look at GDI — the measure of total compensation given to production — spells a much different and completely ignored story?
In theory, GDI and GDP should be equal to one another, but they can differ due to different methodologies. GDP measures the total value of production in the economy, while GDI measures the total compensation paid towards production. The gap between the two could also explain why Americans feel poorly about the economy despite robust GDP growth. It could also explain why the labor market is beginning to slow: The unemployment rate remains near historic lows, but has climbed by 0.5 percentage points since April. That all suggests there’s below-trend growth in real incomes, if not a recession, especially when considering the drawdown in household savings.
All this doesn’t augur well for consumer spending going forward!
We have been warning of a coming consumer-led slowdown, where sluggish consumers weigh down economic growth and push US economy into a US recession. That slowdown is quickening and now could come sometime before the first quarter of 2024. Markets have been worried about a potential recession for the last year, but have started dialing back their recession bets as inflation continues to cool and prospects for a less hawkish Fed have grown.
 My former Macro Analytics Co-Host Mish Shedlock recently weighed in on this subject. I encourage you to read his coverage – LINK HERE. Mish notes:
-
- The difference between Real GDP and Real Final Sales is a BEA estimate of CIPI, changes in private inventory. Inventory nets to zero over time so Real Final Sales is the bottom line estimate of GDP.
- Real Final Sales is a very strong 3.7 percent, but far less than the headline 5.2 percent that media will be crowing over.
- Real GDI is More Believable.
- Recall that “real” means inflation adjusted. Incomes have been rising, that’s for sure. But how fast are incomes rising relative to inflation? Could it be that 1.5 percent is a much better number than 5.2 percent?
- Based on GDI, a very reasonable case can be made that the economy went into recession and/or is still flirting with recession.
COP-28: An Attempt At Halting The Fracturing of Climate Change Commitments
Climate Change Programs Are Increasingly Under Attack
The United Nations climate talks began Thursday in Dubai with aims to get nearly 200 countries over two weeks with at least 100,000 attendees to agree on the Earth’s future. All this with a major oil producer serving as host country in getting agreements to limit the worst impacts of global warming. Delegates meeting in the United Arab Emirates will attempt decisions and agreement about issues including:
-
- The fate of coal, oil and natural gas
- Cutting greenhouse gas pollution
- The trillions of dollars needed to avoid and respond to catastrophes
Dozens of countries — including fossil-fuel-dependent nations like China and the U.S. — are backing a push to triple triple renewable energy capacity and double energy efficiency. COP-28 is expected do so amid hardening divisions over trade, wars on two continents and economic instability.
MEANWHILE: Global temperatures are still on track for nearly 3 degrees Celsius of warming since pre-industrial times. That’s roughly double the most ambitious goal that nations agreed to in the 2015 Paris Agreement.
Sultan al-Jaber, the UAE oil chief in charge of the talks, is leading an initiative to get oil and gas companies to agree to “nearly” eliminate their emissions of methane, a potent greenhouse gas. (The Biden administration is expected to issue a final rule for its own methane crackdown during the summit.) This could produce real-world impact. But it won’t address the bulk of the industry’s climate pollution — the greenhouse gas emissions produced by burning oil and gas.
WHAT TO WATCH FOR:
-
- How countries respond to the report card showing they’re not living up to their pledges to cut pollution. This sets countries up to craft their next round of climate targets, which would need to aim for even deeper cuts.
- New pledges will start from 2025. So this conference is effectively a stepping stone toward COP30, which is expected to take place in Brazil — possibly the Amazon.
- The focus of the talks now shifts to getting countries to take on the much harder task of agreeing to a fossil fuel exit.
- Whether other non-traditional donors will contribute to the fund for loss and damage. Several countries announced early contributions to the fund Thursday, including the UAE. That could put pressure on other wealthy Gulf nations and emerging ones, such as China, to pony up.
- Pledging will continue, but has already established total donations coming to more than $400 million.
- The U.S. and EU have also argued for a stronger role for the private sector and “innovative” sources, perhaps taxes on aviation or international shipping.
GLOBAL ECONOMIC INDICATORS: What This Week’s Key Global Economic Releases Tell Us
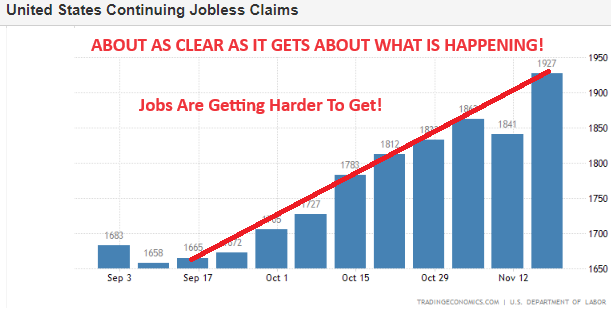 CONTINUOUS JOBLESS CLAIMS: Surge to Two Year High!
Continuing jobless claims in the US, which measure unemployed people who have been receiving unemployment benefits for a while, surged by 86,000 to 1.927 million in the week ending November 18th, marking the highest level since November 2021 and exceeding the market consensus of 1.872 million.
SOURCE: U.S. Department of Labor
US PMI: A 13 Sigma Variance Shocker With No Real Explanation?
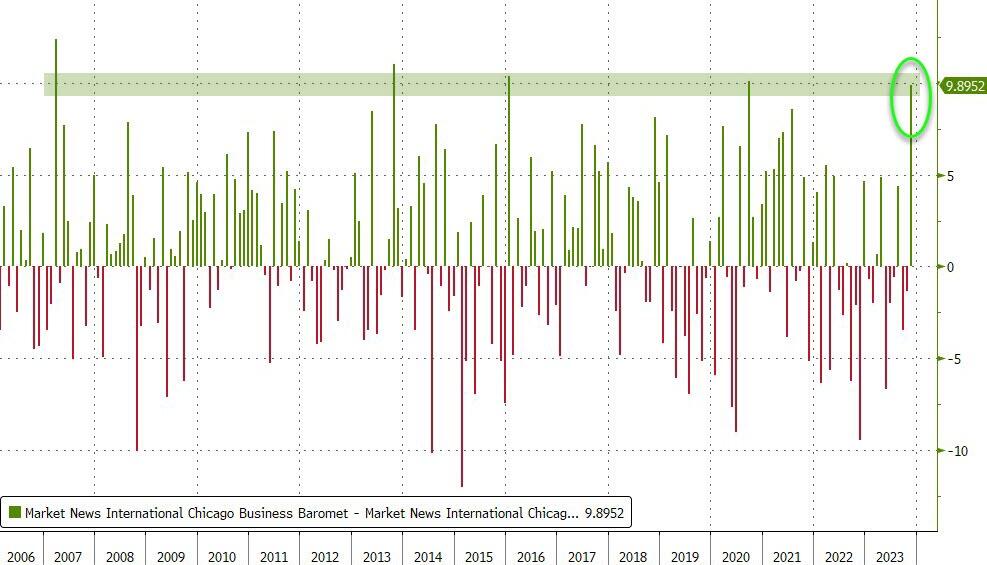 Chicago PMI were expected to remain in contraction at 46 (up very modestly from 44 in October). However, when the actual print hit, it was a 55.8 print.
This was a 13 standard deviation beat to expectations?
This was one of the biggest beats in the series history and additionally one of the biggest MoM increases in the economic series history. It was the first reading above 50 (manufacturing economic expansion) since August 2022.
ALL SIGNAL EXPANSION
- Prices paid rose at a slower pace; signaling expansion.
- New orders rose and the direction reversed; signaling expansion.
- Employment rose at a faster pace; signaling expansion.
- Inventories rose and the direction reversed, signaling expansion.
- Supplier deliveries rose and the direction reversed, signaling expansion.
- Production rose and the direction reversed, signaling expansion.
- Order backlogs fell at a slower pace, signaling contraction.
US Q3 GDP: Raised to 5.2% While Q4 Taken to ~2%?
Meanwhile, after diverging for much of the year, all three regional Feds that do GDP Nowcasts have converged on 2% – a far cry from the “5.2%” GDP print the Biden department of seasonal adjustments “goal seeked” last month.
Latest Q4 Nowcasts:
ATL: 1.2% (2.1% prev)
NY: 2.26% (2.17% prev)
STL: 1.89% (2.04% prev)
ATL has cut their consumer spending number by almost half – now we wait for the rest to catch on to what’s clearly visible…
NOW GO BACK AND RE-READ “THE MONSTROUS GDP v GDI GAP TELLS US WHAT IS WRONG (Above)
GLOBAL MACRO
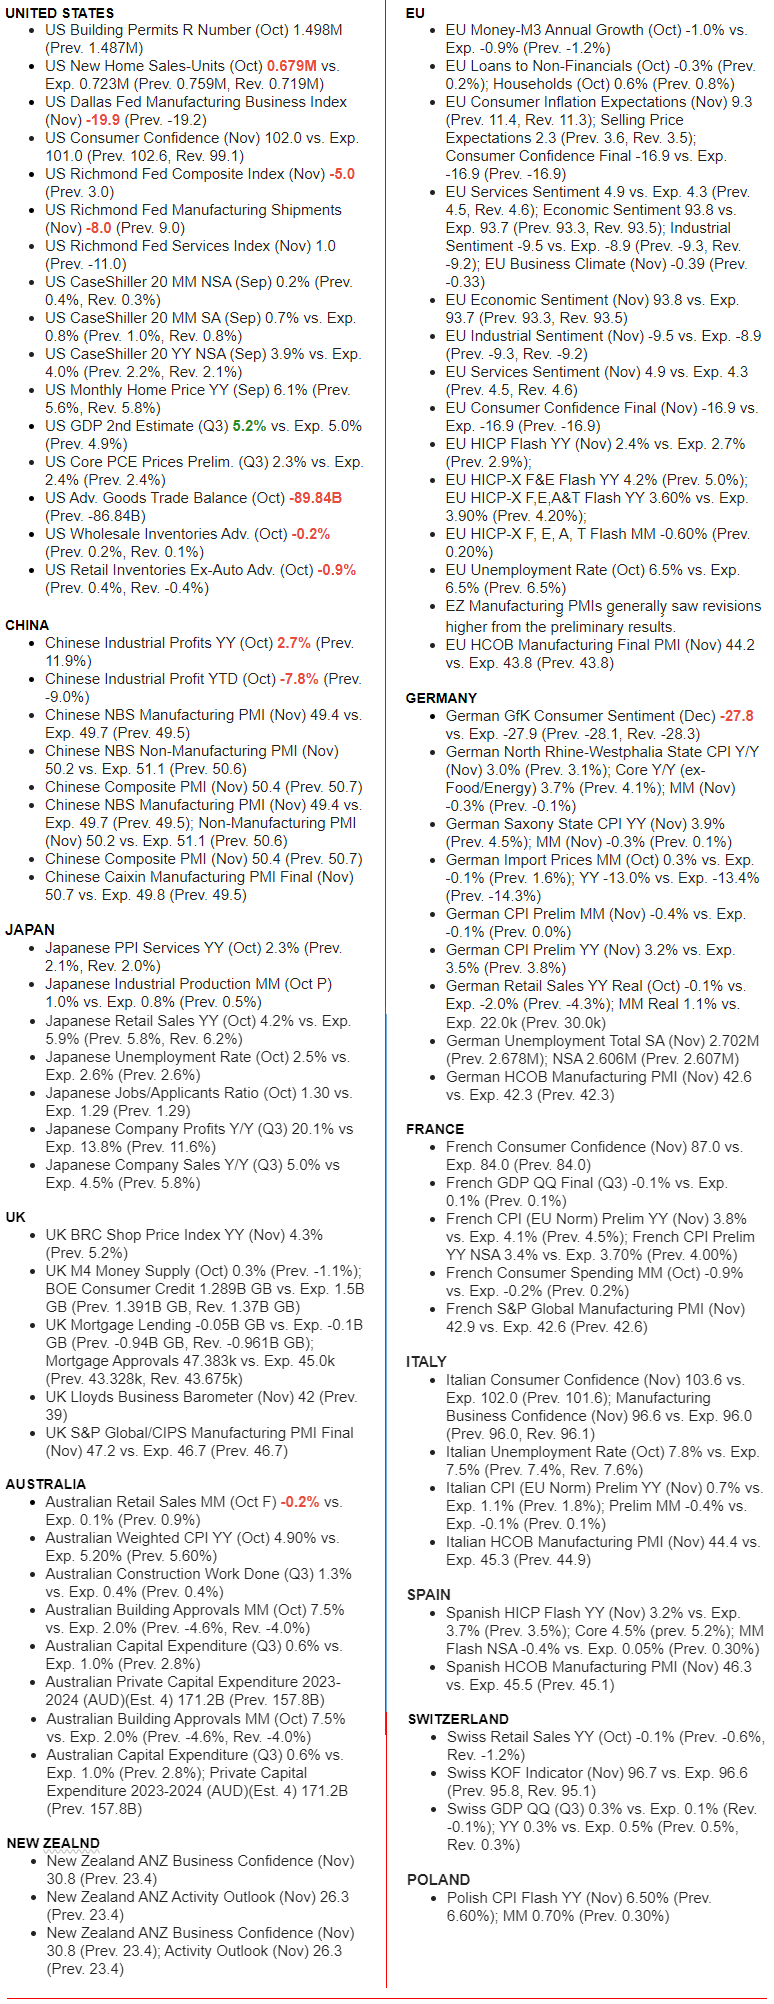
WHAT DOES YOUR SCAN OF THE DATA BELOW TELL YOU? – THE MEDIA AVOIDS BAD NEWS!
We present the data in a way you can quickly see what is happening.
THIS WEEK WE SAW
Exp=Expectations, Rev=Revision, Prev=Previous
DEVELOPMENTS TO WATCH
CHINA GOLD PURCHASES – China Is Back Buying Again as They Did Last Fall!
In our Wednesday issue of “Charts on Gord’s Desk“, we outlined the key technicals in Gold and Silver. We didn’t however revisit the ongoing status of Central Bank Bullion Buying, which we most recently addressed in the September LONGWave video: LONGWave – 09 06 23 – SEPTEMBER – Why Are Central Banks Buying Gold?
What needs to be discussed is the ongoing and current buying of Gold by China. China officially resumed its gold purchases in November 2022 for the first time after a three year “quiet period”, which led a record buying frenzy by central banks in Q4 2022. Chinese and official sector purchases may have single-handedly catalyzed a $150/oz mispricing in gold markets.
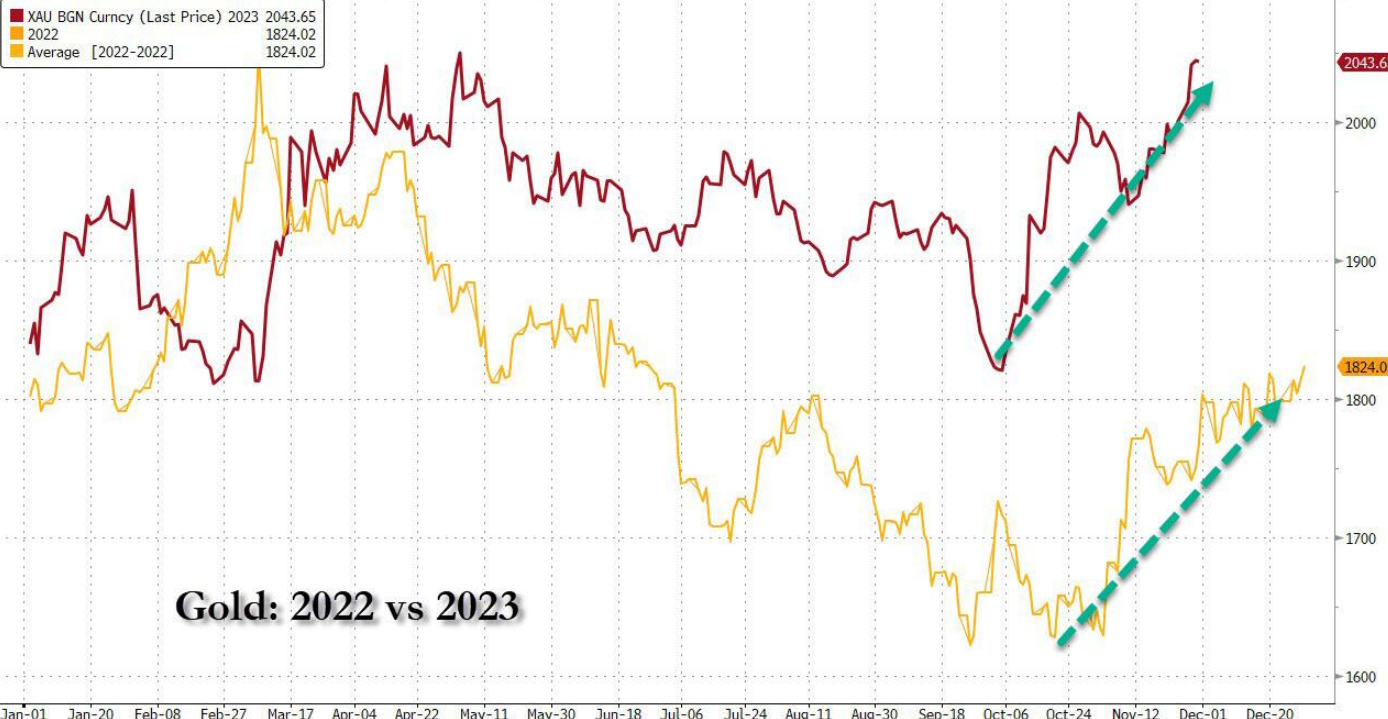 Fast-forwarding to today, analysts are finding that the price action in gold is virtually a carbon copy of what happened last year.
As shown in the chart to the right, the price of gold has also stormed higher during a period of time when we saw an almost identical move back in 2022.
This has resulted in the divergence between gold and real rates hitting unprecedented levels (chart below), which we mentioned Thursday.
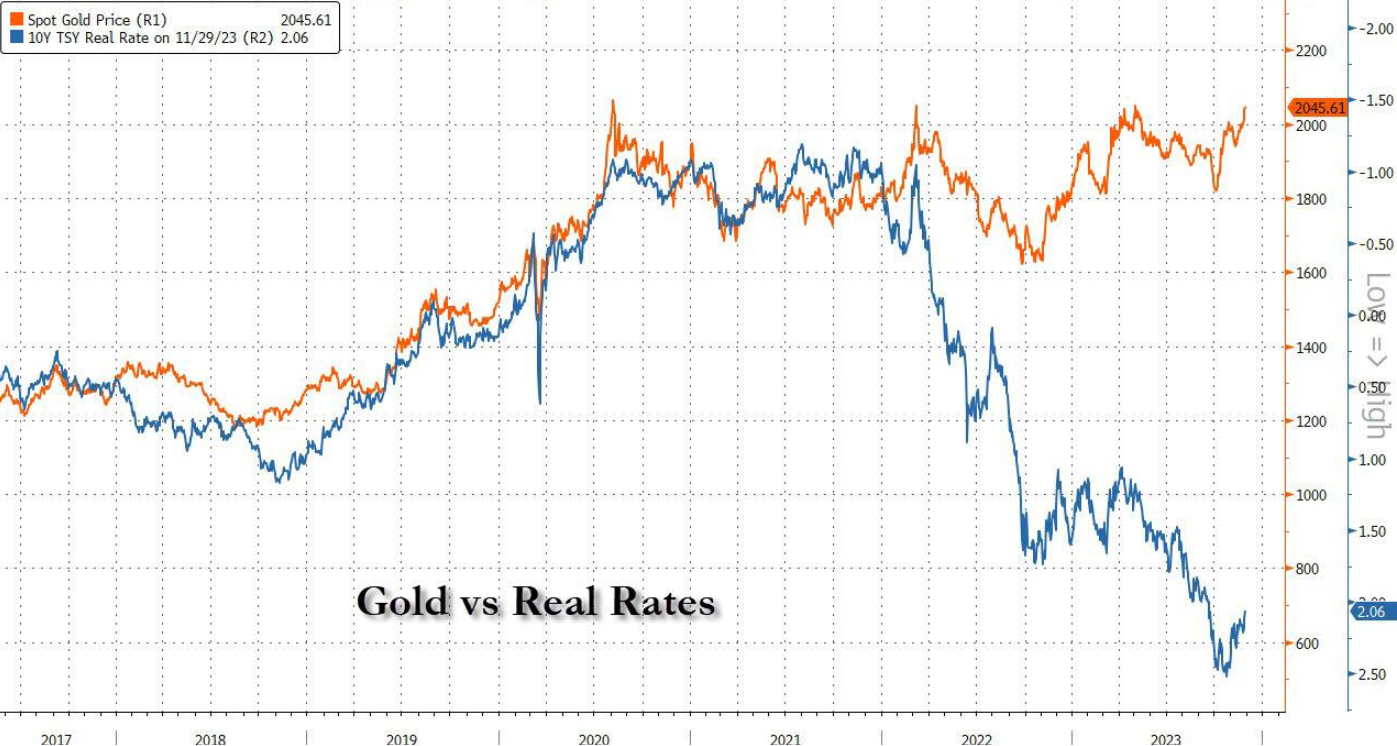
Whereas soaring real rates (the blue axis is inverted in the chart above) suggest gold should be trading around $700/oz, the actual price of the precious metal is at $2045, the highest it has been this year and is just $30 away from a new all time high! So what’s behind the move? Again it is China!
We assume it will not surprise anyone that, similar to last year when the surge in gold was driven by China, this time gold’s ascent to near all time highs is also thanks to China.
It’s not just China’s demand for investment gold that is behind the surging price: central bank gold buying (and here the question is just what is the true amount of gold purchased by the PBOC) has been a just as powerful driver. According to official data, the People’s Bank of China increased its reserves by 181 tons, and it has added 232 tons since it resumed official purchases in November 2022. As of the end of September, China officially held 2,192 tons of gold, making up 4% of its total reserves.
However, according to unofficial tallies – such as that kept by Gainesville Coins analyst Jan Nieuwenhuijs – total gold purchases by the Chinese central bank (reported and unreported) are significantly bigger than what has been officially disclosed, and in Q3 alone, China purchased 179 tonnes of physical. Year-to-date the PBoC bought 593 tonnes, which is 80% more than what it bought in the first three quarters last year. As such, China’s total estimated gold holdings are 5,220 tonnes, more than twice what’s officially disclosed at 2,192 tonnes.
If Nieuwenhuijs is correct, and China’s actual gold holdings are not 2,192 tonnes but rather 5,220, that would mean that instead of having the 6th largest gold hoard in the world, China has now easily surpassed Germany’s 3,353 tonnes, and is rapidly catching up to the US with its 8,133. Throw in Russia and its 2,333 tonnes, and suddenly the two friendly superpowers have over 7,500 tonnes of gold, just shy of the US… assuming, of course, that all of that physical US gold is still in Fort Knox, something which many gold analysts doubt.
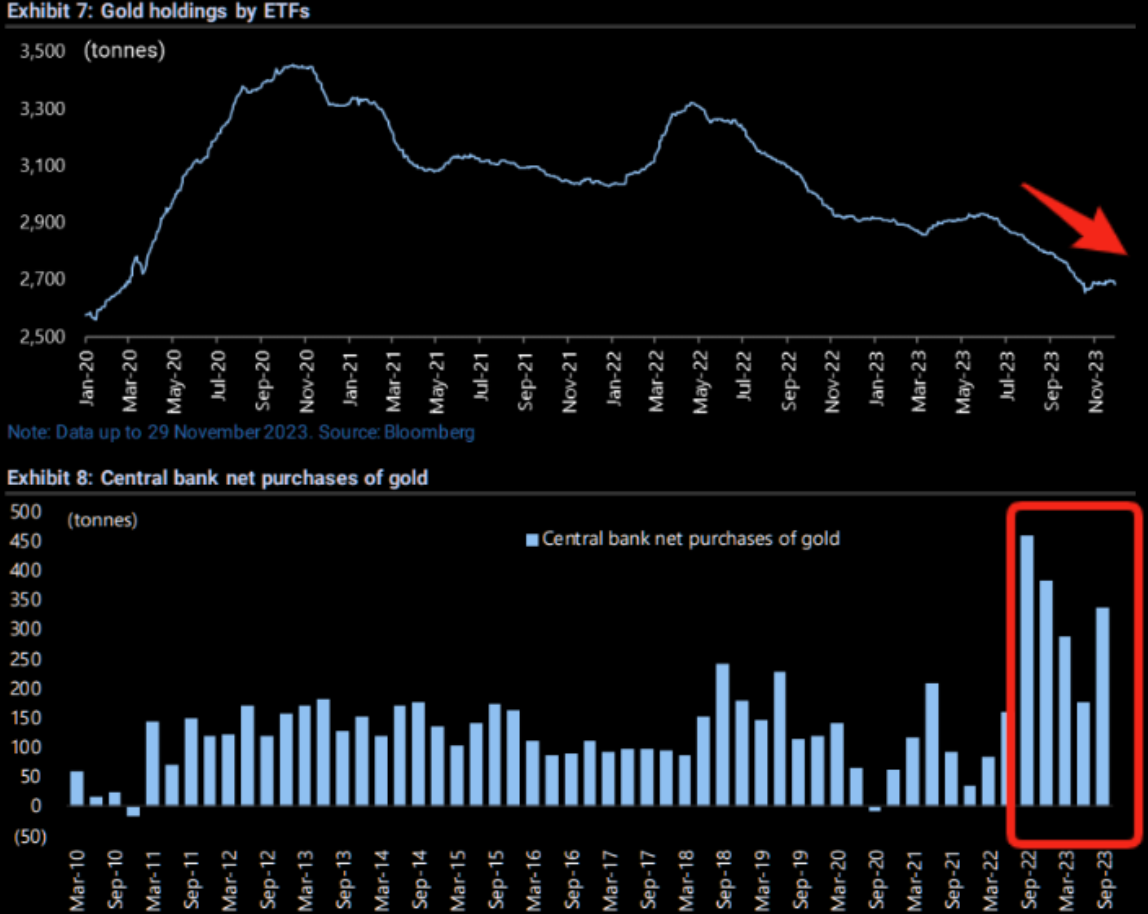
CHART BELOW
Note the 50 DMA is crossing the 200 DMA. The 100 DMA is also potentially about to cross the 200 DMA. This an extremely Bullish occurrence (if it is completed).
YOUR DESKTOP / TABLET / PHONE ANNOTATED CHART
Macro Analytics Chart Above: SUBSCRIBER LINK
Fast-forwarding to today, analysts are finding that the price action in gold is virtually a carbon copy of what happened last year.
As shown in the chart to the right, the price of gold has also stormed higher during a period of time when we saw an almost identical move back in 2022.
This has resulted in the divergence between gold and real rates hitting unprecedented levels (chart below), which we mentioned Thursday.
Whereas soaring real rates (the blue axis is inverted in the chart above) suggest gold should be trading around $700/oz, the actual price of the precious metal is at $2045, the highest it has been this year and is just $30 away from a new all time high! So what’s behind the move? Again it is China!
We assume it will not surprise anyone that, similar to last year when the surge in gold was driven by China, this time gold’s ascent to near all time highs is also thanks to China.
It’s not just China’s demand for investment gold that is behind the surging price: central bank gold buying (and here the question is just what is the true amount of gold purchased by the PBOC) has been a just as powerful driver. According to official data, the People’s Bank of China increased its reserves by 181 tons, and it has added 232 tons since it resumed official purchases in November 2022. As of the end of September, China officially held 2,192 tons of gold, making up 4% of its total reserves.
However, according to unofficial tallies – such as that kept by Gainesville Coins analyst Jan Nieuwenhuijs – total gold purchases by the Chinese central bank (reported and unreported) are significantly bigger than what has been officially disclosed, and in Q3 alone, China purchased 179 tonnes of physical. Year-to-date the PBoC bought 593 tonnes, which is 80% more than what it bought in the first three quarters last year. As such, China’s total estimated gold holdings are 5,220 tonnes, more than twice what’s officially disclosed at 2,192 tonnes.
If Nieuwenhuijs is correct, and China’s actual gold holdings are not 2,192 tonnes but rather 5,220, that would mean that instead of having the 6th largest gold hoard in the world, China has now easily surpassed Germany’s 3,353 tonnes, and is rapidly catching up to the US with its 8,133. Throw in Russia and its 2,333 tonnes, and suddenly the two friendly superpowers have over 7,500 tonnes of gold, just shy of the US… assuming, of course, that all of that physical US gold is still in Fort Knox, something which many gold analysts doubt.
CHART BELOW
Note the 50 DMA is crossing the 200 DMA. The 100 DMA is also potentially about to cross the 200 DMA. This an extremely Bullish occurrence (if it is completed).
YOUR DESKTOP / TABLET / PHONE ANNOTATED CHART
Macro Analytics Chart Above: SUBSCRIBER LINK
MARKETS BEGIN PRICING IN FED RATE CUTS
CONSENSUS MISTAKENLY TRADING A “SOFT LANDING”
Click All Charts to Enlarge
1 – SITUATIONAL ANALYSIS
Federal Reserve Chairman Jerome Powell’s fireside chat on Friday had the unintended consequences of solidifying the markets view of a soft landing lying ahead with rate cuts to likely begin in March 2024. Traders adjusted their positions accordingly with yields falling, gold breaking out to the upside and risk assets bought without increasing hedge positions significantly. The illustration below is the best way of describing what MATASII’s understanding of what the trading consensus presently is.
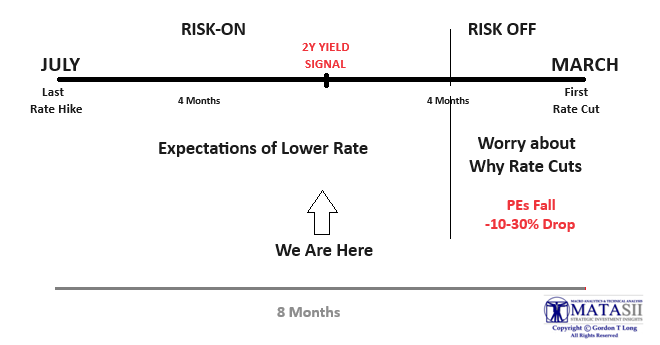
NOTE: This is not necessarily MATASII’s view of what will unfold.
MAJOR ‘TELL’ MOVE IN THE 2Y NOTE
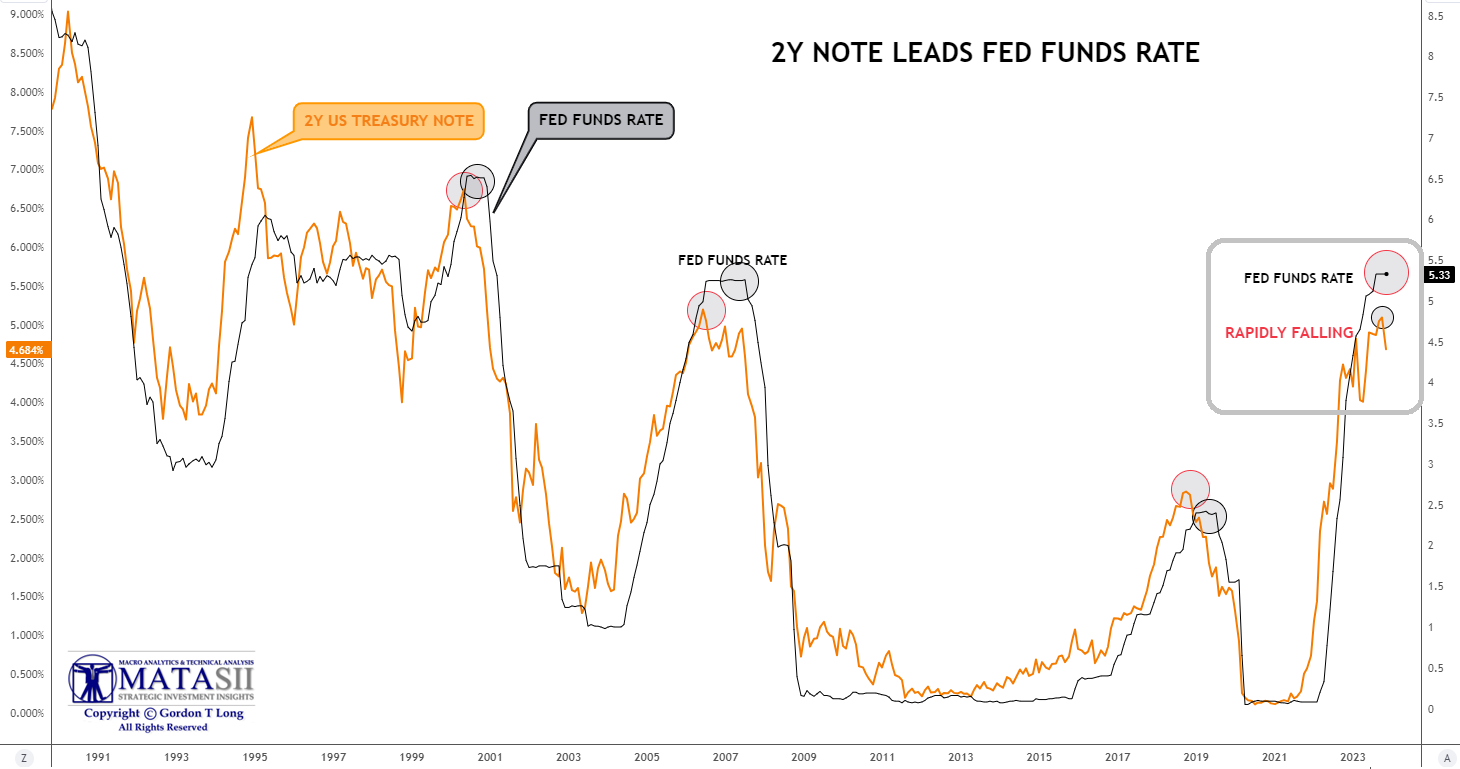 The Fed has historically always FOLLOWED the 2Y Treasury (chart right).
-
- We have a large gap between the Fed Funds Rate and the 2Y UST Yield.
- An extremely abrupt and rapid fall in 2Y yields.
With supporting trading reactions in the following:
-
- A surge in Gold, Silver and Bitcoin
- Dollar Weakness
- Falling Real Rates
- Falling Treasury Yields on longer duration
- Inverted Yield Curve Flattening
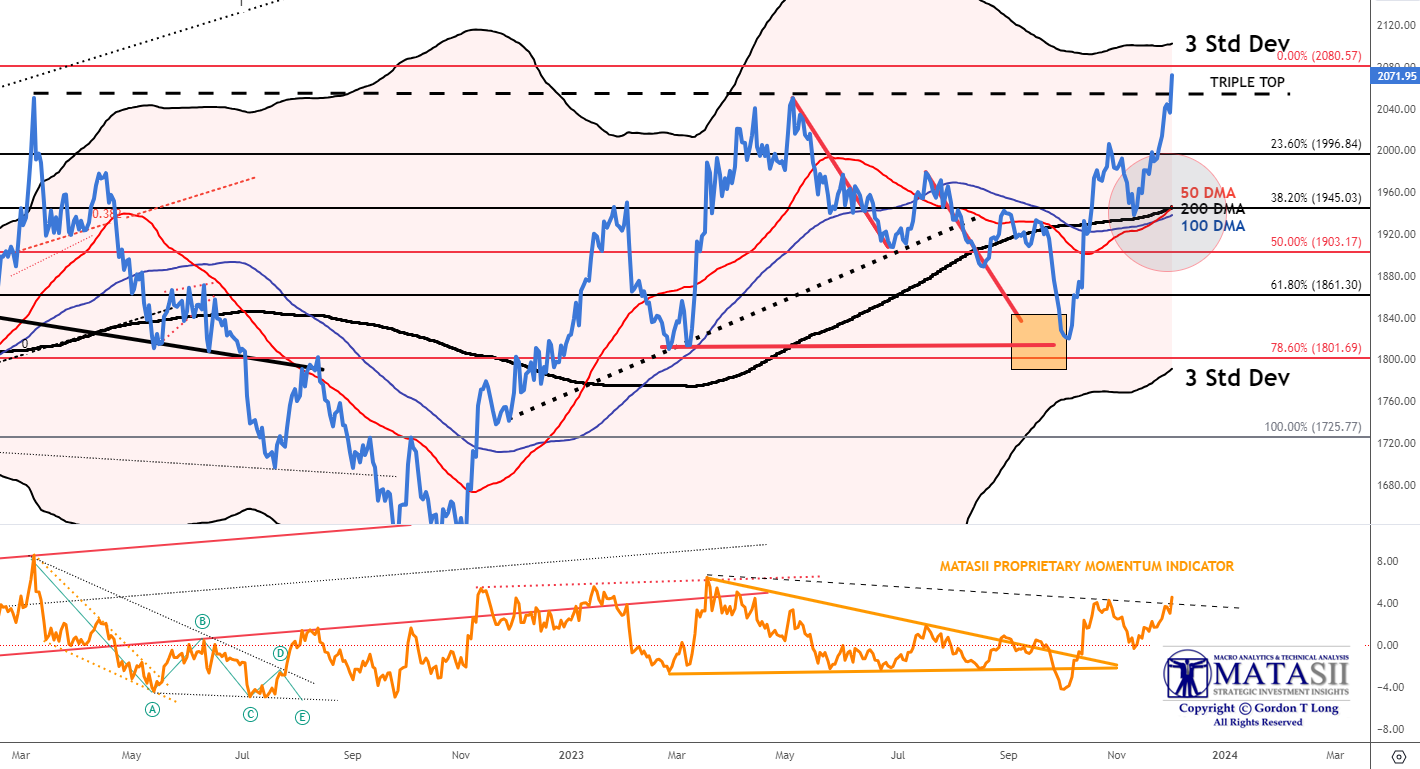
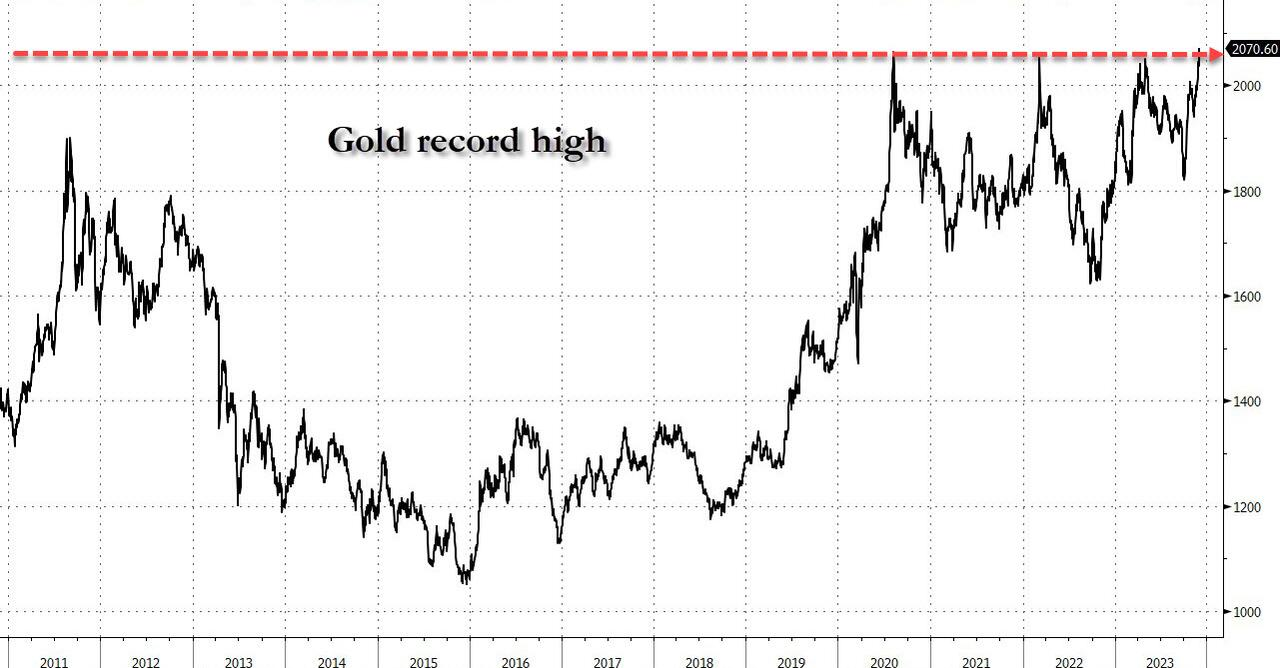 CHART RIGHT: Gold at record high with potential major breakout.
CHART BELOW: The chart below shows that the CFD’s for Gold actually broke the triple top on Friday, though Gold itself only touched the triple top.
CFD: Contract For Differences
A contract for differences (CFD) is a financial contract that pays the differences in the settlement price between the open and closing trades. CFDs essentially allow investors to trade the direction of securities over the very short-term and are especially popular in FX and commodities products.
YOUR DESKTOP / TABLET / PHONE ANNOTATED CHART
Macro Analytics Chart Above: SUBSCRIBER LINK
2 – FUNDAMENTAL ANALYSIS
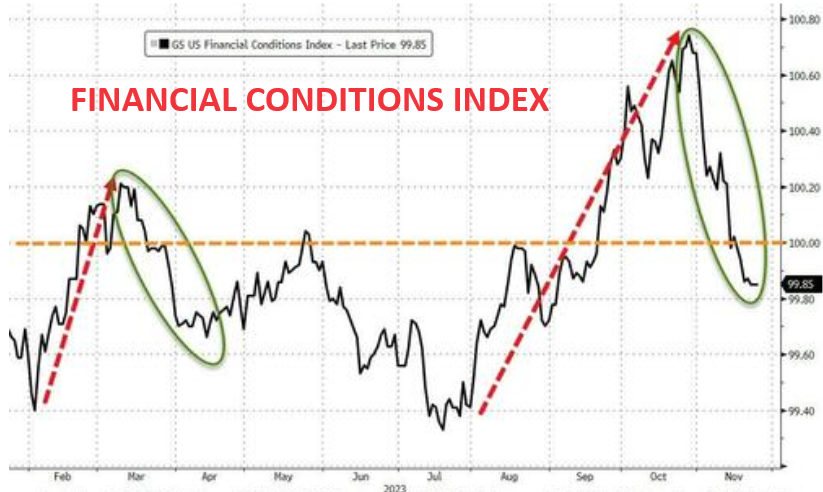 FINANCIAL CONDITIONS INDEX DRAMATICALLY EASING
Financial conditions continue to loosen dramatically (chart right).
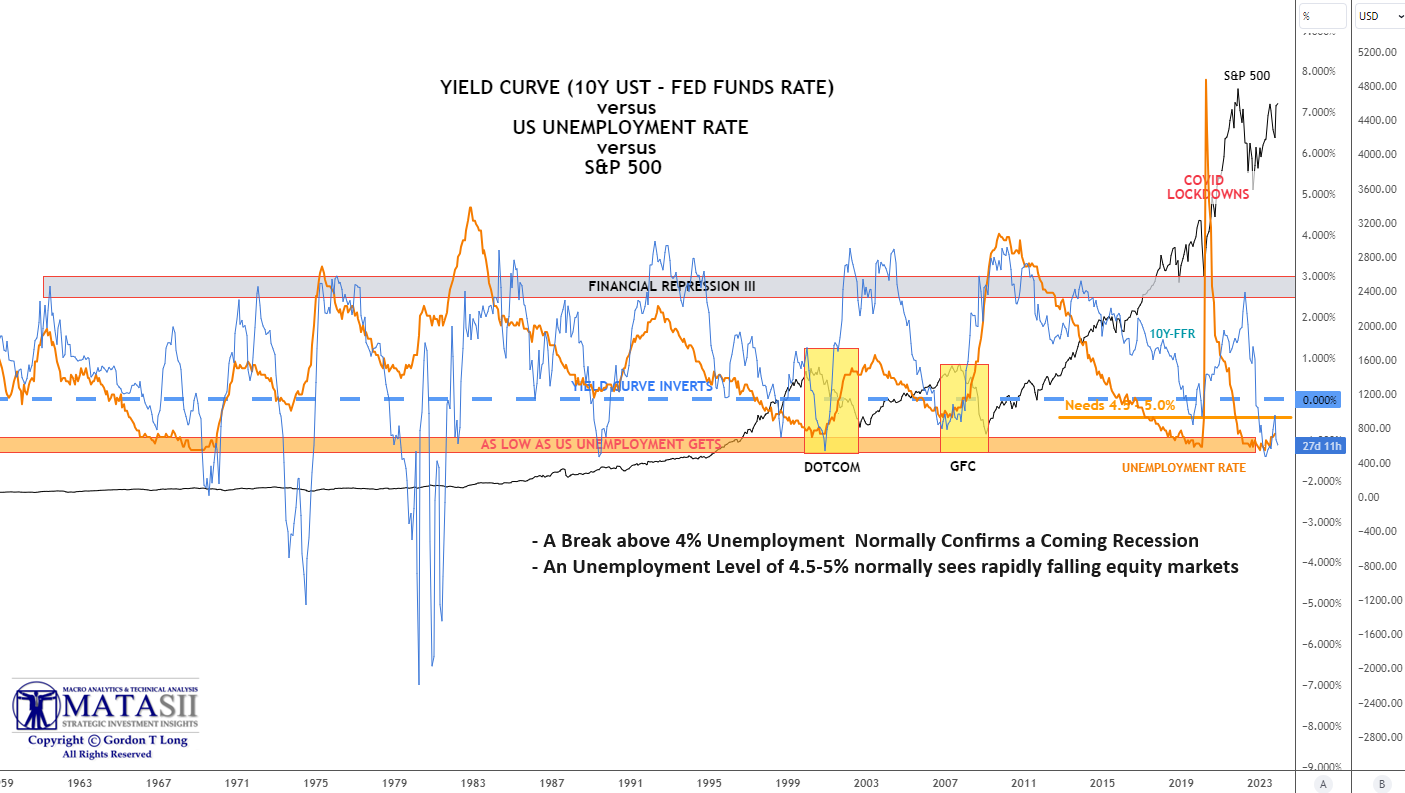
UNEMPLOYMENT LEVELS
NOVEMBER LABOR REPORT
MUST STAY BELOW 4%
FOR RISK ON TO BE MAINTAINED.
The November Labor Report is scheduled to be released Friday AM. The consensus is an unemployment rate of 3.7-3.8%. It was reported as 3.9% in October.
CHART BELOW: MATASII Analysis has identified 4.0% Unemployment level to be a critical initial trigger level for traders.
MATASII ANTICIPATES THE FOLLOWING
-
- A protracted hard landing in 2024- 2025
- Initial falling PE valuations with lagging earnings weakness
- A Consumer Demand lead Recession will be hallmarked by a multi-year period of stagflation.
- Yields will be forced into a trading range from 3.5 – 4.5%, due to elevated risk duration premiums.
- Inflation will resurface in H2 2024 due to Energy, Food & Supply Chain disruptions.
- The dollar can be expected to weaken but not crash.
3 – TECHNICAL ANALYSIS
EQUITY MARKETS
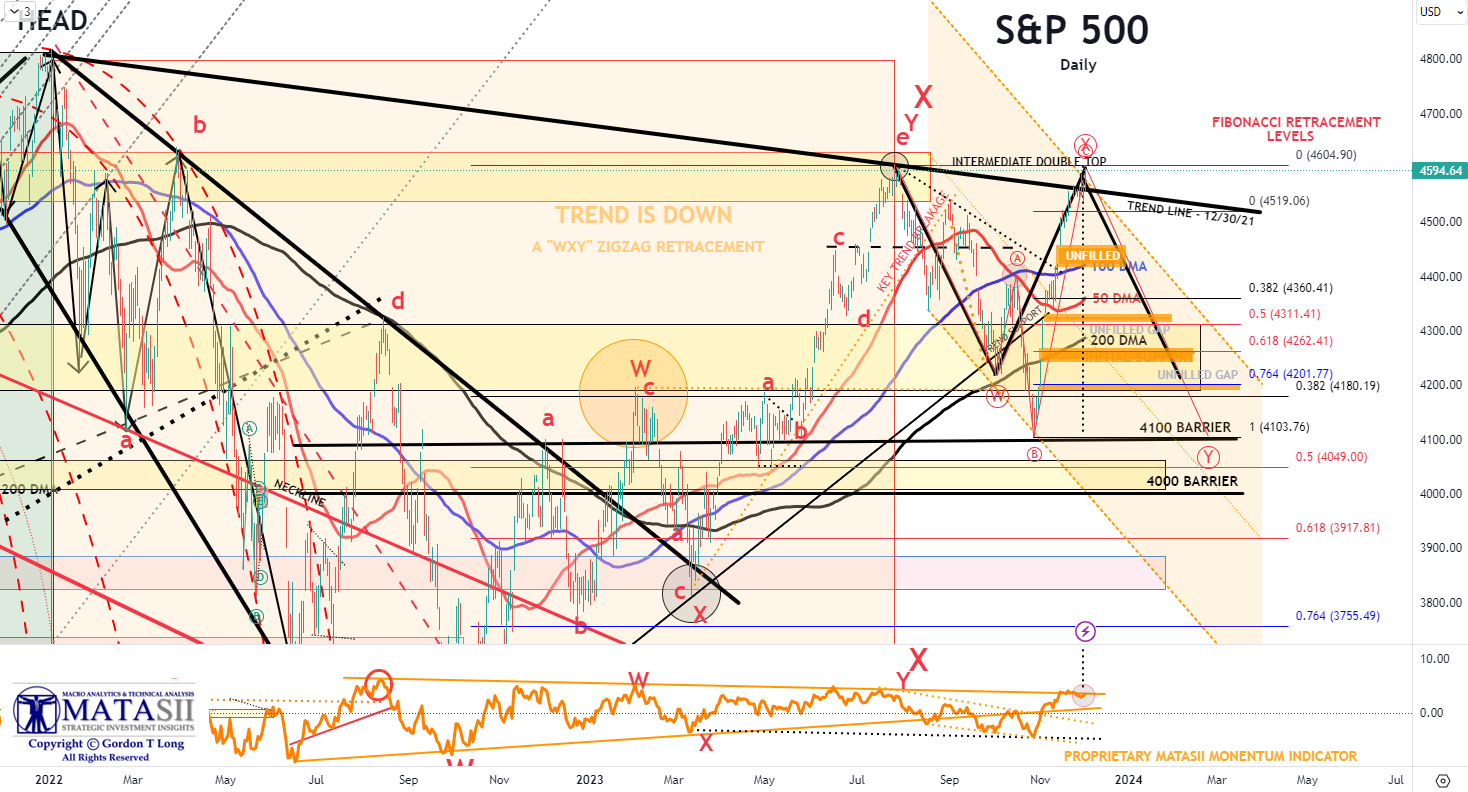
S&P 500
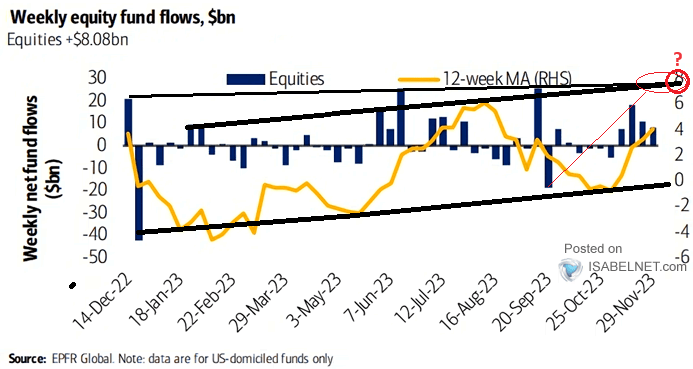 The S&P 500 is testing an important Double Top. The Equity Fund Inflows (chart right) plus seasonals, a weakening dollar and falling yields are suggesting there may be more to run?
Double Tops can sometime take a little time to break through. However, they often hold and signal a major reversal. What will it do?
Market activity and sentiment suggests it will be broken, while underlying economics suggest it may have been just a particularly aggressive counter rally in an ongoing Bear Market. Last week the S&P 500 broke through its upper trend line (shown in black below) which was a triple top. To break both without some consolidation is unusual. The market will likely want to see the November Labor Report on Friday before pushing too much further forward. Additional lowering of yields is required (see Treasury Market expectations below) for equities to advance significantly.
HISTORIC MONTHS LIKE NOVEMBER ARE TYPICALLY FOLLOWED BY PULLBACKS!
YOUR DESKTOP / TABLET / PHONE ANNOTATED CHART
Macro Analytics Chart Above: SUBSCRIBER LINK
RUSSELL 2000
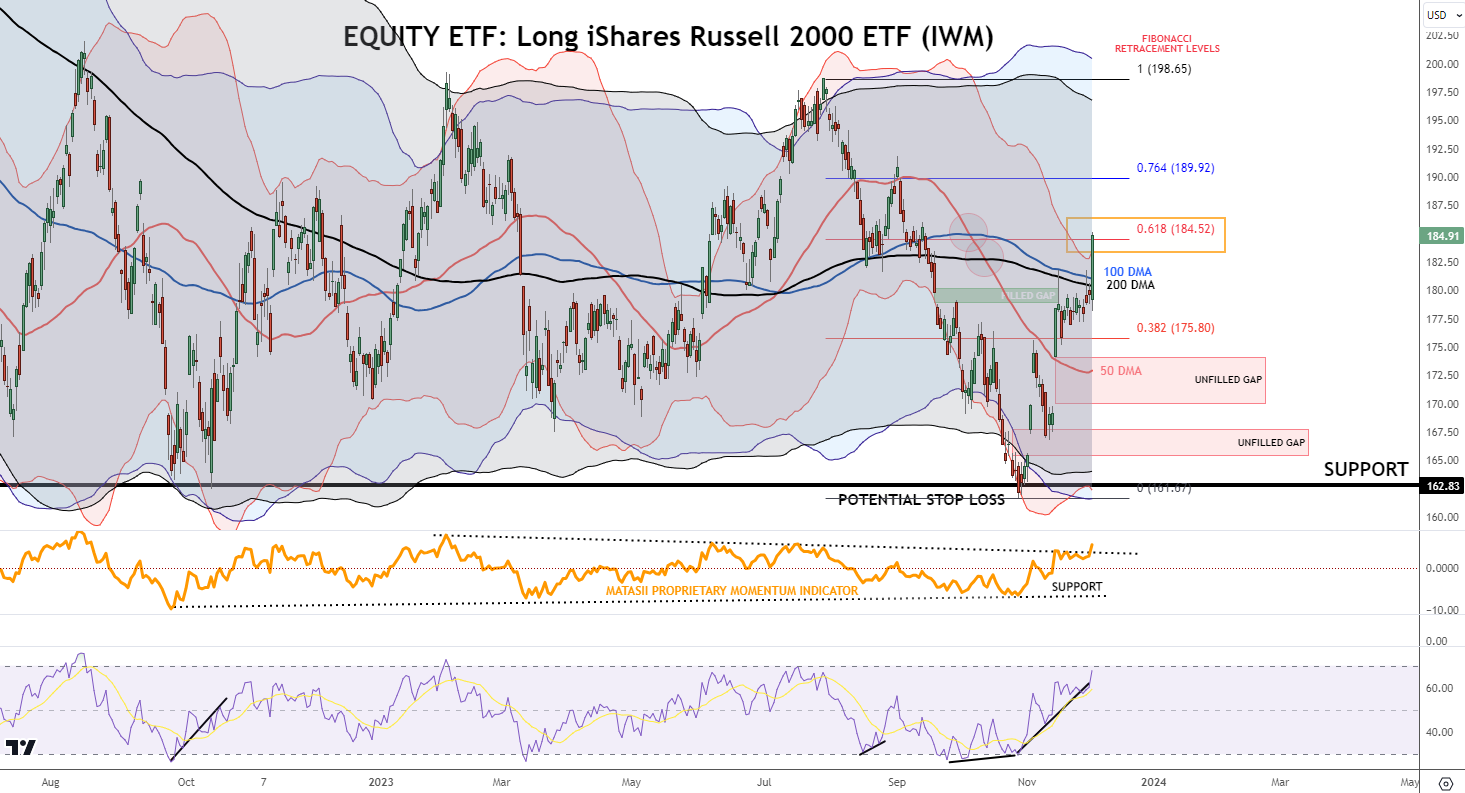
The Russell 2000 was the star market mover on Friday as it spiked through both its 100 and 200 DMAs. The Russell has lagged the Nasdaq and particularly the NDX 100 until Friday. This market may be broadening its breadth, which is a healthy sign. Oscillators suggest a retest of the DMA’s may be in order.
What is important in Friday’s IWM movement is that it exploded higher and then abruptly stopped at the 61.8% retracement level (highlighted by the box). This suggests a strictly technically driven rally. These sorts of rallies normally must retrace the gains to “lock in” support before going further. They are about testing the market’s willingness to place more money on the table and pull in new buyers with FOMO?
YOUR DESKTOP / TABLET / PHONE ANNOTATED CHART
Macro Analytics Chart Above: SUBSCRIBER LINK
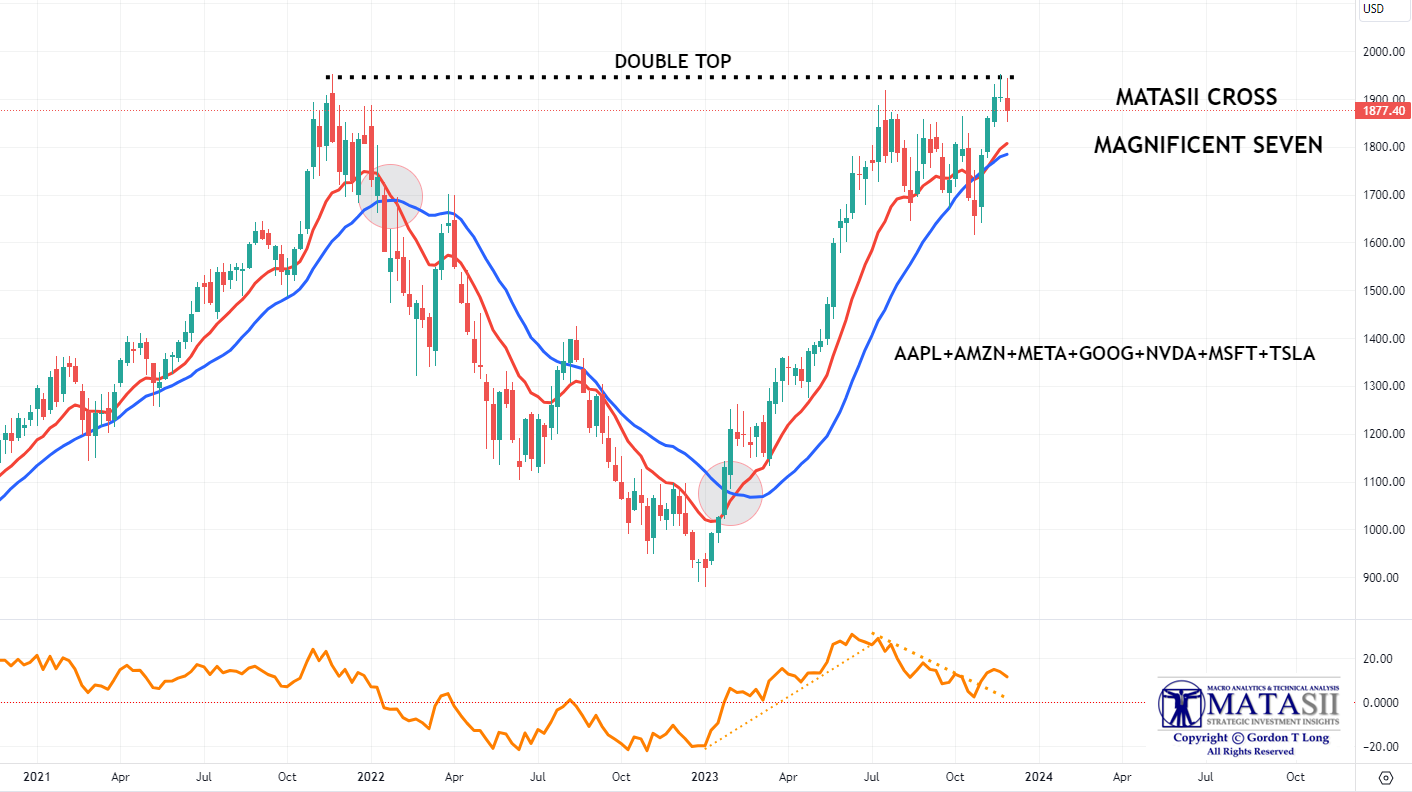
MAGNIFICENT SEVEN
The Magnificent Seven have been losing momentum (see bottom pane) with NVDA’s recent China’s announcement being felt by the group. Like the S&P 500 the group also touched its Double Top, but was unsuccessful in penetrating it.
It will be very difficult for the market to maintain its current levels with any weakness in this group.
YOUR DESKTOP / TABLET / PHONE ANNOTATED CHART
Macro Analytics Chart Above: SUBSCRIBER LINK
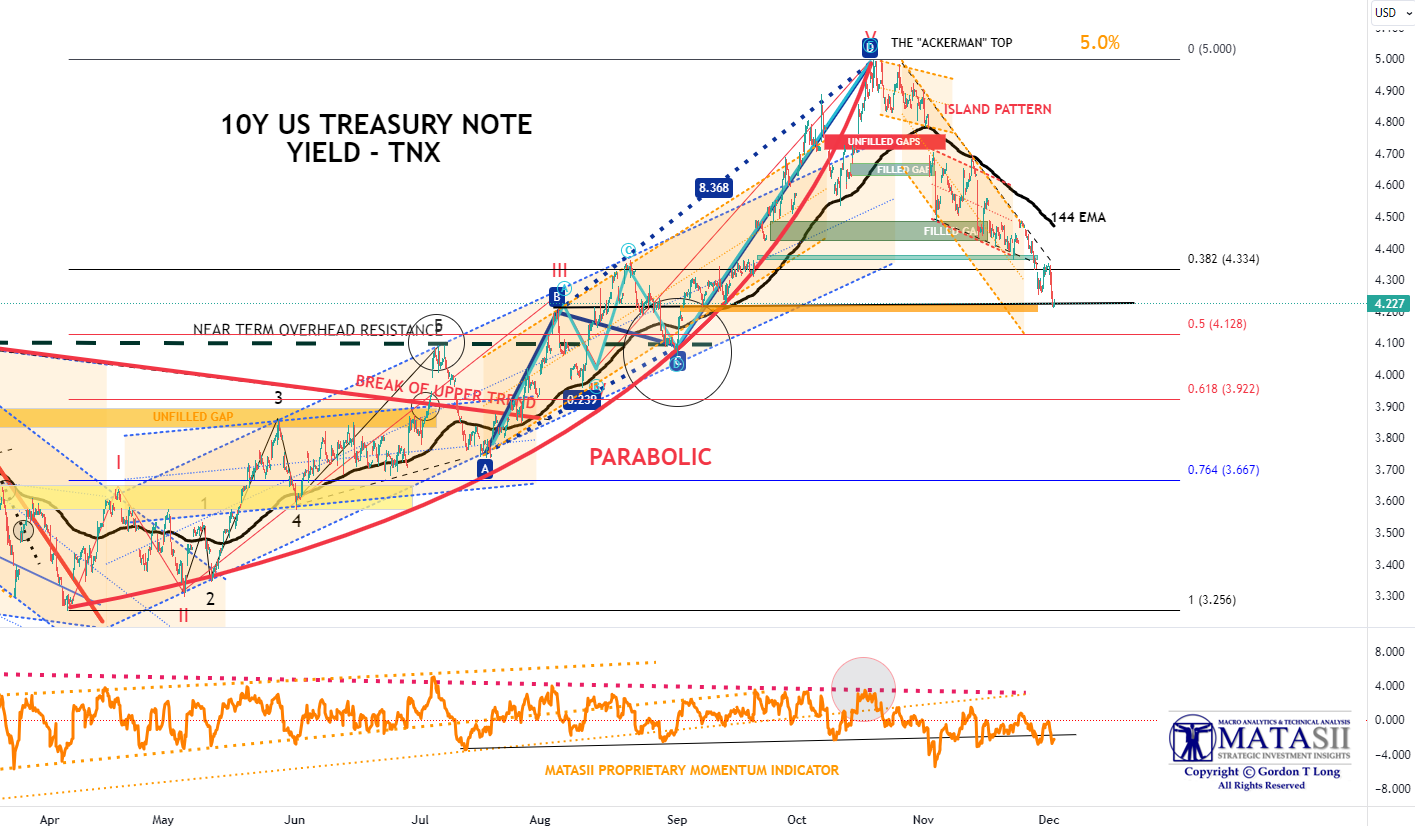
US TREASURY MARKET
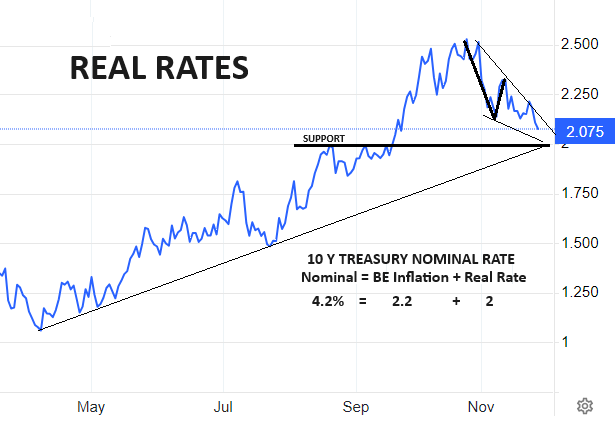 The 10 Year US Note achieved our expected Yield support levels.
With 10Y Breakevens at 2.2% and Real Rates ~2.0%, this supports a 2.0% funding range. It is likely that the nominal value of the 10Y of 4.2% (2.2 + 2.0) should temporarily offer support.
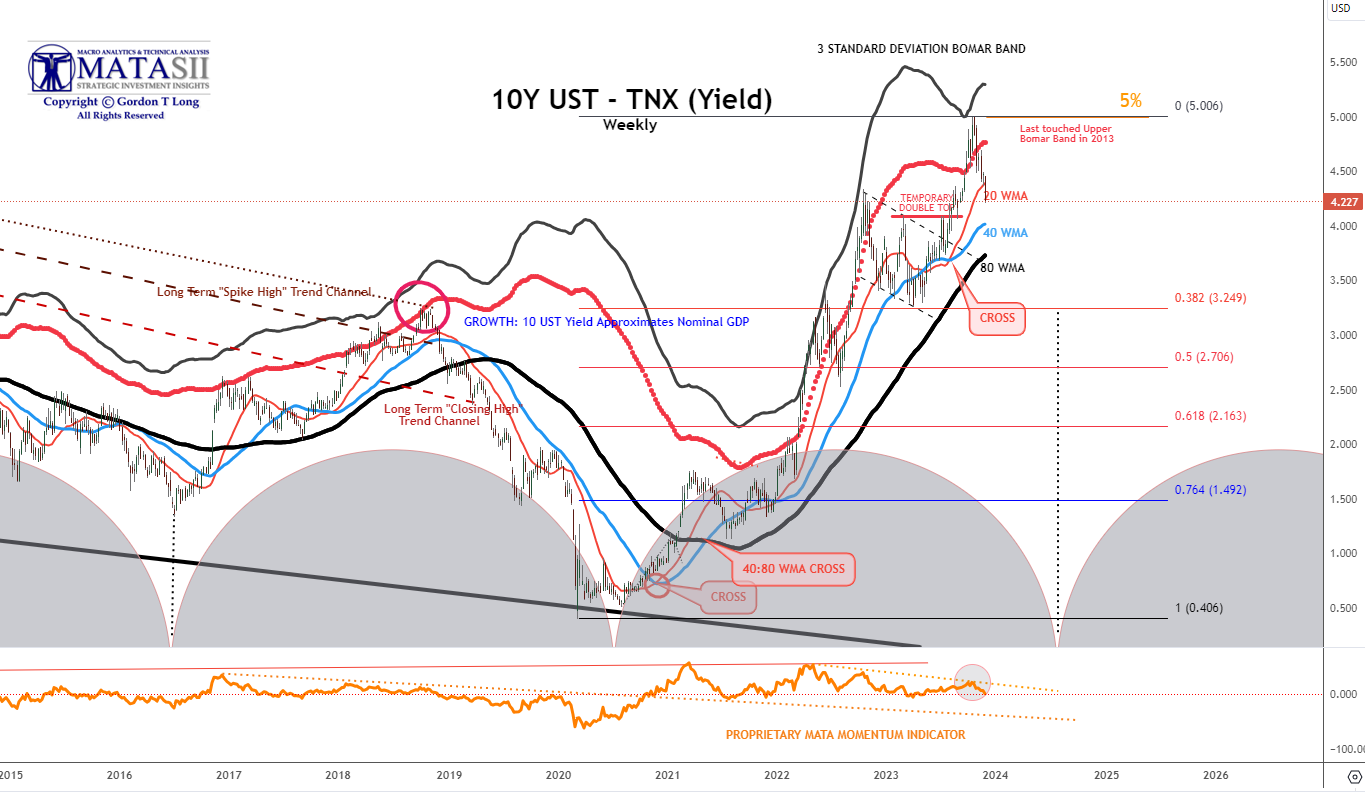
10Y US TREASURY YIELD – TNX – WEEKLY TNX
The 10Y TNX Weekly ended the week at 4.227%, decidedly lower than its 20 WMA. The 40 WMA is only slightly lower at ~4.0%.
YOUR DESKTOP / TABLET / PHONE ANNOTATED CHART
Macro Analytics Chart Above: SUBSCRIBER LINK
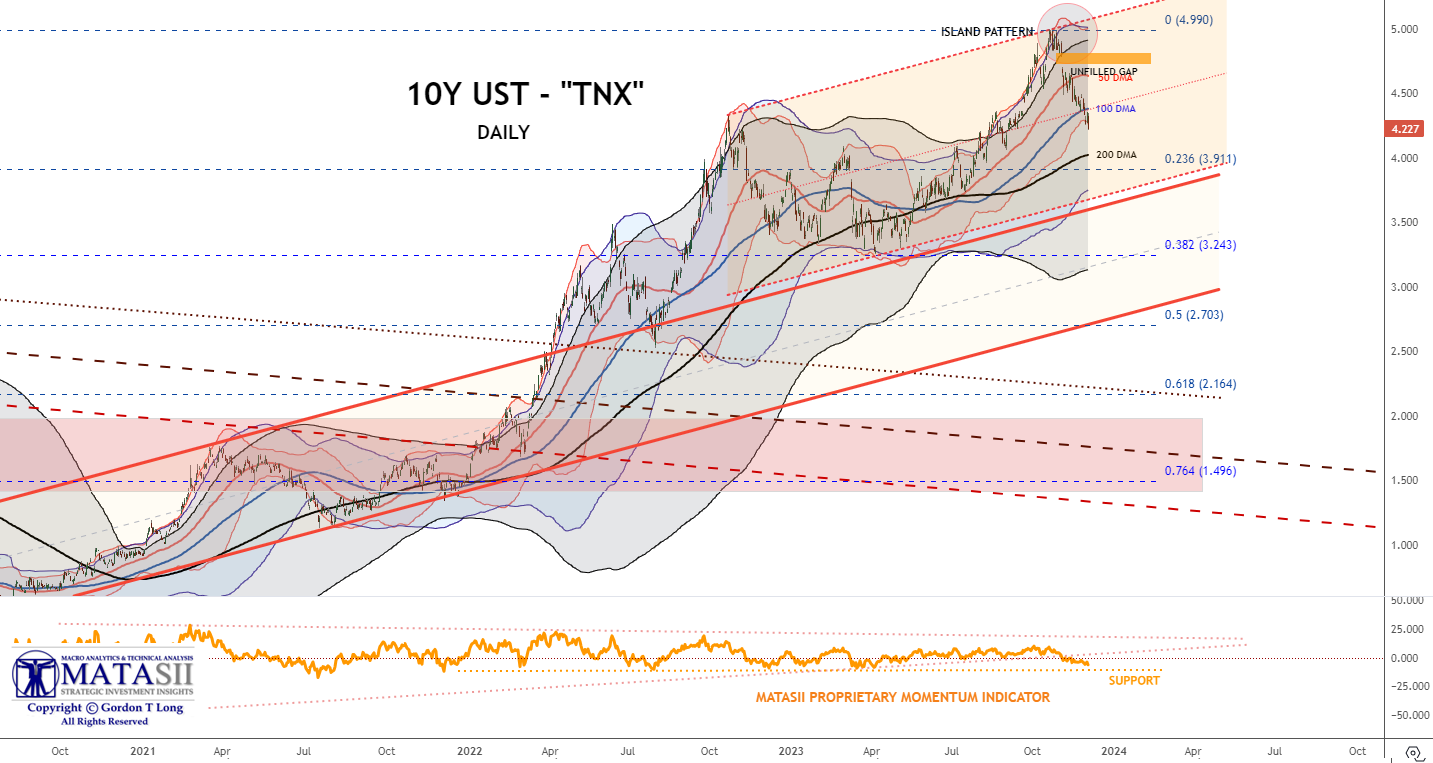
10Y US TREASURY YIELD – TNX – DAILY
The Daily also shows a breakthrough of its initial support at 100 DMA, closing well below. The 200 DMA is only slightly lower at ~4.0%.
YOUR DESKTOP / TABLET / PHONE ANNOTATED CHART
Macro Analytics Chart Above: SUBSCRIBER LINK
10Y US TREASURY YIELD – TNX – HOURLY
The Hourly chart appears to show support close to where the TNX closed on Friday. If inflation weakens further next week with the release of the CPI and PPI, then the 10Y breakeven may allow nominal values to head lower towards the 4.0% range. The Labor Report on Friday also has the potential to impact the direction of yields and the dollar as it will signal weakness or stable employment.
Next week will be an important week for the direction of yields.
YOUR DESKTOP / TABLET / PHONE ANNOTATED CHART
Macro Analytics Chart Above: SUBSCRIBER LINK
FAIR USE NOTICE This site contains copyrighted material the use of which has not always been specifically authorized by the copyright owner. We are making such material available in our efforts to advance understanding of environmental, political, human rights, economic, democracy, scientific, and social justice issues, etc. We believe this constitutes a ‘fair use’ of any such copyrighted material as provided for in section 107 of the US Copyright Law. In accordance with Title 17 U.S.C. Section 107, the material on this site is distributed without profit to those who have expressed a prior interest in receiving the included information for research and educational purposes. If you wish to use copyrighted material from this site for purposes of your own that go beyond ‘fair use’, you must obtain permission from the copyright owner.
NOTICE Information on these pages contains forward-looking statements that involve risks and uncertainties. Markets and instruments profiled on this page are for informational purposes only and should not in any way come across as a recommendation to buy or sell in these assets. You should do your own thorough research before making any investment decisions. MATASII.com does not in any way guarantee that this information is free from mistakes, errors, or material misstatements. It also does not guarantee that this information is of a timely nature. Investing in Open Markets involves a great deal of risk, including the loss of all or a portion of your investment, as well as emotional distress. All risks, losses and costs associated with investing, including total loss of principal, are your responsibility.