Gordon T Long
Global Macro Research | Macro-Technical Analysis
MACRO
US ECONOMICS
A CRACKING CREDIT PUMP IS LOSING LIQUIDITY!
OBSERVATIONS: The “Bidenomic” campaign narrative is gone but the Damage to Retirements is only Beginning!
New research by the Committee to Unleash Prosperity shows why Bidenomics has reduced the real value of the average 401(k) by a quarter in the last two and a half years. Is it any wonder that NBC has reported that Bidenomics has now been abruptly dropped from campaign narrative?
What the research found is Individual retirement accounts (IRAs) and pension plans have experienced shocking losses under the Biden administration. The losses are sufficient to delay many Americans’ retirement plans for years. A combination of 40 year high inflation driven by “War Time” levels of fiscal spending and the resulting fastest interest rate hikes in the same period have resulted in three calendar quarters of a bear market in equities and completely devastated bond market. The two have delivered an unrecoverable one-two punch to people’s retirement accounts.
Across all plans, the net losses are an eye-popping $1 trillion, driving down the average 401(k) plan by almost 13% or about $17,000. In the first two years of the Biden administration, we have witnessed the eroding value of 401(k) plans by $16,200 on average, for a real (inflation-adjusted) loss of around $33,200 or 24.8%. Through the third quarter of this year, pension plans overall have lost $3.3 trillion or 12.1% of real value during the Biden administration.
The result, separate of just pension impacts, has been devastating. Between lost purchasing power from inflation and higher borrowing costs from interest rate hikes, the typical American family has lost the equivalent of $7,300 in annual income under Biden. To make ends meet, a record number of Americans are now working multiple jobs, but that’s still not enough to cover the $11,400 higher cost of living. Families have racked up a record $1.1 trillion in credit card debt while savings have plummeted.
Sadly, a record number of Americans are also using hardship withdrawals to tap their retirement savings, because they can no longer afford necessities like rent and groceries. For Americans who were planning on retiring with $1 million in their IRA, those accounts have lost almost $250,000 in real value. The typical would-be retiree must now work an additional decade to recoup those losses.
Unfortunately, things are unlikely to radically improve for retirement accounts as government expenditures have grown faster than consumer spending for the last five quarters, and that trend is poised to continue. The federal debt just crossed $33.85 trillion and is on track to breach $34 trillion before year’s end. “That’s Bidenomics in action!” as the White House press secretary likes to say.
WHAT YOU NEED TO KNOW!
 US COST OF LIVING IS NOW CRIPPLING AMERICA!
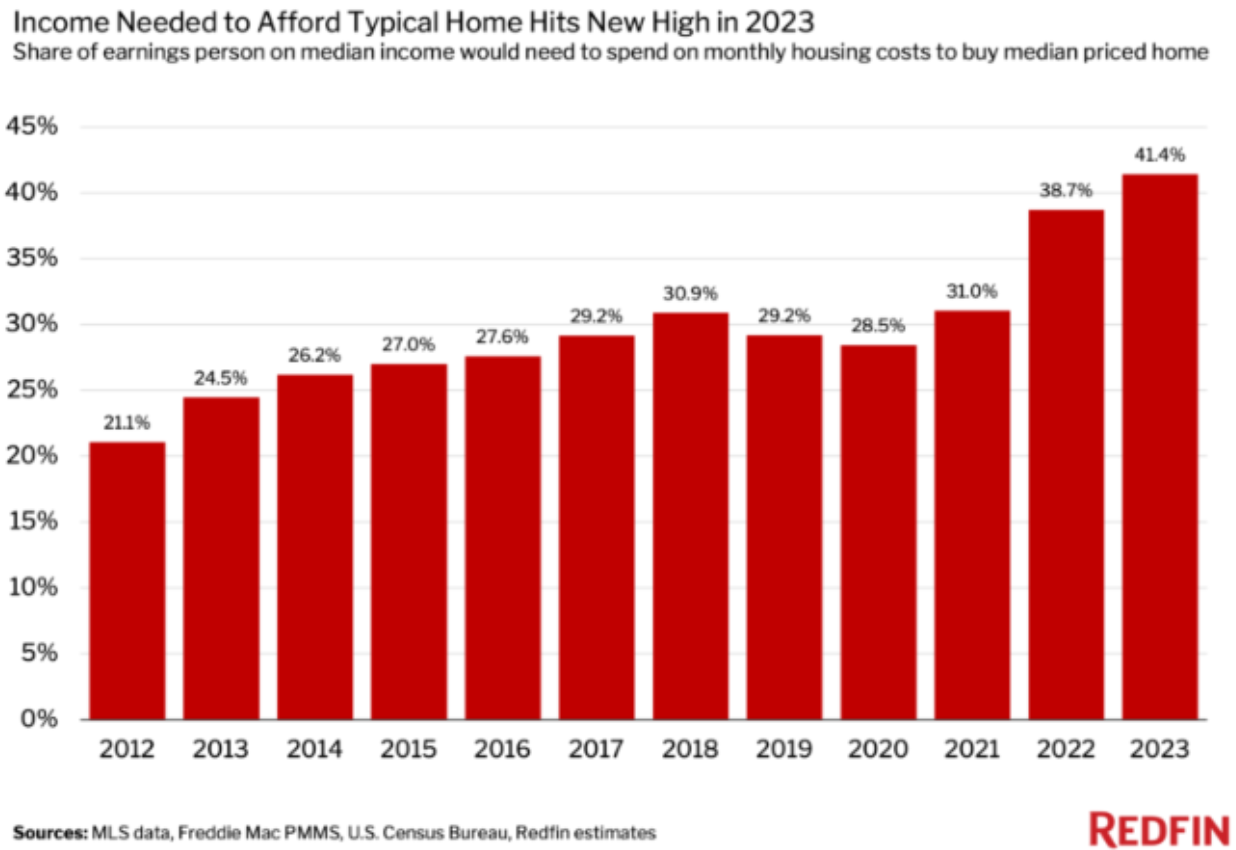
The median American household would need to spend over 41% of their income to afford the median-priced home in 2023, the highest share on record (CHART RIGHT). Meanwhile for those who can’t afford to buy, the average asking rent is now $1,900, with single-family houses averaging $2,018 a month, while a typical apartment costs $1,659. The traditional rule is to spend no more than 30% of your before-tax income on housing costs. That means if you bring in $5,000 per month before taxes, your rent shouldn’t exceed $1,500. It is an understatement to point out that the Cost-of-Living is crippling America!
RESEARCH
A CRACKING CREDIT PUMP IS LOSING LIQUIDITY: A SOFR Alert
-
- Reverse repo plunged recently by $65B in one day, in one of the biggest liquidity injections in RRP history; also fast approaching the $700BN reverse repo liquidity constraint level.
- The problem is the all-important Secured Overnight Financial Rate, (the SOFR Rate is the new LIBOR), has jumped to ~5.39%, the highest on record.
- “The move is consistent with the slow theme of less cash & more collateral in the system” – (i.e., growing reserve scarcity) – and “may have been exacerbated by elevated dealer inventories, bi-lateral borrowing need and limited excess cash to backstop repo. If funding pressure persists, it risks Fed re-assessment of ample banking system reserves & potential early end to QT.”
WHAT THE LABOR REPORT TOLD US: Sometimes Good Data is Bad News
-
- The problem is not with the BLS data and where it shows the labor market is heading, but rather the problem is with our perception of where we actually stand today.
- When you fully appreciate we never recovered from the government lockdowns that began in 2020, you understand we are not seeing the forest from the trees.
- As a consequence, we are looking at LEVELS when we should be looking at TREND.
GLOBAL ECONOMIC REPORTING: What This Week’s Key Global Economic Reports Tell Us?
-
- LABOR REPORT – November Unemployment Rate 3.7%, Job Creation: 199 Hours Worked: 34.4 hr work week.
- CONTINUOUS JOBLESS CLAIMS: The number of Americans filing for unemployment benefits edged higher by 1K to 220K ending Dec 2nd, slightly under market expectations of 222,000, the 2nd-highest reading since September.
- JOLTS REPORT: With consensus expecting only a modest drop from the reported September 9.553 million job openings, what the BLS reported instead was a stunning collapse of 617K job openings to just 8.733 million, the lowest since March 2021.
- ADP: The ADP report saw private sector employment increase by 103k in November, short of the 130k estimate, while the prior was revised down to 106k from 113k.
DEVELOPMENTS TO WATCH
 WORRYING SIGNS IN JAPAN – USDJPY and NIRP Under Pressure
-
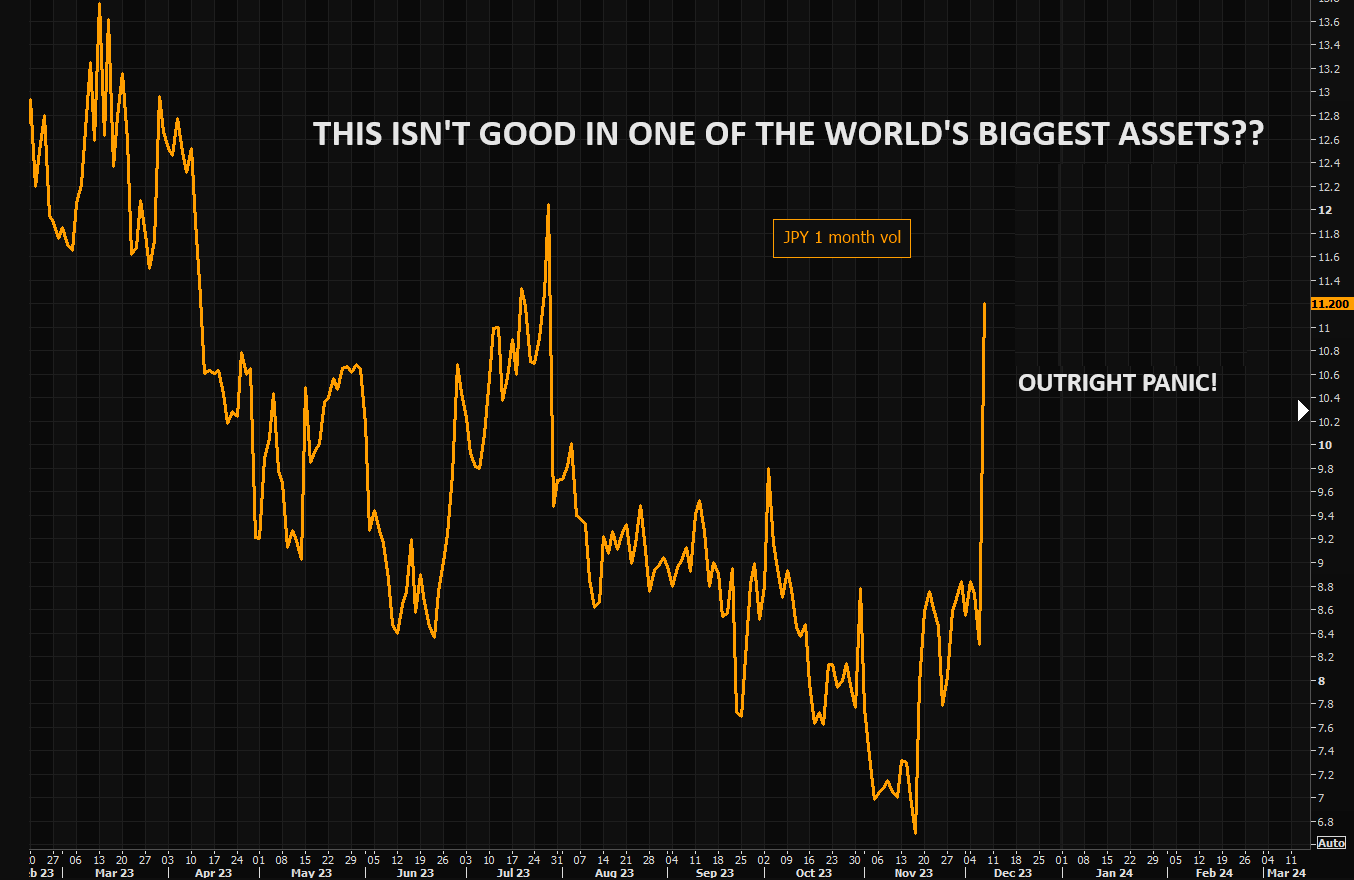
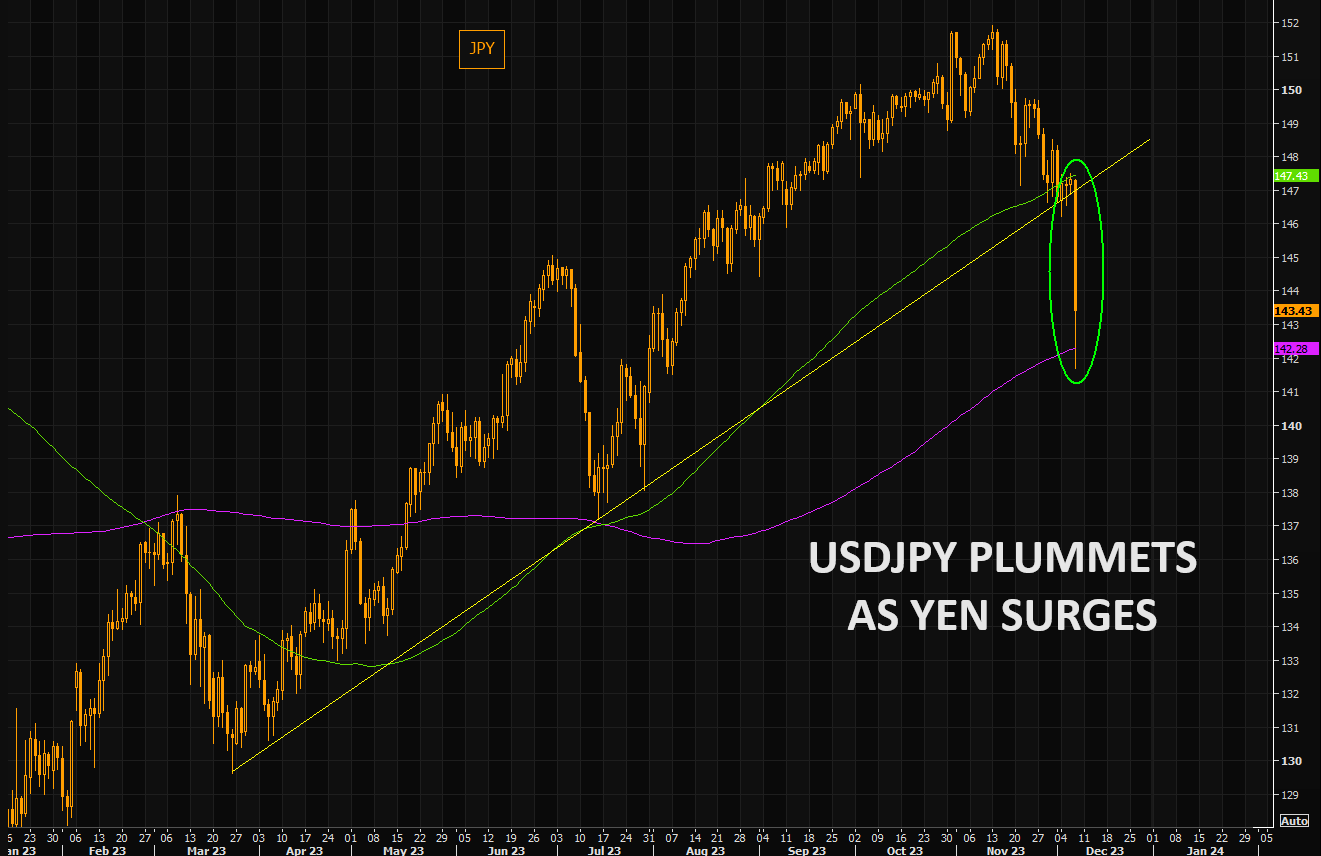
- Beyond spectacular! The USDJPY broke below the 100 day overnight…and traded below the 200 day briefly. You don’t see these things very often, at least not in “serious” assets.
- JPY 1 month volatility up 34%. Absolutely crushing it! (Chart Right)
The longer term issue here is the Destabilization & Disruption in $20T of Global Carry funding.
EASY FINANCIAL CONDITIONS & $350B IN LIQUIDITY – This is What Is Keeping Markets Afloat
-
- According to Goldman Sachs, the G4 central banks + the PBOC injected $350BN in November Liquidity. (CHART)
- This was a major driver in the historic month. In fact, this was the third largest monthly increase this year after January and March 2023.
A CRACKING CREDIT PUMP IS LOSING LIQUIDITY!: A SOFR Alert
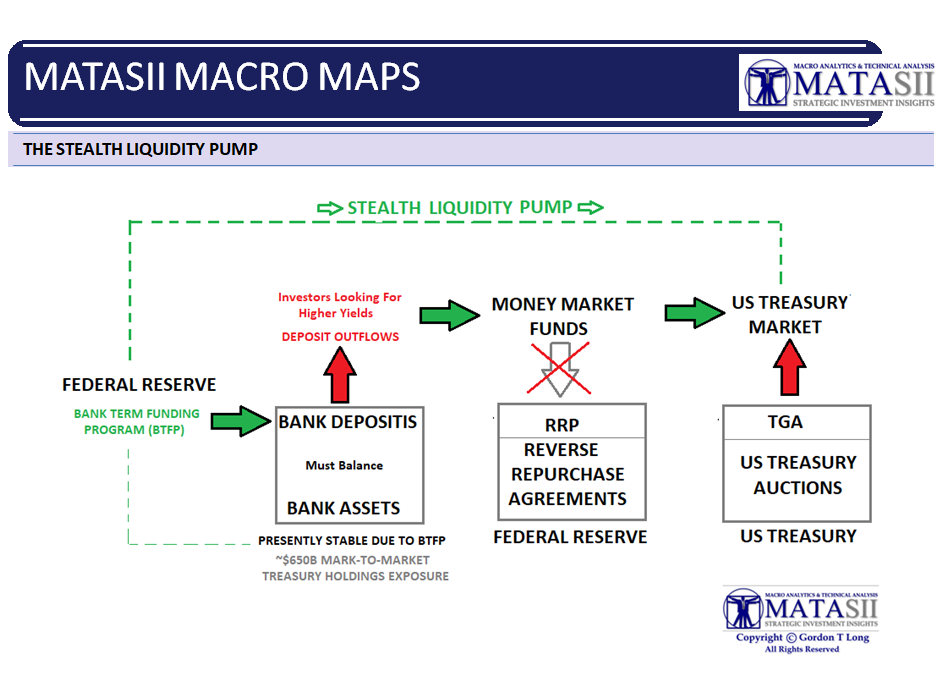
I warned this summer, when I first wrote about how Bidenomics was using the BTFP and Reverse Repos (RRP) to create stealth liquidity (in terms of facilitating the US Treasuries using short term T-Bills to inject a steady stream of cash into the financial system), that this would come to an end by year end. It appears that is what is about to happen.
RRP DROPS FROM ~2.5T to only ~$768B
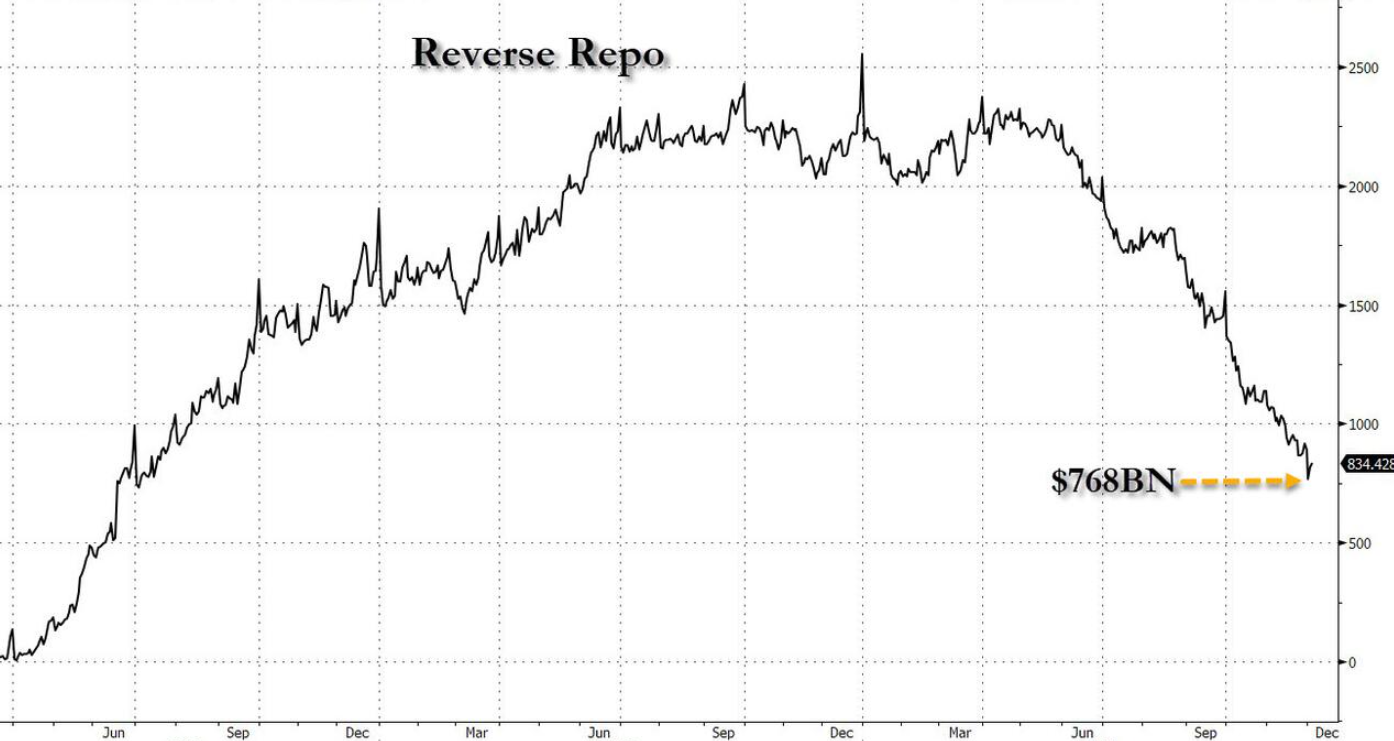 The Fed’s Overnight Reverse Repo tumbled well below $800 billion for the first time since June 2021 amid a growing debate of where and when the Fed’s reserve scarcity constraint will be hit. We warned that liquidity is rapidly approaching the reverse repo constraint level, which could emerge as soon as the RRP facility dropped to somewhere in the area of $700 billion, at which point the market’s all-important credit plumbing would start to crack.
Reverse repo plunged recently by $65B in one day, in one of the biggest liquidity injections in RRP history, also fast approaching the $700BN reverse repo liquidity constraint level.
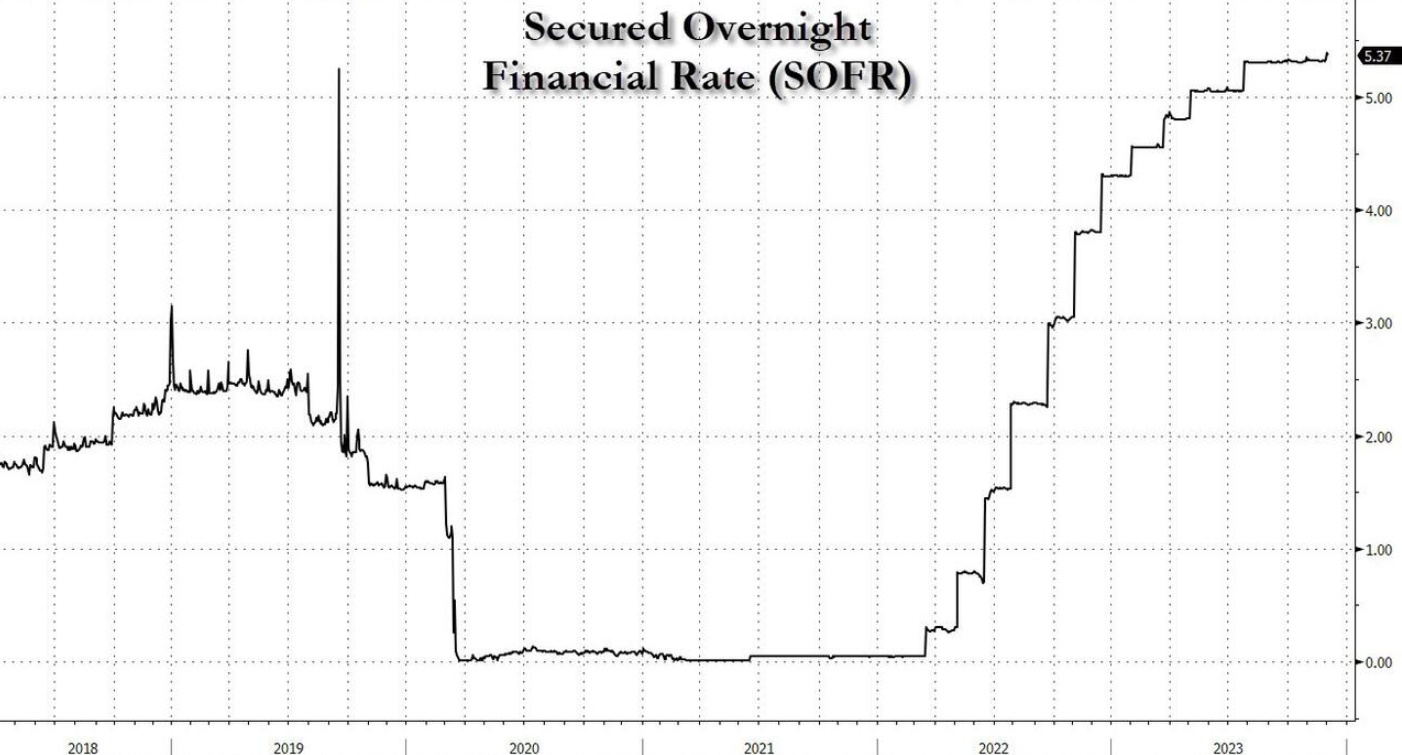 The problem is the all-important Secured Overnight Financial Rate (the SOFR Rate is the new LIBOR) has jumped to ~5.39%, the highest on record (chart right).
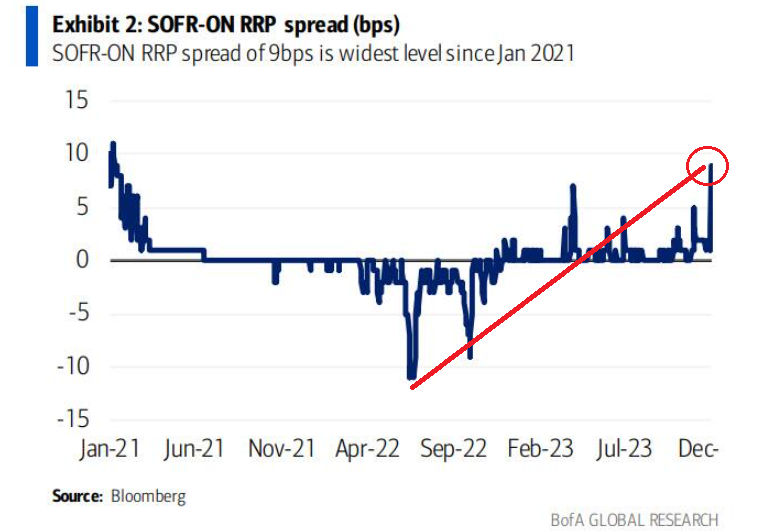
This significantly increases the spread between the SOFR and Overnight RRP rate (chart below).
According to experts:
“the move is consistent with the slow theme of less cash & more collateral in the system” – (i.e., growing reserve scarcity) – and “may have been exacerbated by elevated dealer inventories, bi-lateral borrowing need, and limited excess cash to backstop repo. If funding pressure persists, it risks Fed re-assessment of ample banking system reserves & potential early end to QT.”
THE “SKINNY” ON THE PROBLEM
Extracted and Annotated from FX Hedge
 Turn the clock back to early 2021 and the Fed was desperate to continue creating trillions of dollars for the Treasury to spend but minimize inflation.
Purposely letting the reverse repo facility go wild was their answer. The Fed purchased Treasuries, using money it created digitally. That reduced the supply of Treasuries available and drove their yields to near zero. As the Treasury spent all the money it borrowed, that money worked its way into the banking system, where it would multiply. When the Fed creates a dollar for the Treasury to spend, it’s only about 10% or so of the total amount of money created, because fractional reserve banking multiplies the initial dollar into a total of about 10. So, if you can short circuit this part of the process, you neutralize 90% of the inflation. That’s what happens with reverse repos. The Fed “borrows” money and sits on it, preventing it from being lent out and multiplying. It’s the same as when the Fed pays interest on reserves, paying banks to park their money in its vaults and not lend it out.
Just how extensive was this practice? Earlier this year, the Fed was paying over $800 million in daily interest to “sterilize” $6 trillion through its reverse repo facility and interest on reserve policy combined. Let that money out to play, and it’ll quickly turn into about $60 trillion – then you’ll see some REAL inflation. Now we can understand reverse repos as not just a cause but a symptom. The facility’s usage ramps up when there is too much liquidity and interest rates are going to break through the Fed’s floor.
So, why have reverse repos come down so much from their peak earlier in the year of $2.8 trillion to < $800? Because supply and demand are coming back into balance.
- The Fed selling securities is reducing the supply of loanable funds.
- The Treasury’s borrowing spree is jacking up the demand side.
- The excess supply is coming down.
This means the Fed’s arbitrary interest rates are becoming more realistic for today’s market conditions. (We say more realistic but maybe we should say less unrealistic.) As the Treasury creates more demand, the Fed doesn’t need to artificially create it, so reverse repos are falling. People are just lending to the Treasury instead of lending to the Fed. This is exactly what MATASII identified this summer
Now, what happens if the Treasury keeps borrowing while the Fed keeps selling securities? Demand would eventually exceed supply as reverse repos go to zero, and we’d be out of equilibrium. Then the whole financial world implodes. At least that’s what newly self-appointed experts think. In reality, all that would happen is financial institutions would start using the repo facility, as opposed to the reverse repo facility. Now, instead of loaning money to the Fed, they’d be borrowing it.
Why would a bank borrow from the Fed in this instance? Because they can get a higher interest rate somewhere else, like a Treasury auction. Remember that this is a large merry-go-round of debt. People are increasingly loaning to the Treasury instead of to the Fed today. When reverse repos run dry and we tap repos, people will be borrowing from the Fed to loan to the Treasury. As the Treasury continues sucking all the air out of the room with its multi-trillion-dollar borrowing spree, it has to crowd out more private investment by offering higher and higher yields. That’ll force interest rates higher – too high for the Fed, which has its own interest rate target range it’s trying to maintain.
To prevent Treasury yields from getting too high, the Fed will finance the deficit, using third parties as middlemen who earn interest based on the arbitrage between Treasury yields and the rate on repos. The Standing Repo Facility (SRF) was established in July 2021 to keep a watchful eye on the market and to make sure rates don’t go too high above the Fed’s target, like they did in late 2019. When overnight rates exploded above the Fed’s target, they quickly sold securities to increase the supply of loanable funds and bring rates back down to within their target range. You can expect them to step in again when reverse repos run dry, and the Treasury demands more money. While this isn’t Armageddon, it isn’t good either. By keeping rates artificially low and using repos to conduct stealth quantitative easing, the Fed is going to put us right back on the inflation roller coaster.
We also forget that before the March 2021 surge, reverse repo usage between $200-300 billion was the norm, not $2 trillion. And before the introduction of ZIRP (zero interest rate policy), it was $20-40 billion. The idea that financial markets will collapse if reverse repos return to normal levels is silly. What’s much more dangerous—and will happen at the same time—is the Treasury sucking all the air out of the room. By drawing so much investment out of the private sector, capital will only get scarcer, and the least profitable companies will be the first that are unable to maintain financing, and therefore operations. That’s when countless “zombie” companies will go under, and layoffs will become much more common.
WHAT THE LABOR REPORT TOLD US: Sometimes Good Data is Bad News
 KEY OBSERVATIONS:
-
- The problem is not with the BLS data and where it shows the labor market is heading, but rather the problem is with our perception of where we actually stand today.
- When you fully appreciate we never recovered from the government lockdowns that began in 2020, you understand we are not seeing the forest from the trees.
- As a consequence we are looking at LEVELS when we should be looking at TREND.
Let me explain:
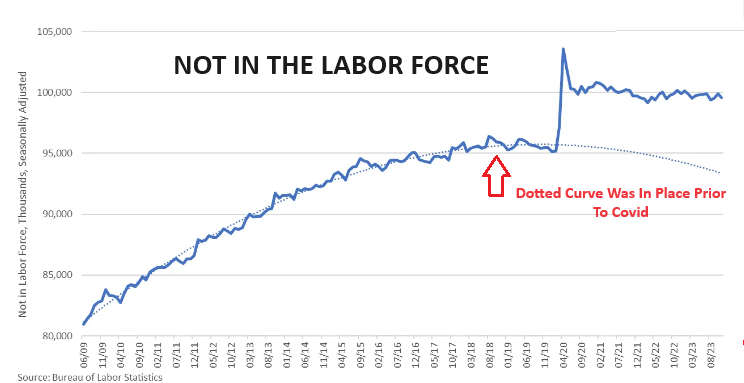
After the Covid-19 lockdowns ended, millions of people never returned to the labor force. As you may recall, before that, the trend of those categorized as “not in the labor force” had been trending down. Today, the gap is millions of people. (Chart Above).
We see similar sized gaps with:
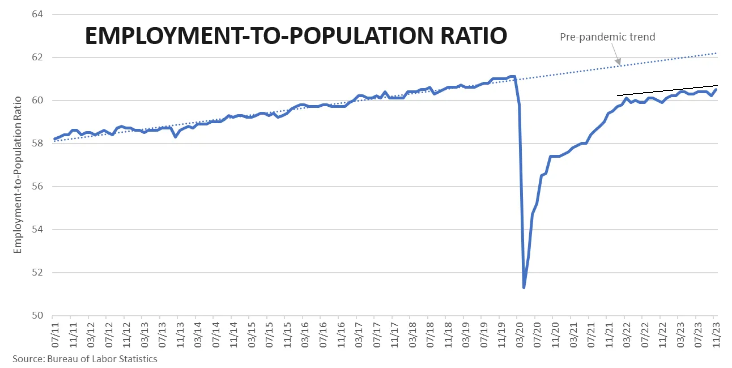
i) The Employment-to-Population Ratio:
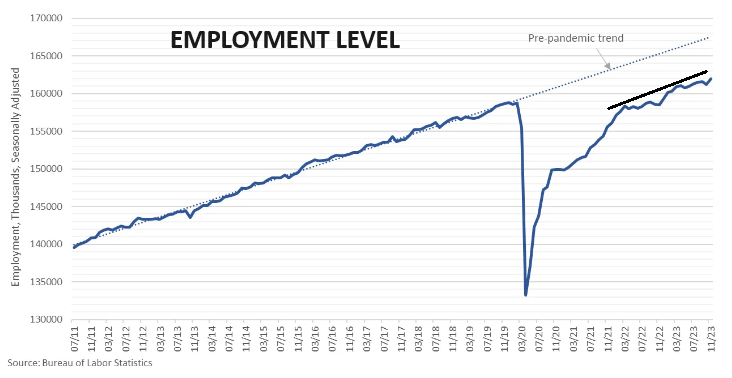
ii) The Employment Level from the Household Survey:
iii) The Number of Non-farm Payrolls from the Establishment Survey:
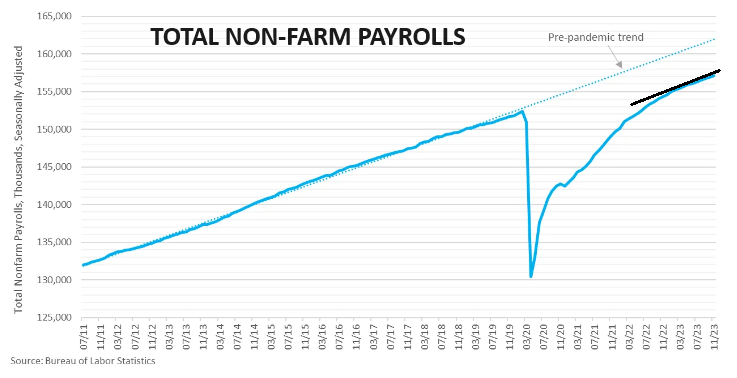
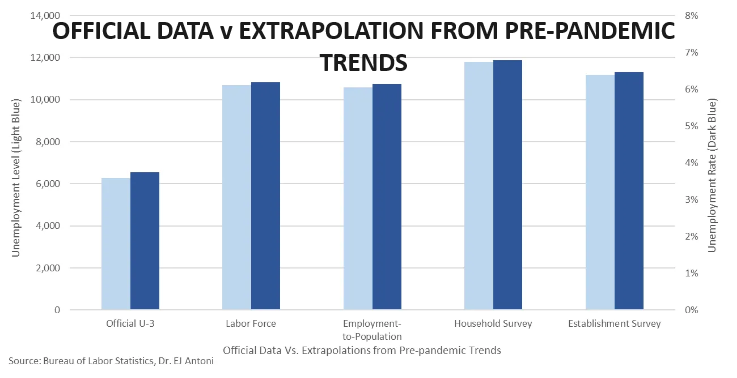 This data affects both the numerator and denominator in the unemployment rate calculation, yielding a modified rate between 6.1% and 6.8%, because it accounts for the missing 4.3 to 5.5 million people absent from the official calculation.
Suddenly, the very bad forward-looking indicators we see all around make perfect sense. Let’s say the data point to a 2-percentage-point rise in the unemployment rate over the next year. We’re not talking about the unemployment rate going from 3.7% to 5.7%.
Instead, we’re looking at going from maybe 6.5% to 8.5%. And we see exactly the same thing with the level and rate of job openings, which show labor demand too has softened below its pre-pandemic trend.
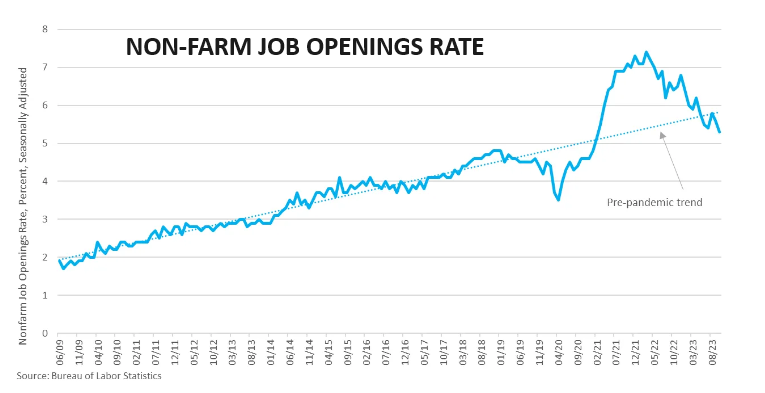
We’ve also witnessed a continuous monthly boom in government jobs, which, although unsustainable, is goosing the headline jobs numbers.
Once again, a little context goes a long way here in interpreting the data more accurately!
And with that context, the very negative indicators from the regional Federal Reserve banks, purchasing manager indexes, as well as countless reports from the Census Bureau, BEA, and BLS (and just about every other three- or four-letter agency), all make much more sense.
The problem is not with the data and where it shows the labor market is heading, the problem is with our perception of where we stand today. The increasingly prevalent belief among economists and talking heads alike is that we’re much further along than we actually are. The labor market – especially the private sector – is nowhere near its pre-pandemic trend. To be clear, economies in recent history often don’t return to their pre-recession trends, even in a strong recovery. But 2020 was not a normal recession. Coming out of one of those normal recessions, the initial growth is barely positive but then picks up steam. 2020 was exactly the opposite – it started with record growth and then slowed. That makes sense because it was such an abnormal economic contraction – entirely artificial and imposed by government fiat.
That leaves us with a labor market much more anemic than most economists perceive it to be. But the point here is not to highlight the labor market as an outlier, but to say that it’s emblematic of the economy at large. We’ve never really recovered from 2020 and 2021. We already had two consecutive quarters of negative economic growth in 2022 (used to be called a recession). The last GDP report pulled a huge amount of growth forward from next year through inventory buildup. GDI has fallen behind GDP at rates never seen before.
In short, the economy is not rip-roaring along like it was in 2019. The very negative indicators we’re seeing are in the context of a relatively negative current situation. That means things are poised to get worse, but perhaps not much worse than they already are.
It’s like being just one or two steps up on a flight of stairs before you trip and fall down, compared to being all the way at the top of the staircase. You tripped and fell down to the same landing either way, but one fall relatively worse than the other. So, don’t ignore all the indicators – the numbers don’t lie. But we have to be able to interpret them honestly, not politically, not with rose-colored glasses, not with pessimism or optimism. It’s reminiscent of the saying that the economist is the one most in touch with reality, because he sees the world not as he wants it to be, not as it could be, and certainly not as it should be – but as it is.
GLOBAL ECONOMIC INDICATORS: What This Week’s Key Global Economic Releases Tell Us
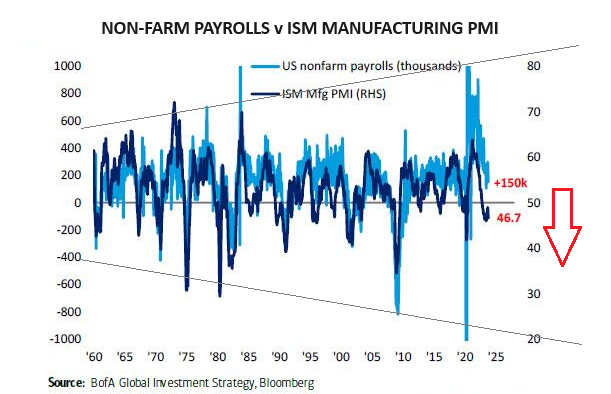
 NON-FARM PAYROLLS
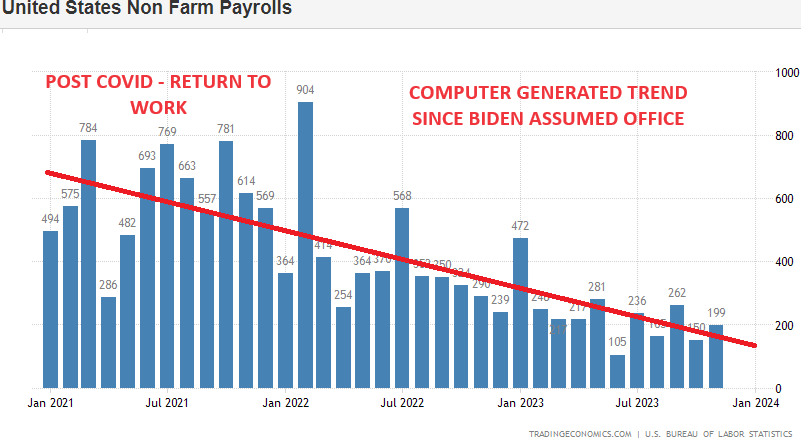
The US economy added 199,000 jobs in November 2023, surpassing the 150,000 added in October and exceeding market expectations of a 180,000 gain.
-
- Nonetheless, it marked the second consecutive month with job additions below the average monthly gain of 240,000 observed over the past year, signaling a slowdown in the labor market.
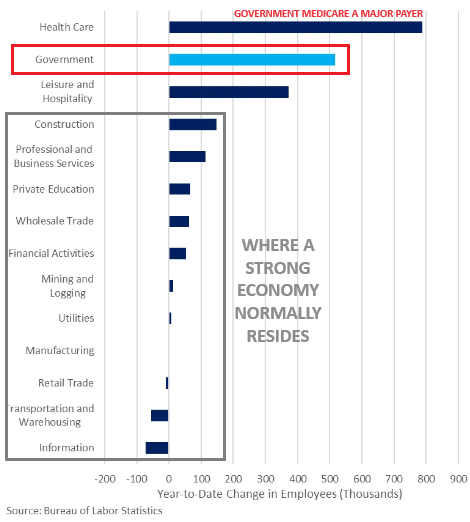
- Health care added 77,000 jobs, driven by ambulatory health care services (+36,000), hospitals (+24,000), and nursing and residential care facilities (+17,000).
- In addition, government payrolls increased by 49,000, boosted by local government (+32,000) and state government (+17,000).
- Finally, employment in manufacturing rose by 28,000, slightly less than expected, as automobile workers returned to work following the resolution of the UAW strike. In contrast, retail trade employment declined by 38,000.
-
- GOVERNMENT = 49k
- HEALTHCARE = 77k
- EXPENSE = 126 versus total of 199 or 63%
SITUATION ANALYSIS
-
- Labor market proxies released in the month allude to a slowing of labor market conditions:
- The weekly initial jobless claims and continuing data for the survey week that coincides with the BLS jobs data ticked up.
- The ADP’s gauge of payrolls, while a poor predictor of the official NFP data, missed expectations.
- Business surveys have also noted that slowdown in hiring.
- The JOLTS data series for October saw a large decline, confirming that the labor market is coming into what Fed officials call “better balance”.
- Meanwhile, average hourly earnings are seen rising in the month, but the annual rate is expected to fall slightly.
- Officials have indicated that they would like to see slower growth and further softening in labor market conditions to help bring inflation back to target.
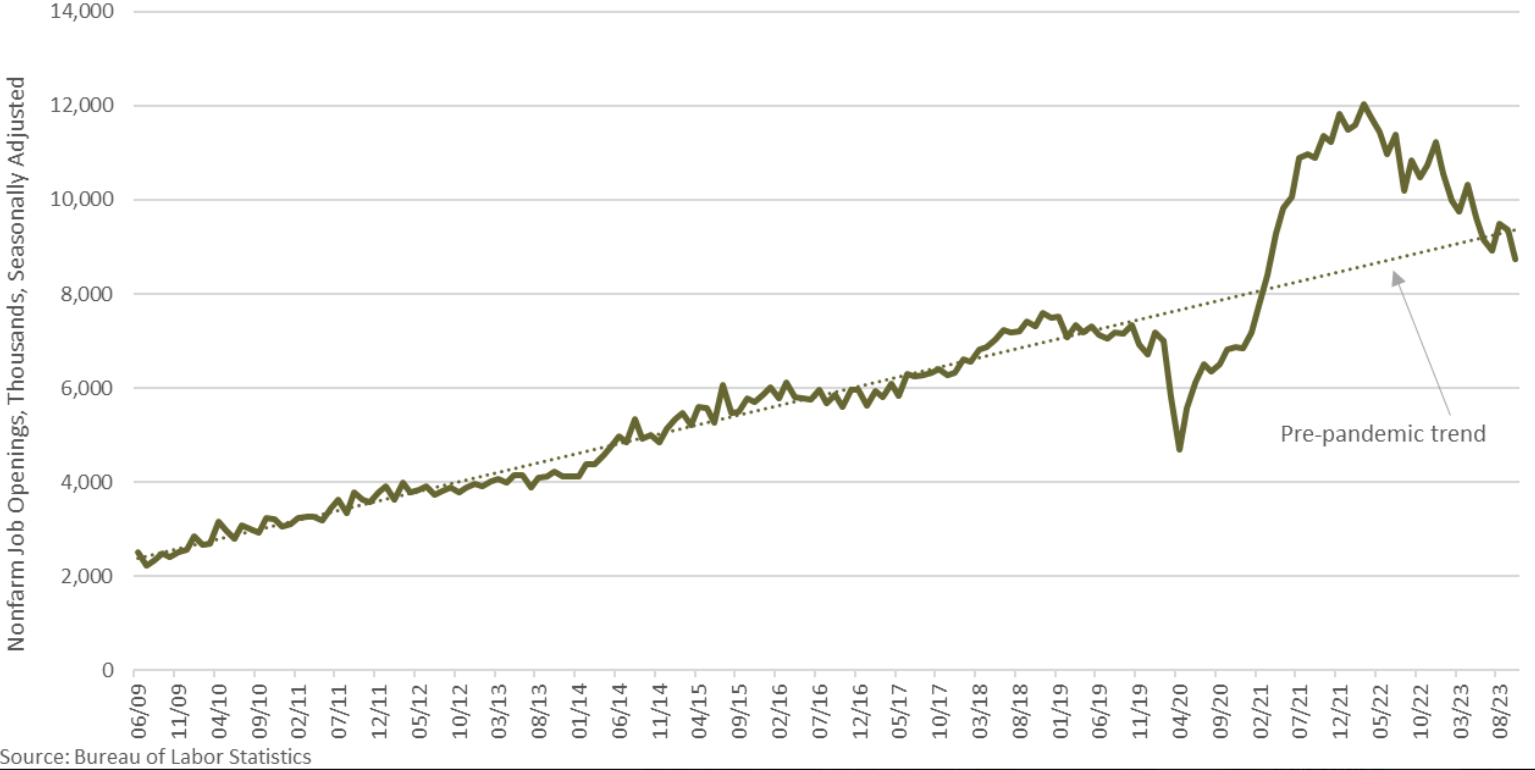 CHART RIGHT: This is happening amid backdrop of Challenger, Gray & Christmas Inc. saying holiday hiring has dropped to lowest level since ’08 – “normal” levels of layoffs coupled w/ 15-yr-low hiring means less employment.
CHALLENGER LAYOFFS:
-
- November Challenger Layoffs rose to 45.5k, accelerating from the 36.8k in October.
- Employers announced plans to hire 15.5k workers, the lowest YTD total for announced hiring plans since 2015.
- Meanwhile, for seasonal hires, through November, seasonal employers have announced 573k hires, the lowest total since 518k seasonal hiring plans announced in 2013.
- Andrew Challenger, labor expert and Senior Vice President of Challenger, Gray & Christmas, Inc states “The job market is loosening, and employers are not as quick to hire. The labor market appears to be stabilizing with a more normal churn, though we expect to continue to see layoffs going into the New Year,”
US JOLTS REPORT
-
- JOB OPENINGS (Oct) 8.7M vs. Exp. 9.3M (Prev. 9.6M, Rev. 9.4M)
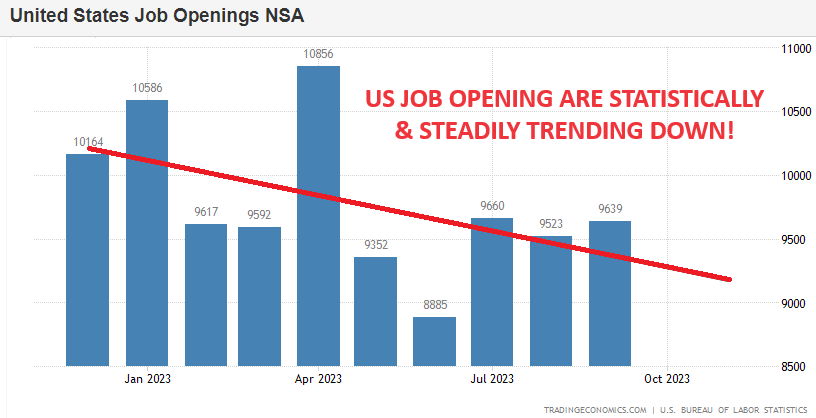 With consensus expecting only a modest drop from the reported September 9.553 million job openings, what the BLS reported instead was a stunning collapse of 617K job openings to just 8.733 million, the lowest since March 2021.
This was well beneath the expected 9.3mln and the lowest since March 2021, in what marks the latest data set pointing to labor market cooling alongside the business surveys and the Beige Book.
-
- Declines were seen across industries, although healthcare, finance, leisure and hospitality, and retail trade saw sharp falls.
- The fall in job openings has seen the ratio of openings to unemployed workers – which has a correlation to core inflation – fall to 1.34 from 1.47, the lowest level since August 2021, but still above the balanced labor market level of 1.00, or the consensus 0.5 series average pre-COVID.
- Meanwhile, the quits rate remained flat at 2.3%, which remains the lowest since late 2020 after peaking at 3% in 2021, although that is the top-end of the pre-COVID range.
- The hires rate was also unchanged at 3.7%, which is within pre-COVID ranges.
US ADP REPORT
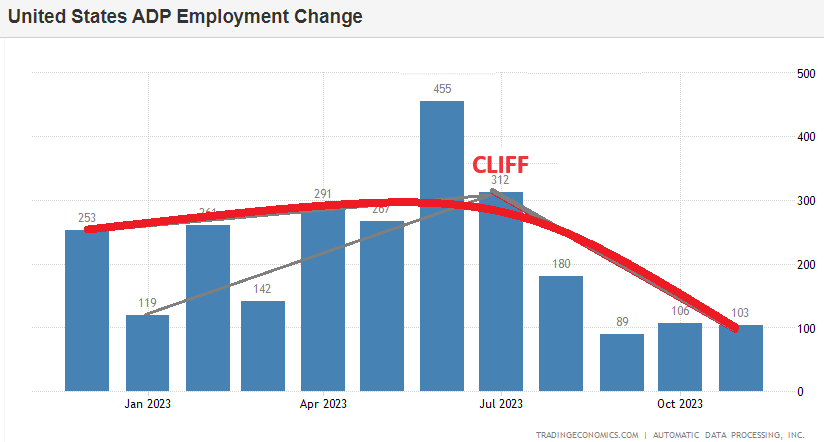 The ADP report saw private sector employment increase by 103k in November, short of the 130k estimate, while the prior was revised down to 106k from 113k.
-
- The wages data eased again in November, where the median change in annual pay for job stayers rose 5.6% (prev. 5.7%), while for job changers, it eased to 8.3% growth from 8.4% in October.
- Both goods and services sectors saw weakness, with leisure and hospitality and manufacturing posting declines.
- The ADP Chief Economist said, “Restaurants and hotels were the biggest job creators during the post-pandemic recovery. But that boost is behind us, and the return to trend in leisure and hospitality suggests the economy as a whole will see more moderate hiring and wage growth in 2024.”
Hospitality Jobs Tumble For First Time In Almost 3 Years As ADP Disappoints “Restaurants and hotels were the biggest job creators during the post-pandemic recovery. But that boost is behind us…”
JOBLESS CLAIMS
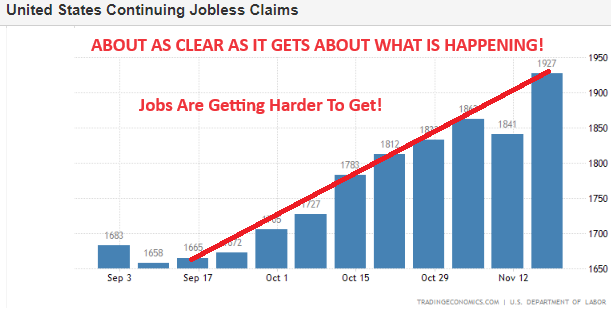 The number of Americans filing for unemployment benefits edged higher by 1,000 to 220,000 on the week ending December 2nd, slightly under market expectations of 222,000, but marking the second-highest reading since September.
-
- The result extended the current trend that the US labor market is showing signs of cooling from tighter levels displayed earlier in the year, albeit remaining strong from a historical standpoint.
- The four-week moving average, which removes week-to-week volatility, rose by 500 to 220,750.
- The non-seasonally adjusted claim count jumped by 93,761 to 293,511, amid sharp increases in California (+14,057), New York (+9,343), and Texas (+7,698).
- On the other hand, continuing claims sank by 64,000 to 1,861,000 in the earlier week, pointing to an improvement in conditions for the unemployed to find available positions.
GLOBAL MACRO
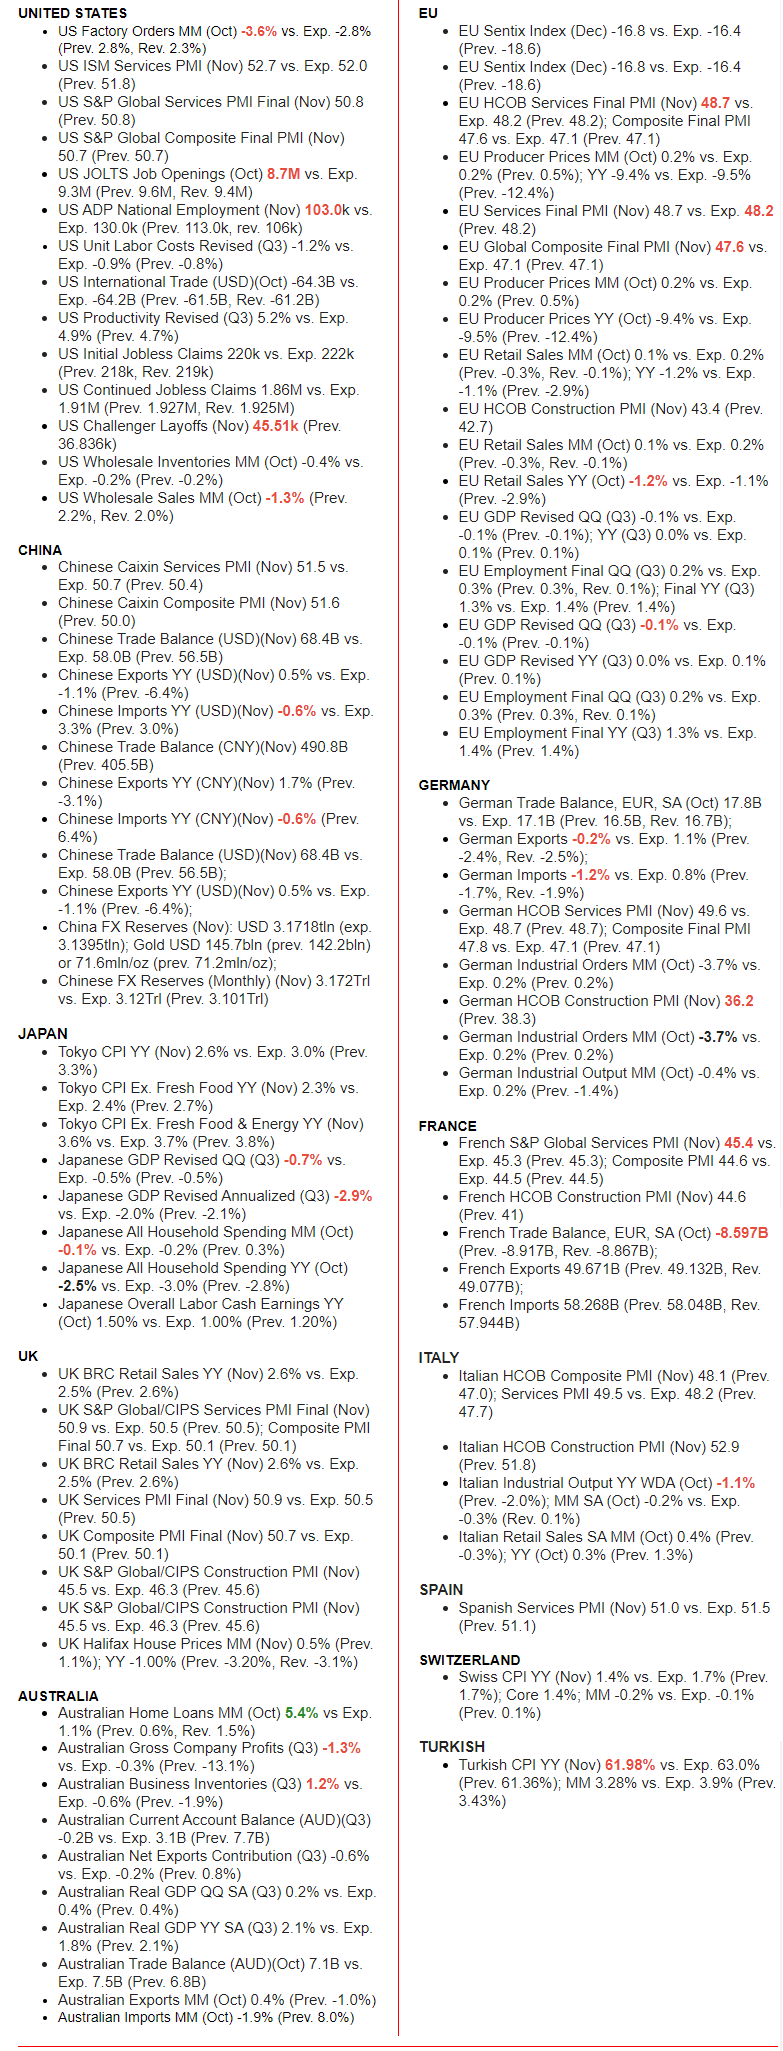
WHAT DOES YOUR SCAN OF THE DATA BELOW TELL YOU? – THE MEDIA AVOIDS BAD NEWS!
We present the data in a way you can quickly see what is happening.
THIS WEEK WE SAW
Exp=Expectations, Rev=Revision, Prev=Previous
DEVELOPMENTS TO WATCH
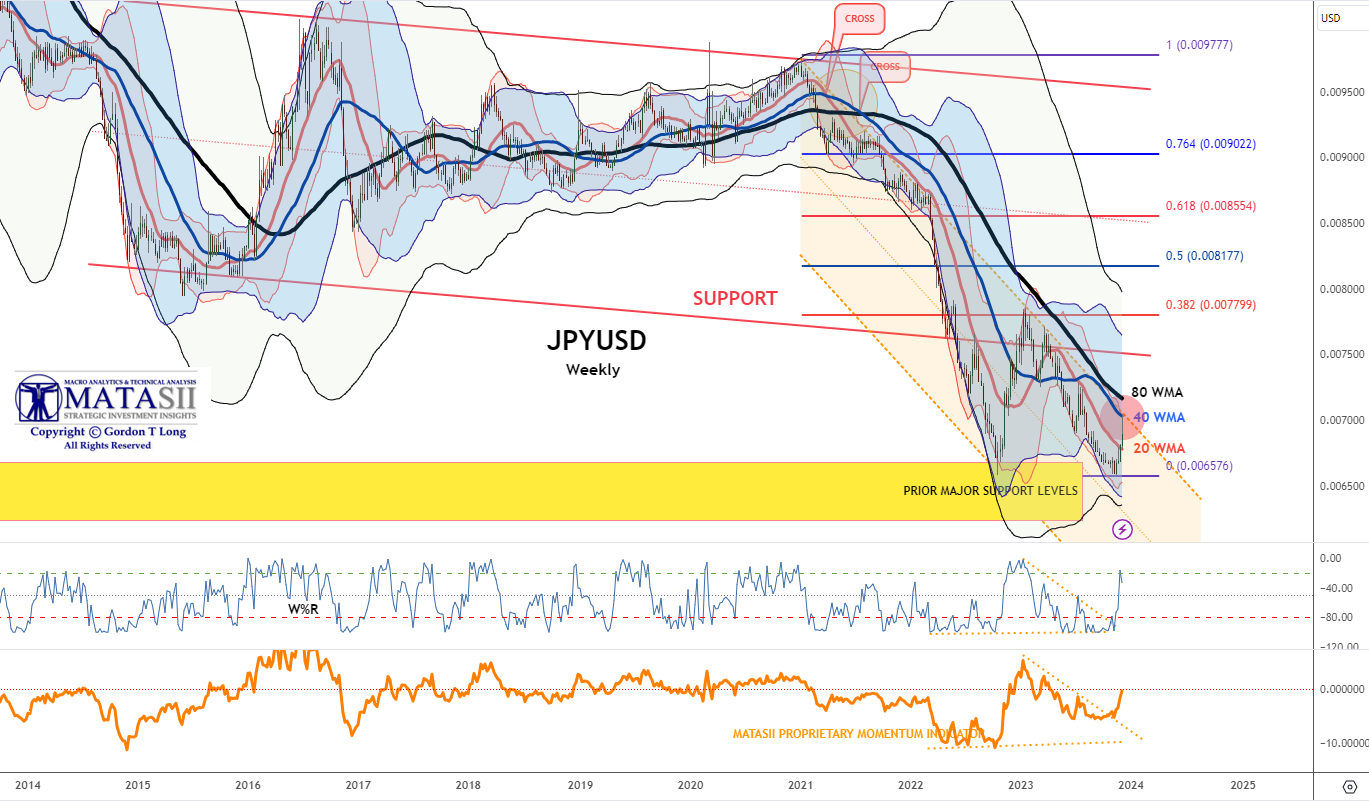
 WORRYING SIGNS IN JAPAN – Yen and JGB’s Under Significant Pressure.
Beyond spectacular! The JPY broke below the 100 day overnight…and traded below the 200 day briefly. You don’t see these things very often, at least not in “serious” assets. (Chart Right).
JPY 1 month volatility up 34%. Absolutely crushing it. (Chart Below)
THE YEN SURGED on Thursday to see its best day since December 2022, when the BoJ widened its YCC target band.
The Yen strength was sparked by fresh speculation of a live December 18-19th meeting driven by commentary from BoJ Governor Ueda that the handling of monetary policy would get tougher from the end of the year. Ueda also noted that the BoJ has not made a decision on which interest rate to target once they end NIRP, but options include raising the rate applied to financial institutions’ reserves at the BoJ or revert to policy targeting the overnight call rate.
The comments saw the market pile on rate hike bets for December, with a consensus 20% probability of a 10bp hike in December taking rates to 0.00% being priced in.
Note: USD/JPY hit lows of 141.73 with a sharp move lower observed from consensus 144.00, breaching beneath 143.00 and the 200d MA at 142.28, albeit the move was very quick and it had quickly pared back above the 200 DMA and above 143.00.
CARRY TRADE
The move in the Yen has been most pronounced against carry currencies. UBS highlights that the move in the Yen implicates the carry strategy, adding it has been one of the best performing systematic strategies this year. The desk writes that “JPY has the most negative carry within liquid FX, systematic funds are heavily positioned for short JPY. However, if JPY strength continues given speculation of a BoJ policy shift, systematic funds are likely to further reduce their exposure on the carry strategy by selling liquid, high-carry currencies like COP, MXN, BRL and HUF”.
If Japan is indeed embarking on a new chapter of structurally higher inflation, the choices going forward are not going to be easy. Adjusting to a higher inflation equilibrium will require rising real rates and greater fiscal consolidation, in turn more damaging to older and wealthier voters, unless the younger voters get taxed. While this adjustment can be delayed, it would be at the cost of even greater financial instability down the road and a much weaker yen. The yen, in turn, can only embark on a sustained uptrend when the Japanese government – via BoJ rate hikes – is forced to unwind the world’s last big surviving carry trade in the post-COVID world, one which has allowed Japan to enjoy a period of eerie social and political calm. Those days, however, are about to come to a thunderous end.
EASY FINANCIAL CONDITIONS & $350B IN LIQUIDITY – This is What Is Keeping Markets Afloat
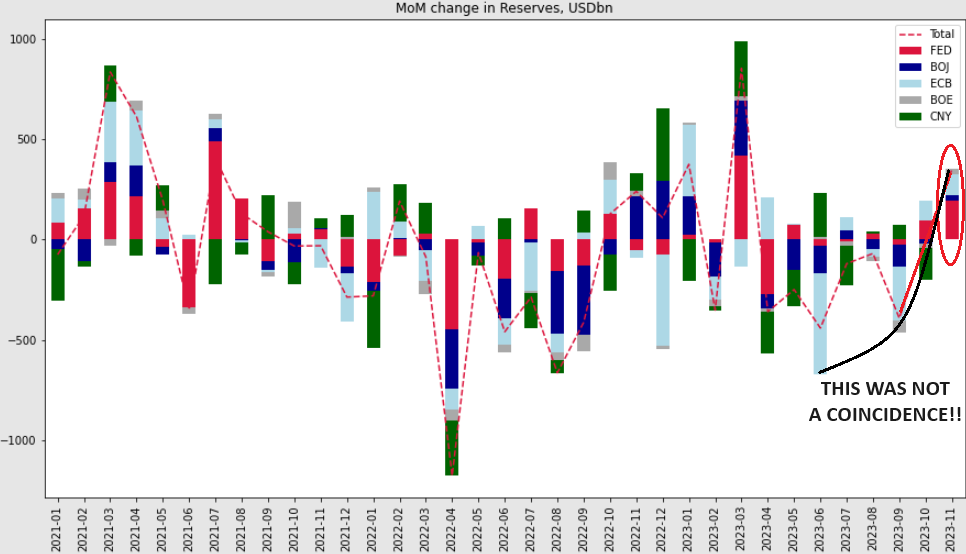 According to Goldman Sachs, the G4 central banks + the PBOC injected $350BN in November Liquidity. This was a major driver in the historic month. In fact, this was the third largest monthly increase this year after January and March 2023.
The US addition of $60bn for a third consecutive week plus weaker dollar are the main drivers.
While the BoJ keeps adding liquidity via bond purchases, increases in the TGA balances in the past 20 days have net drained Yen liquidity.
Looking forward over the year end and at the start of 2024, Goldman thinks that the US can keep adding liquidity via high bill issuance and RRP withdrawal over the next couple of months, while the dollar contribution to benign liquidity conditions could face some headwinds due to the risk of pricing out of some of the March Fed cuts as a result of the strong positive FCI impulse in November.
GLOBAL TRADERS TURN THEIR FOCUS TO JAPAN!
THE LABOR REPORT SIGNIFICANTLY CLOUDED THE US OUTLOOK
Click All Charts to Enlarge
1 – SITUATIONAL ANALYSIS
A DESTABILIZING JAPANESE SHOCKER
We were given a strong warning this week that global financial instability is ahead in 2024. A10-20% jump in Japanese Yen has historically coincided with a global volatility event and that is exactly what we got!
Beyond spectacular! The JPY broke below the 100 day overnight…and traded below the 200 day briefly. You don’t see these things very often, at least not in “serious” assets. (Chart Right).
The potential destabilization of the $20T Japan and an end to Japanese Yield Curve Control (YCC) raises the “floor” for global yields and a higher yen.
This is the 1st big test for bull market in Japanese stocks, since it’s a true bull when Nikkei rises with higher yen. We have just seen a move of around 6% over the past 4 sessions.
NOTE: We have more on this in tomorrow’s weekly Newsletter.
A CONFUSING US LABOR REPORT
Friday’s strong Labor Report confused everyone and left the markets completely flat scratching their heads going into close. This seldom happens after such an anxious build-up to its release. The Unemployment Rate was well below the critical recession signaling 4.0%, at slightly below consensus of 3.7% with new job creation a weak but satisfactory199 new jobs.
NOTE: We also go into this in tomorrow’s Newsletter “WHAT THE LABOR REPORT TOLD US: Sometimes Good Data is Bad News”.
On Monday the world will be trying to figure out what both these events mean while staring at Tuesday’s CPI and Wednesday’s PPI inflation guiding releases. Though the perception is that Inflation is behind us and disinflation / deflation is now the real concern, any deviation from that and we add more confusion, uncertainty and market risk.
2 – MARKET ANALYSIS
 Reality set in this week showing that the ‘goldilocks’ narrative is not compatible with the massive rate-cuts priced-in for next year.
As Goldman warned:
“…it may be hard to justify more than 75bp of cumulative easing without weaker growth. A recession could clearly motivate a much deeper easing cycle, but a high weight on that outcome is not consistent with other asset prices, or with our own central case. For that reason, the market is moving into territory where it is likely to become more difficult for US rates to rally unless the growth picture deteriorates more than markets, expect.”
EXPECTATIONS
 The central question currently in the minds of traders is when will the recession and its telltales show itself, since that is when the markets will fully react and establish a trend.
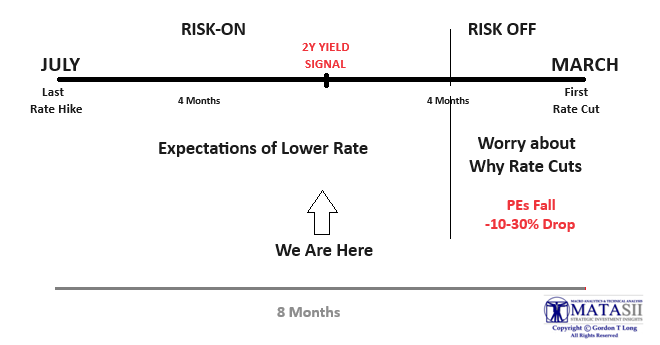
Until Friday’s Labor Report that sentiment was a guess, which is shown in the chart to the right that we distributed to subscribers after Federal Reserve Chairman Jerome Powell’s “fireside” chat on Friday 12/01. In that “chat” Powell had the unintended consequences of solidifying the markets view of a soft landing lying ahead with rate cuts to likely begin in March 2024. Traders adjusted their positions accordingly with yields falling, gold breaking out to the upside and risk assets bought without increasing hedge positions significantly. The illustration above was the best way of describing MATASII’s understanding of what the trading consensus was at that time.
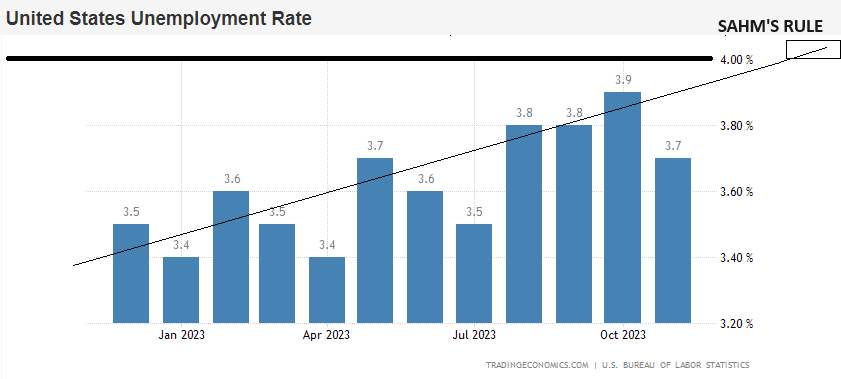 SAHM’S RULE
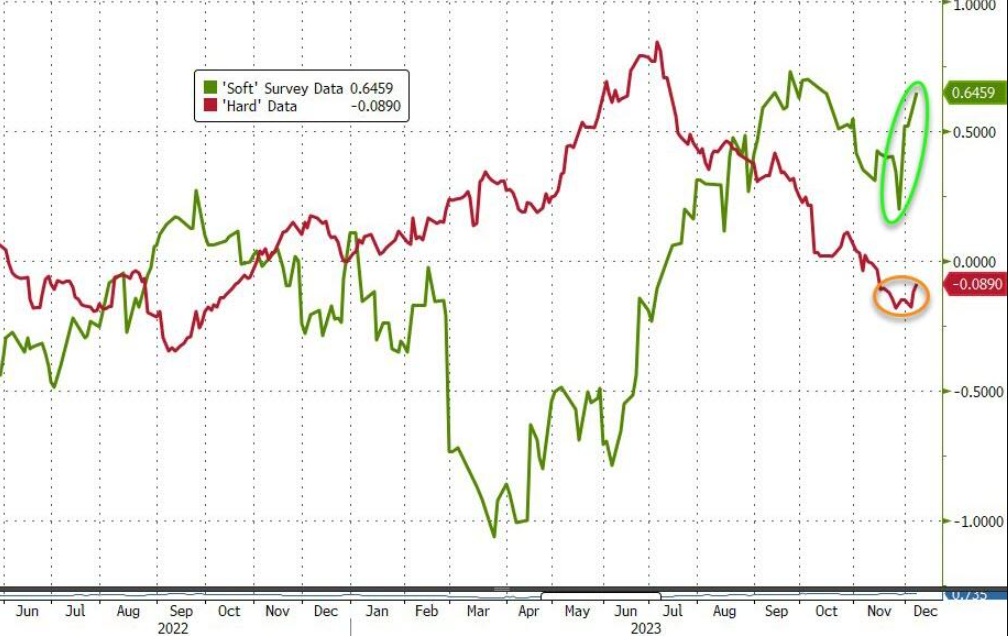
Friday’s Labor report effectively adjusted that view without the market actually moving.
What has come into view for the market is a focus on the “Sahm Rule“. This rule postulates that
A recession is triggered when the average U-rate is 0.5% higher than the minimum 3-month average of past 12 months.
 From our payrolls report this would be triggered by U-rate above 4% and occur in the next 2-3 months.
Since the markets until November have “sold the last hike”, which occurred in July, we have likely been in the window of seeing front-running of the 1st negative payroll. The 3.7% Unemployment rate suggests they may be a little early in the “front running” Trade.
We can expect to yet another reversal (to the downside) once the data unambiguously shifts from “soft” to “hard”.
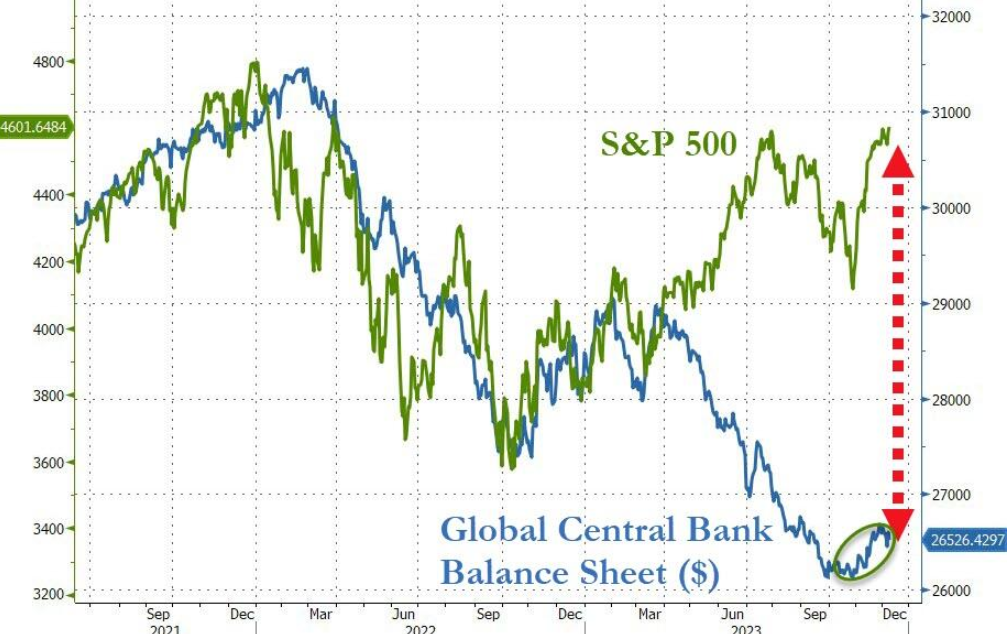 COUPLING SAHMS’S WITH CENTRAL BANK LIQUIDITY
So in the chart to the right, which comes first – the Equity market collapses or Global Central Bank Balance Sheet Explosion?
CURRENT EXPECTATIONS
-
- In the very Near-Term – Equities likely rise. (Q4 Lower yields = Higher stocks)
- In the Short-Intermediate Term -Equities Fall on Hard Recession Data. (71% probability of a Fed cut on the March 20th FOMC, and 100% probability May 1st)
- In the Intermediate-Longer Term -Central Bank Balance sheets expand (>H2 2024).
- By late summer 2024 the two will likely meet in the middle before the market melts up in 2025, due to liquidity pumping and a falling US$.
Lower Yields = Lower Stocks in Q1 2024
3 – TECHNICAL ANALYSIS
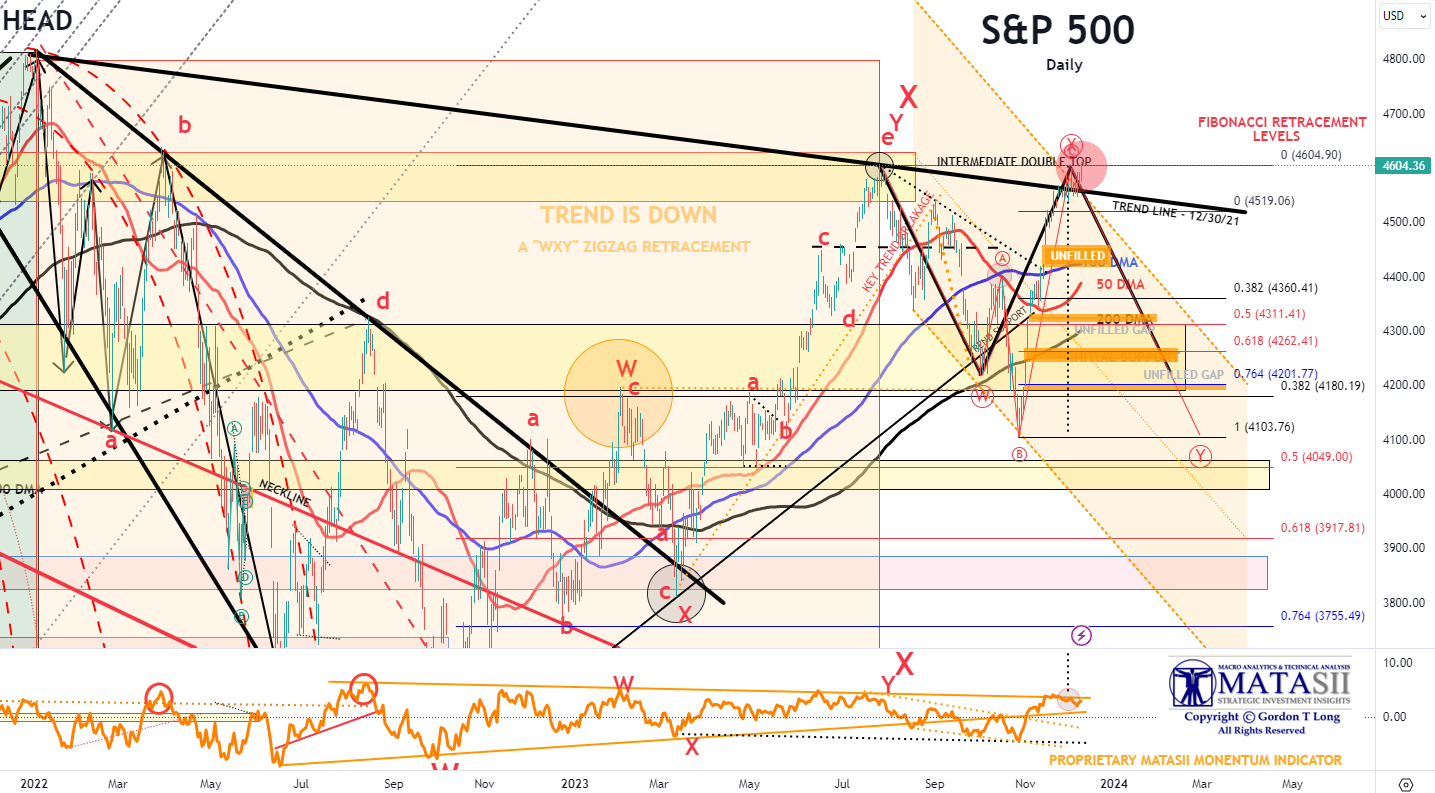
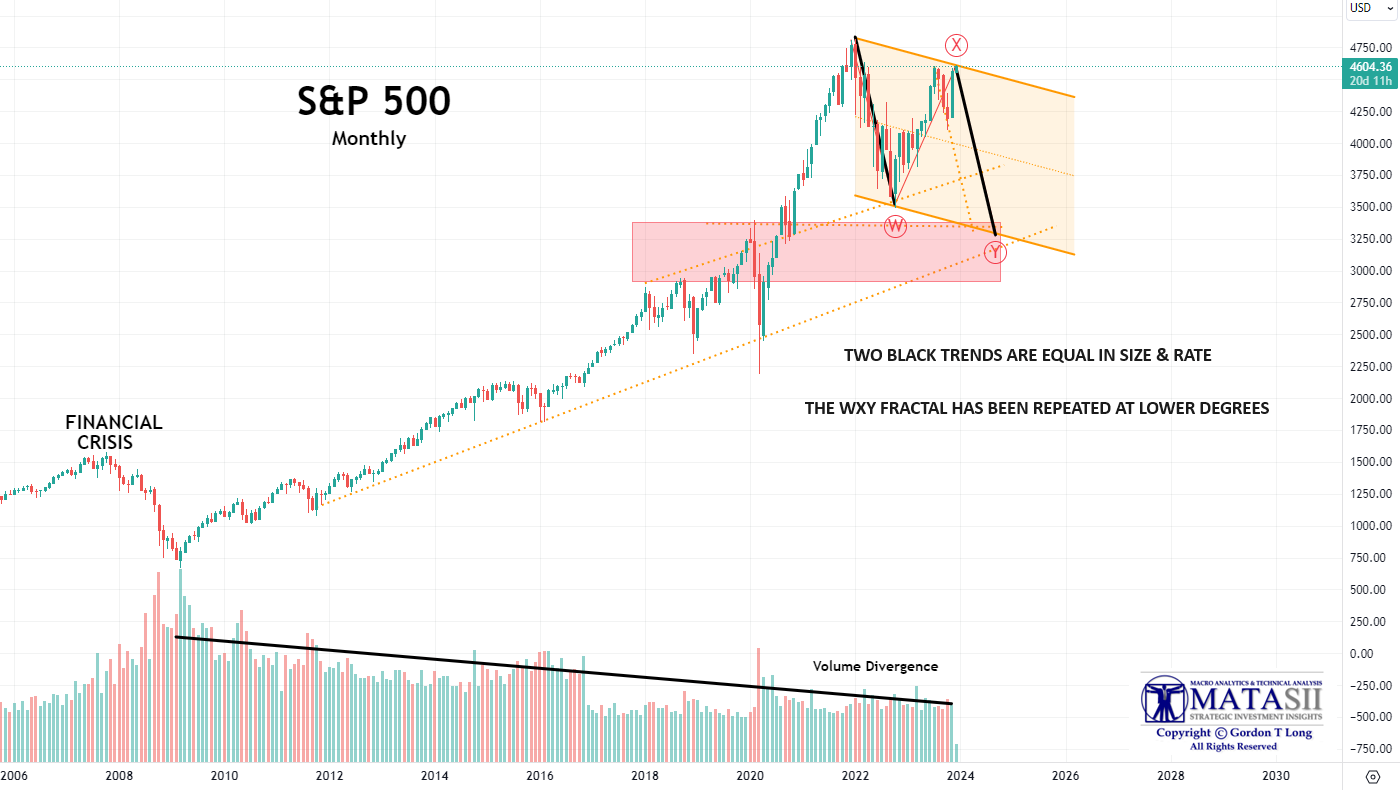 S&P 500
We are at an important inflection point in the markets and the US equity market in particular, as can be seen in the chart to the right.
We are testing the upper trend channel overhead resistance. What is important to note in the chart is:
-
- The two downward trend lines (dark black) are equal in size and rate. This is a high probability outcome.
- The pattern is an Elliott Wave Double Combo ZigZag pattern fractal, which has been occurring at lower degree levels.
MAGNIFICENT SEVEN
The Capital Weighted S&P 500 has been driven and controlled by the Magnificent Seven, which recently have been showing weakness and are being constrained technically by their inability to break through the Double-Top overhead resistance.
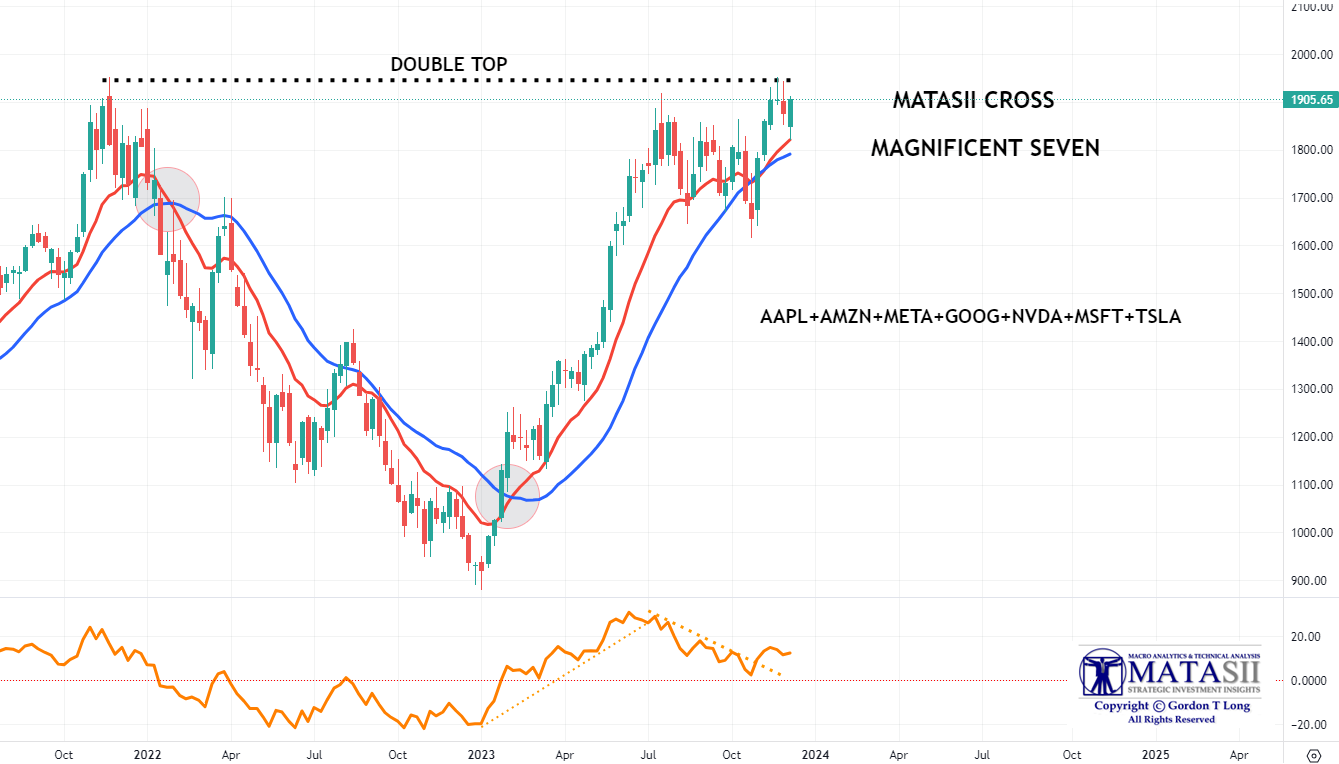
YOUR DESKTOP / TABLET / PHONE ANNOTATED CHART
Macro Analytics Chart Above: SUBSCRIBER LINK
The Daily S&P 500 closed Friday at exactly its prior high – unable to breakthrough the Double Top pattern formation. We can expect this to be resolved and the market to then move significantly in that direction. The powers to be & markets want that resolution to be to the upside. The Macro data and economic indicators suggest that it will be to the downside. Our experience is to let the market decide and then trade the trend. How the market decides is usually through an unexpected event.
YOUR DESKTOP / TABLET / PHONE ANNOTATED CHART
Macro Analytics Chart Above: SUBSCRIBER LINK
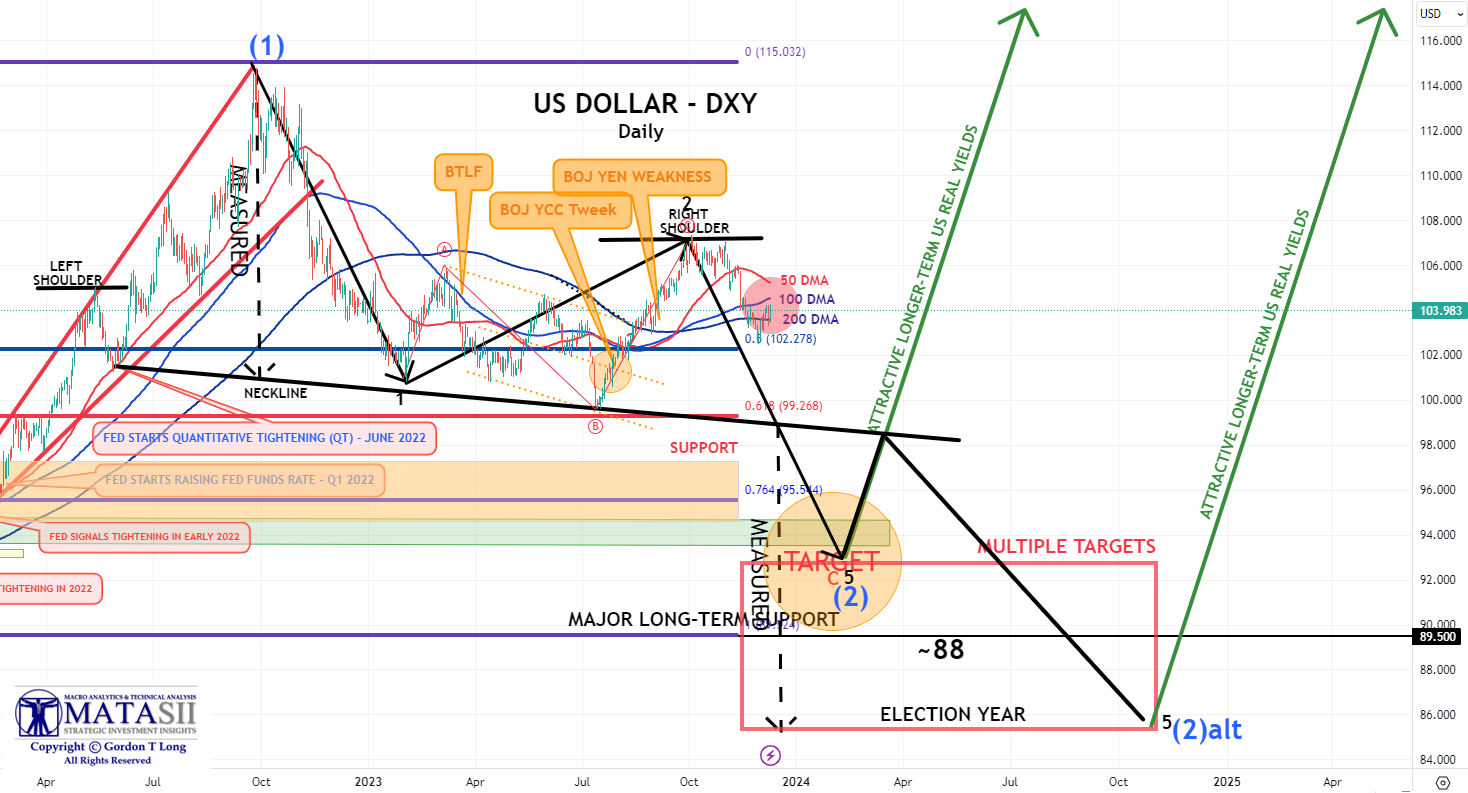
 US DOLLAR – DXY – Daily
The 50,100 and 200 DMA bands for the US dollar are closing together which often precedes a major move. A falling dollar makes the S&P 500 cheaper and hence normally lifts equity indexes (at least in the short term).
A secular surging Japanese Yen could structurally weaken the US$ in the near-to-Intermediate term.(Chart Right)
YOUR DESKTOP / TABLET / PHONE ANNOTATED CHART
Macro Analytics Chart Above: SUBSCRIBER LINK
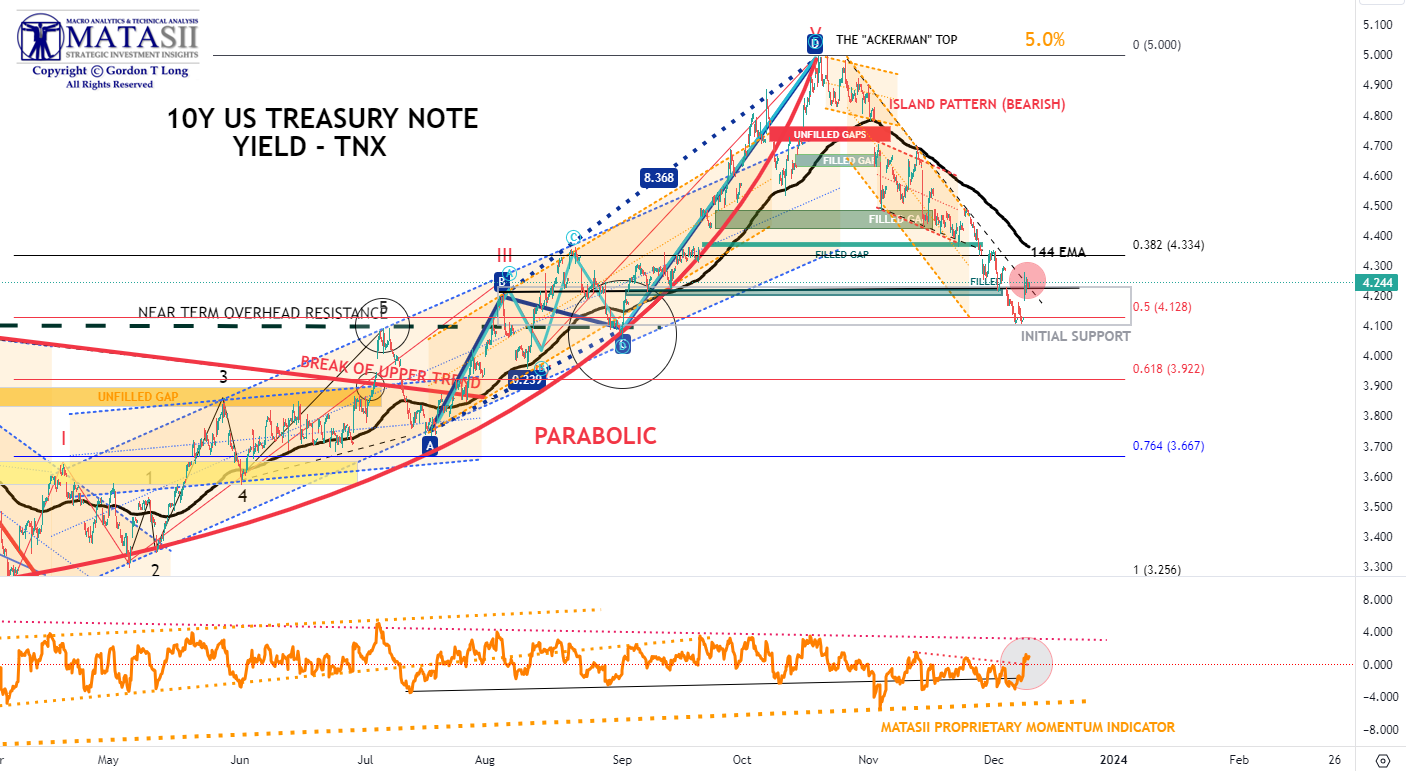
BOND MARKET – US 10Y TREASURY YIELD – TNX – Daily
The TNX bounced off a retest of support on Friday with Yields rising. A very near term test of a higher yield at ~4.35% is likely. Rising yields are not normally good for equities and could add weakness next week to the equity markets, depending on developments in the dollar market.
YOUR DESKTOP / TABLET / PHONE ANNOTATED CHART
Macro Analytics Chart Above: SUBSCRIBER LINK
FAIR USE NOTICE This site contains copyrighted material the use of which has not always been specifically authorized by the copyright owner. We are making such material available in our efforts to advance understanding of environmental, political, human rights, economic, democracy, scientific, and social justice issues, etc. We believe this constitutes a ‘fair use’ of any such copyrighted material as provided for in section 107 of the US Copyright Law. In accordance with Title 17 U.S.C. Section 107, the material on this site is distributed without profit to those who have expressed a prior interest in receiving the included information for research and educational purposes. If you wish to use copyrighted material from this site for purposes of your own that go beyond ‘fair use’, you must obtain permission from the copyright owner.
NOTICE Information on these pages contains forward-looking statements that involve risks and uncertainties. Markets and instruments profiled on this page are for informational purposes only and should not in any way come across as a recommendation to buy or sell in these assets. You should do your own thorough research before making any investment decisions. MATASII.com does not in any way guarantee that this information is free from mistakes, errors, or material misstatements. It also does not guarantee that this information is of a timely nature. Investing in Open Markets involves a great deal of risk, including the loss of all or a portion of your investment, as well as emotional distress. All risks, losses and costs associated with investing, including total loss of principal, are your responsibility.