Gordon T Long
Global Macro Research | Macro-Technical Analysis
MACRO
US ECONOMICS
POWELL JARS THE MARKETS – WHY??
OBSERVATIONS: The Hidden Truth About the US Labor Market
If you want an example of misinformation, you need not look any further than the US Labor Market. It is a full time job trying to distill between misinformation, faulty data, statistical distortions and just plan propaganda lies! The bottom line of it all that is it is keeping us blind to the realities of what is going on and leaving us with ever diminishing opportunities to fix the problem before the hard realities suddenly overwhelm us.
The manufacturing sector reported a 28,000 job gain, but that is only because 30,000 auto workers returned to work. In other words, the economy shed 2,000 manufacturing jobs. The November US Labor Report claims “employment in manufacturing has shown little net change over the year”. The estimate by the data driven ADP report showed that the economy actually lost 15,000 manufacturing jobs in November alone? Who do you believe?
Whoever is right, the fact is those are good jobs and the productive jobs that we need. The hard reality is the people who lost those manufacturing jobs, well, maybe they got a couple of part-time jobs working in a restaurant or hotel, or doing something to replace the paycheck that they lost. But they need two or three jobs, and that’s the story of this so-called strong labor market — people replacing good jobs with multiple bad jobs.
It’s important to fully appreciate that the BLS as usual revised down the prior two months by about 35,000 jobs. In fact, the agency has revised every report this year down, after the fact except for one. So, to take this month at face value, because we beat by 19,000 jobs, and say, ‘Hey look! We created more jobs than we thought.’ It’s very likely that by next month, they’re going to revise this month’s number lower. And so it wouldn’t have been a beat. It would have been a miss. But no one’s going to care, because they’re going to be focusing on the December number, which may be another beat that gets revised to a miss in January that nobody cares about, as everybody forgot about December and now they’re looking at January.
Of the 199,000 jobs the BLS claims the economy created, about 24% were auto workers and motion picture workers returning to their jobs after strikes. Were these jobs really created? No. The jobs were there. It’s just that the people who had the jobs were on the picket lines instead of the production lines or whatever they’re doing in motion pictures.
Of the rest of the jobs, 82% were in the healthcare and government sectors. We don’t want government jobs! First of all, where is the government getting the money to pay all of these workers? They’re borrowing it! … These are not productive jobs. What are these government workers going to do with their paychecks? Well, they’re going to buy stuff that they didn’t help produce and push up the price. And there is a limit on how many healthcare workers the economy can support.
Healthcare is already bloated. We already spend way too much money. You know, a lot of the health care workers are just handling paperwork that has to do with insurance. And we have an excess amount of insurance, because we have an excess amount of government involvement.
The government numbers reported an additional 40,000 jobs in leisure and hospitality. The ADP reported a loss in this job category. They’re talking about the same month. They can’t both be right? And neither of them are probably right. That’s why these numbers don’t even mean anything.
That’s the whole point. And yet so many people spend so much time and energy obsessing over these numbers. Of course, the government wants to give you good news. So, it’s not a big surprise when the government gives you good news. The whole thing is rigged anyway. The media, the government – it’s all just a bunch of propaganda and deflection. Most of the people fixated on the jobs numbers don’t understand what’s going in the broader economy. None of these numbers are going to matter when we have a huge crisis and all of a sudden it hits the fan.
WHAT YOU NEED TO KNOW!
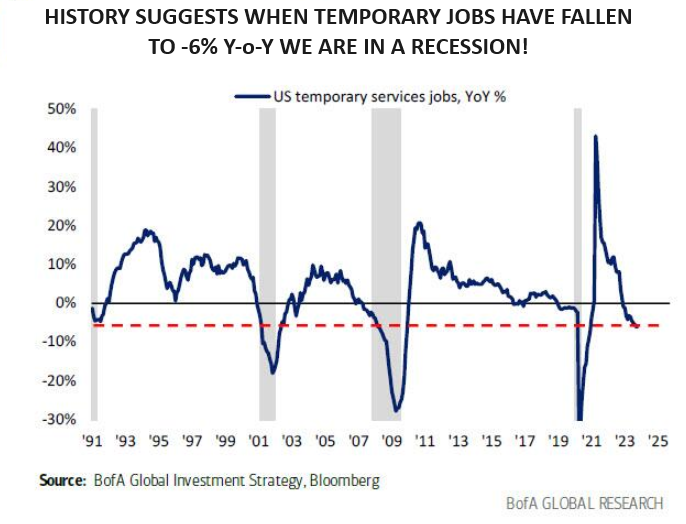 FALLING TEMPORARY JOBS
Consumer spending and consumption, (the US is a ~70% Consumption Economy), is all about the US Labor market. The US Labor market remains decisively soft. Hiring of labor is slowing (JOLTS down), but as yet no firing of labor (no negative payrolls). However, growth of Temporary Workers is now contracting by -6% Y-o-Y which historically has always coincided with the US ALREADY being in a Recession? Should we believe the White House’s controlled BLS data? It is never audited nor stands on any foundation other than the public’s willing acceptance of it.
RESEARCH
POWELL JARS THE MARKETS: Was It A Miscue or Planned?
-
- Powell was facing 6 core issues going into the FOMC Meeting, even before he had FOMC Members taking down the Fed’s Plot chart.
-
-
- The 2 Year Treasury Always Leads the Fed and it is in near Freefall.
- The Fed’s own Financial Conditions Index (FCI) is “Loose and Easy”.
- The SOFR Rate is steadily falling impeding RRP Liquidity Flows into Treasury Bills.
- No One Any Longer Believes the Fed Narrative and Is Front Running It!
- Interest Rates on the Federal Debt are now approaching a $1.4 T Annualized Rate.
- It is an Election Year and the incumbent President is in Trouble!
-
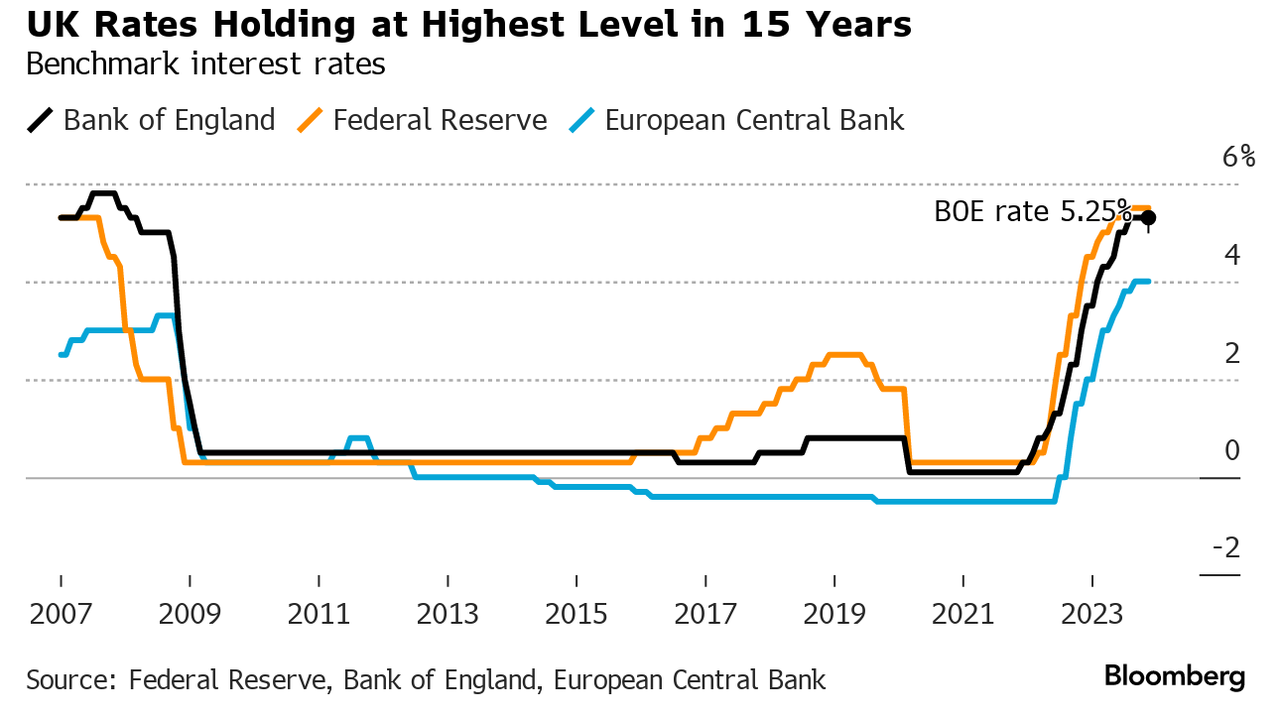
THE DIRECTION OF RATES – December Central Bank Monetary Policy Meetings
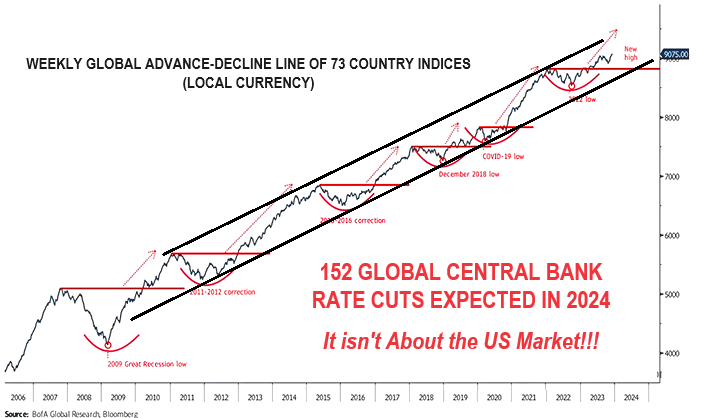
152 CENTRAL BANK RATE CUTS ARE NOW EXPECTED IN 2024
They Panicked From Being Too Late on the Way Up and Are Now Panicking From Going too High on the Way down!
-
- ECB: As expected, the ECB opted to stand pat on rates for a second consecutive meeting with the main policy adjustment coming via the balance sheet.
- BOE: As expected, the MPC opted to stand pat on rates for a third consecutive meeting via a 6-3 vote.
- SNB: Largely as expected from the SNB with the key rate maintained at 1.75% and the emphasis on selling foreign currency removed.
- NORGES: Norges Bank defied consensus by triggering the hike that they flagged in November’s meeting as “likely” to occur in December.
- BANXICO: The Banxico left rates unchanged as expected at 11.25%, however, it was received hawkishly by giving away little signal on future rate cuts as it maintained guidance that rates need to stay at the current level for some time.
GLOBAL ECONOMIC REPORTING: What This Week’s Key Global Economic Reports Tell Us?
-
- CPI: Overall, CPI was in line with expectations. Headline M/M rose 0.1%, a touch above the expected and prior 0.0% print, while the Y/Y rose 3.1%, in line with forecasts and down from the prior 3.2%. Core M/M was in line at 0.3%, accelerating marginally from the prior 0.2% while the Y/Y rose 4.0%, in line with the prior and forecast.
- PPI: PPI for November was unchanged M/M, despite expectations for a 0.1% gain with the prior revised up to -0.4% from -0.5%. Y/Y PPI rose 0.9%, beneath the 1.0% forecast while the prior was revised down to 1.2% from 1.3%.
- NFIB SMALL BUSINESS: NFIB’s Small Business Optimism Index decreased 0.1 point in November to 90.6, which marks the 23rd consecutive month below the 50-year average of 98. Twenty-two percent of owners reported that inflation was their single most important problem in operating their business, unchanged from October, but 10 points lower than this time last year.
DEVELOPMENTS TO WATCH
 GASLIGHTING INFLATION: America Needs a Clearer Explanation of What Inflation IS and How HIGH It Really IS!
INFLATION IS: Too Much Money Chasing Too Few Goods
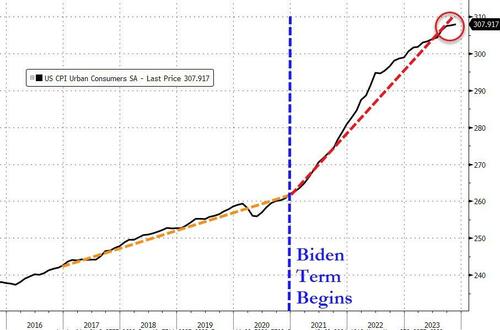
HOW HIGH IS IT?: Up 18.5% In Three Years As Measured By CPI. Inflation is not falling. It is the rate of increase that is falling.
WHY HAS IT HAPPENED?: We pushed $13.59T of total debt Into the Economy while Economic Growth was only $5.18. Of the overage (13.59 – 5.18 = 8.41), Government spending was a deficit of $5.15T more than the revenue taken in over the same three years. Government spending alone was over 62% of the inflation problem! The other 38% was contributed by a credit card explosion to maintain artificial life styles, financing of stock buybacks & dividend payouts and financing of education, medical costs & rising housing costs.
ECONOMIC GROWTH = 5.18T, DEBT GROWTH = 13.59T or 2.65X as large
GOVERNMENT DEFICIT (REVENUE MINUS SPENDING) = 5.15T
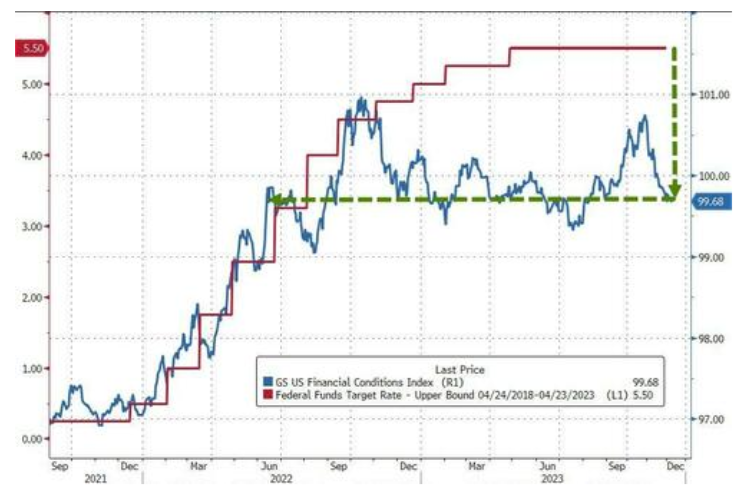
FED FUNDS RATE: The Fed Has Lost Control of Its Own Financial Conditions Index (FCI)
-
- No One Believes the Fed and the market is now “front running” the obvious outcome.
- The dramatic easing of financial conditions has erased all of The Fed’s rate-hike pressures since June 2022.
Is that really what The Fed wants? No! But they no longer have control, because the market doesn’t believe them!
POWELL JARS THE MARKETS: Was It A Miscue or Planned?
 The Fed effectively pivoted by not pushing back against market expectations of early rate cuts.
It wasn’t so much about what they said as what they have been saying, but didn’t reiterate it neither forcibly nor AT ALL.
IT WAS EFFECTIVELY A PIVOT BY ‘OMISSION’!
Powell was facing 6 core issues going into the FOMC Meeting, even before he had FOMC Members taking down the Fed’ Plot chart.
WHAT POWELL FACED PRIOR TO THE FOMC MEETING
-
- The 2 Year Treasury Always Leads the Fed and it is in near Freefall.
- The Fed’s own Financial Conditions Index (FCI) is “Loose and Easy”.
- The SOFR Rate is steadily falling impeding RRP Liquidity Flows into Treasury Bills.
- No One Any Longer Believes the Fed Narrative and Is Front Running It!
- Interest Rates on the Federal Debt are now approaching a $1.4 T Annualized Rate.
- It is an Election Year and the incumbent President is in Trouble!
Let’s consider each of the six:
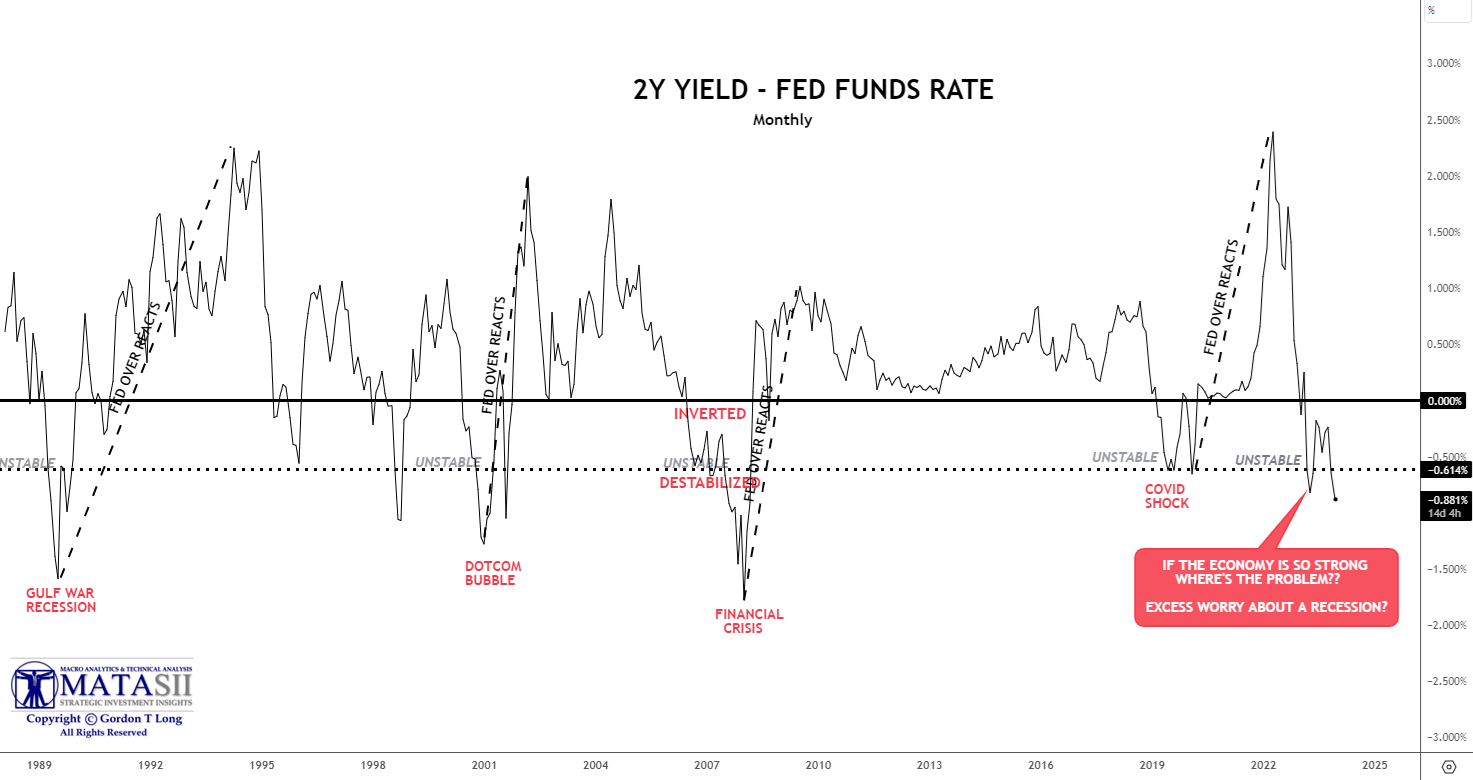
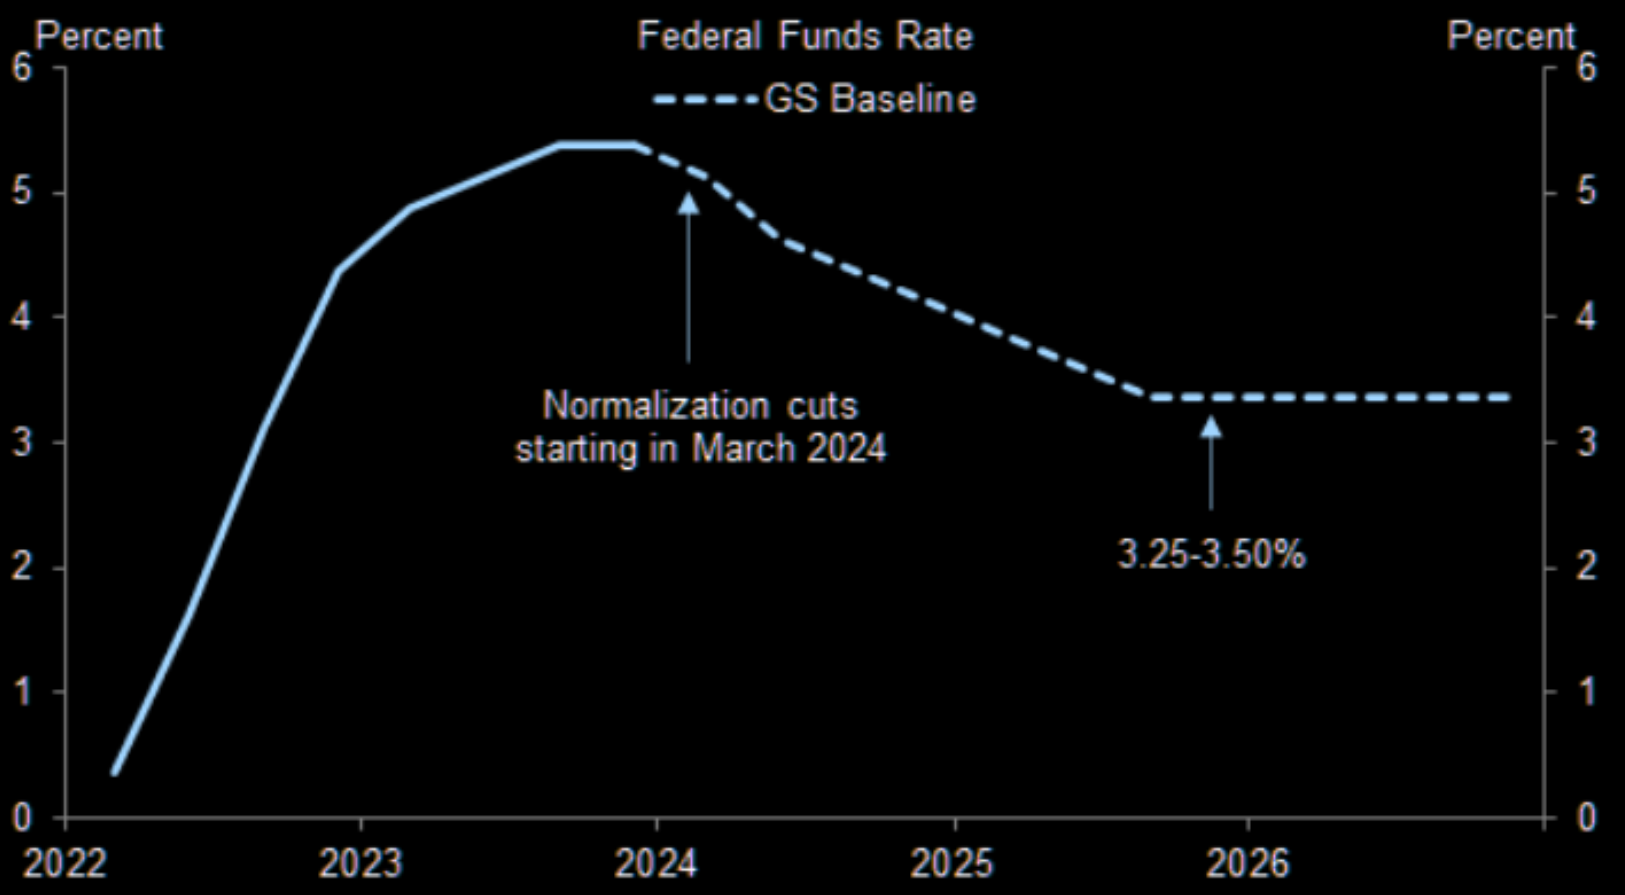
1- The 2 Year Treasury Always Leads the Fed.
With the 2 Year falling as it has, and remains down and falling, the Fed can be expected to lower rates in 60-90 days.
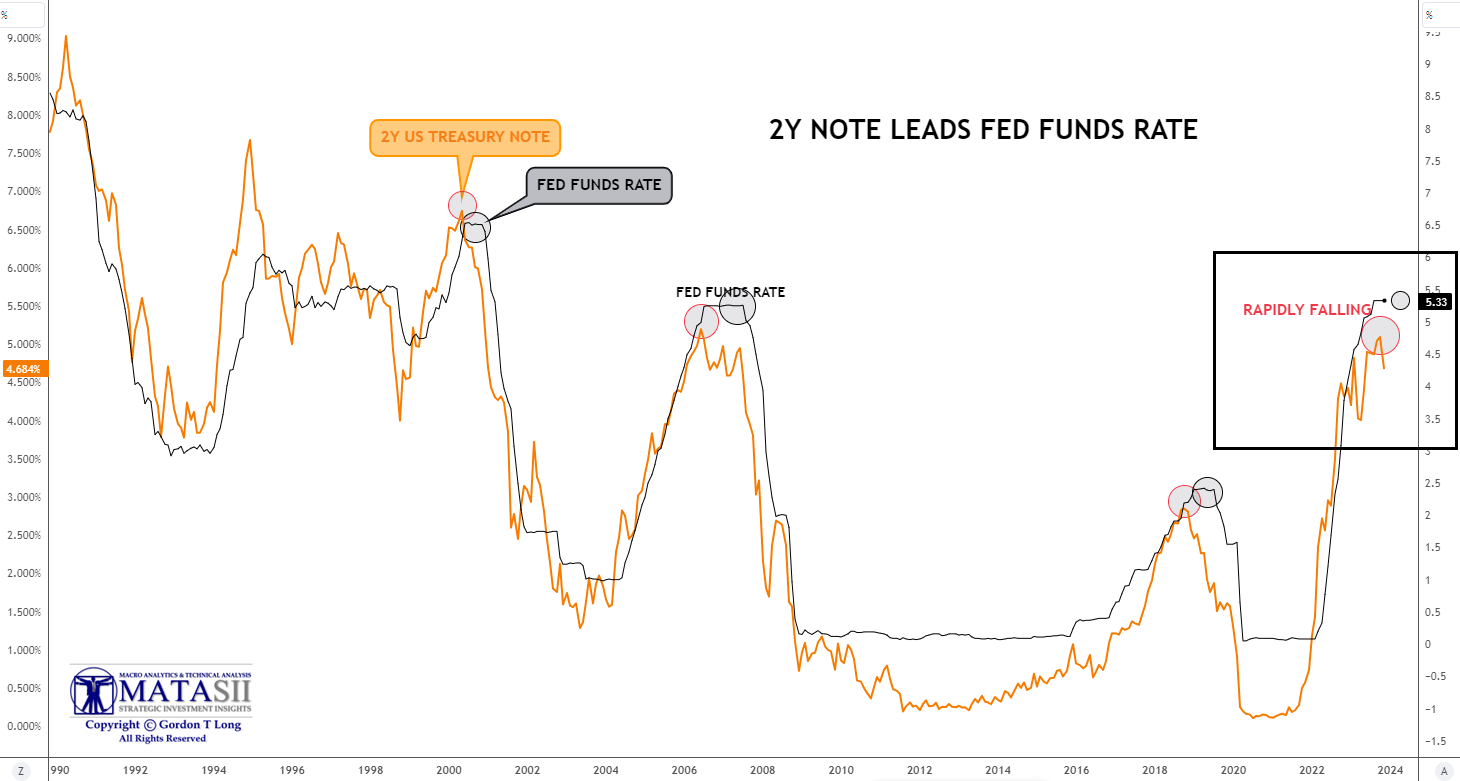
CHART BELOW
The 2Y minus the Fed Funds Rate has a clear history of showing when the markets are becoming unstable, which forces Fed Rate Reduction actions. This instability always follows previous rapid rate increases (dotted blacks lines), suggesting the rate increases are always overdone and the rate of reactive increase is itself the real underlying problem.
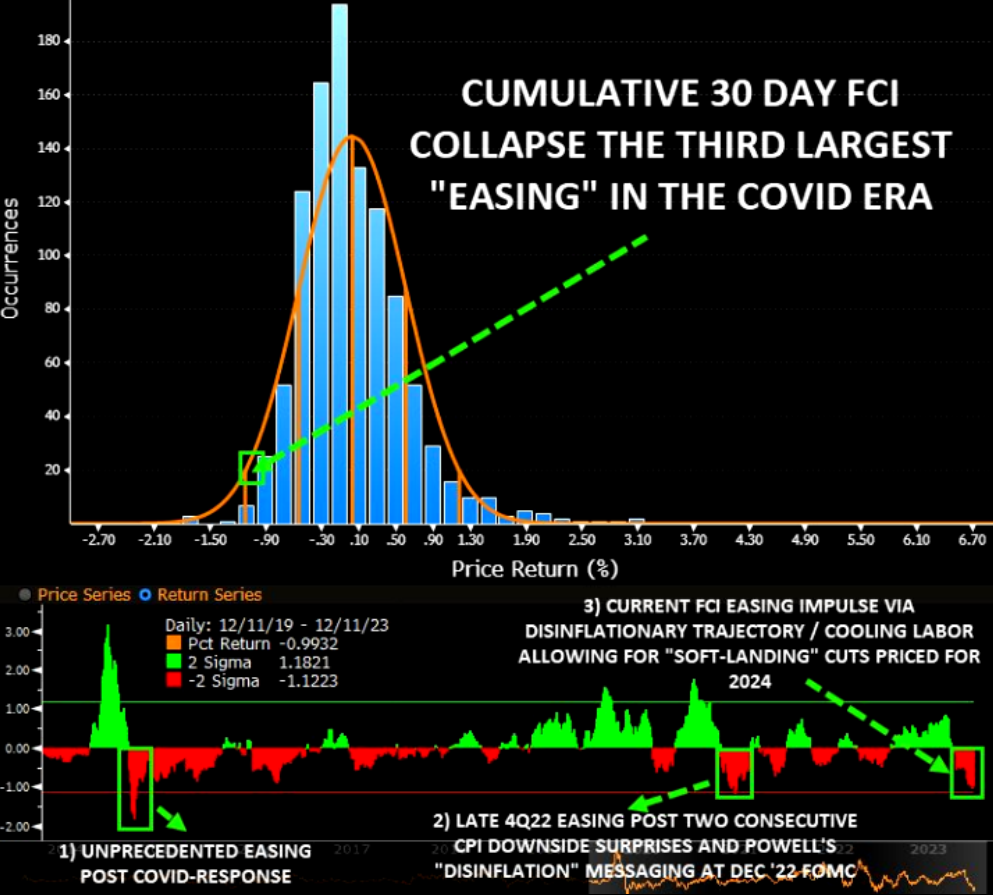
2- The Fed’s own Financial Conditions Index (FCI) is “Loose and Easy”.
Even prior to Powell’s Post FOMC “pressor”, the crash in the Financial Conditions Index (FCI) had been “epic”.
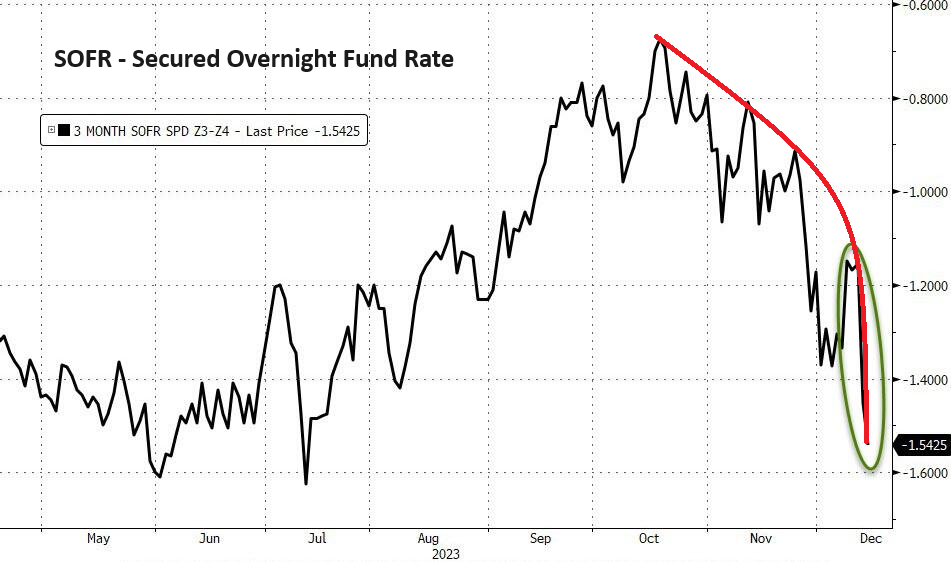
3- The SOFR Rate is steadily falling, impeding RRP Liquidity Flows into Treasury Bills.
The falling SOFR Rates have become misaligned with the RRP Rates.
 4- No One Any Longer Believes the Fed Narrative and Is Front Running It!
On so many fronts the Fed is losing credibility with the Financial Markets.
This stems from:
-
- Not identifying Inflation as the serious problem it became (by identifying it as “temporary”),
- To being much too late in raising the Fed Funds Rate,
- To mismatching credit tightening, liquidity and financial conditions
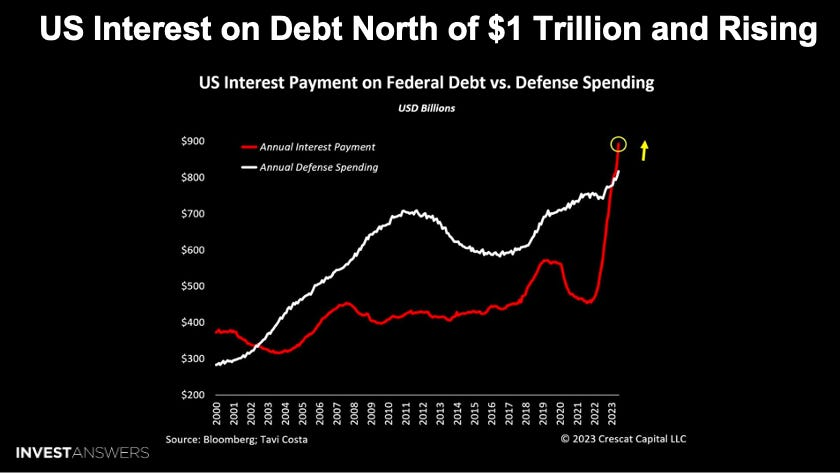 5- Interest Rates on the Federal Debt are now approaching a $1.4 T Annualized Rate.
As of November 2023, the average interest rate on the US debt is 2.97% for fiscal year 2023. This is up from 1.61% in 2021 and 2.07% in 2022. In 2023, newly issued ten-year Treasury Notes paid an average of 3.8%, compared to 1.1% in 2020 and 2.4% in 2019.
The annual cost of debt service is now over $1 trillion per year, up from $879.3 billion paid in interest in 2023. Estimates are that it is currently at an annualized rate of $1.4T.
According to the CBO, short-term interest rates are expected to fall to 2.5% by 2025 and average around 2.3% between 2025 and 2033. However, long-term rates are expected to remain around the current level over the next decade.
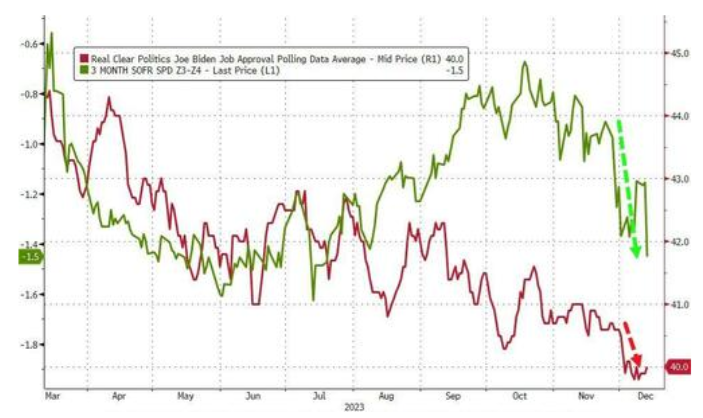 6- It is an Election Year and the incumbent President is in Trouble!
In the first half of the year we had recession fears which priced in an increasing number of rate cuts for next year (and saw Biden’s approval decline)
… then Aug-Oct we saw the economy appear to improve and rate-cuts were removed optimistically, but amid that optimism in the market, Biden’s approval rating continued to decline.
…then December hit and Biden approval collapsed… triggering markets to suddenly price in a massive rate-cut shift next year
Does make one wonder?
FACTS TO REMEMBER:
-
- The Last 3 Recessions started within a few months AFTER the Fed paused its Rising Fed Funds Interest Rate Cycle.
- Stocks Plunged within Months AFTER Interest Rate Cycles Topped.
- This Means the Stock Market Now sits in a dangerous place, as the Fed’s Latest Interest Rate Cycle has been aggressive and is mature.
The Fed’s current rising interest rate cycle looks similar to what they did just before the Great Recession of 2007 through 2009.
THE DIRECTION OF RATES – December Central Bank Monetary Policy Meetings
US FEDERAL RESERVE – 12/13/23 FOMC
 FOMC STATEMENT & SEP ANALYSIS:
The Fed left rates unchanged at 5.25-5.5%, made dovish tweaks to its statement, whilst indicating
a greater fall than many had expected to its Fed rate projections.
-
- Fed softened its guidance, whereby it stated that in determining the extent of “ANY” additional policy firming that may be appropriate to return inflation to 2% over time, the Committee will take into account the cumulative tightening of monetary policy, the lags with which monetary policy affects economic activity and inflation, and economic and financial developments.
- Fed also stated that inflation has eased over the past year but remains elevated, while it maintained its language that tighter financial and credit conditions for households and businesses are likely to weigh on economic activity, hiring and inflation.
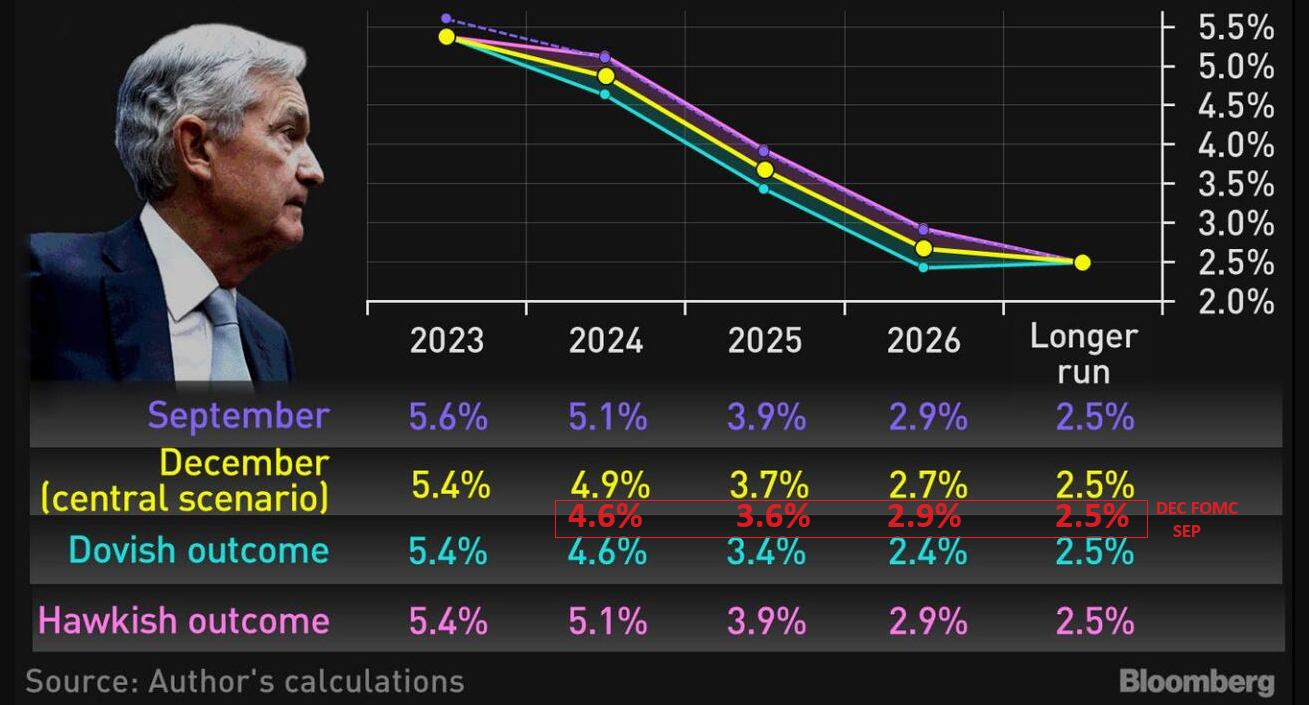
- The 2024 median rate dot was dropped to 4.6% from the prior 5.1%, beneath the analyst consensus 4.9%, indicating three cuts from current levels in 2024. The uncertainty remains high, however, with eight out of 19 officials forecasting rates above the median and five beneath it with a forecast range of 3.9–5.4%.
- The 2025 median Dot was dropped to 3.6% from 3.9%, whilst the 2026 and long run dots were left unchanged at 2.9% and 2.5%, respectively, bucking some expectations for an upward drift in the longer run (‘neutral’) estimate.
- The lower rate projections were reflective of faster progress than previously anticipated for inflation, with the Core PCE projections falling to 3.2% from 3.7% for 2023, to 2.4% from 2.6% in 2024, and to 2.2% from 2.3% for 2025.
- The unemployment rate forecasts were unchanged through 2025 (4.1% in both 2024 and 2025), while the 2024 GDP forecast nudged lower to 1.4% from 1.5% in 2024. The statement saw its tightening guidance softened, “in determining the extent of ANY [new word] additional policy firming that may be appropriate…”, whilst it also maintained its language added in November describing financial and credit conditions as tighter, despite some expectations that it would be removed after a rally in USTs and stocks since then.
- It noted growth had slowed from the strong pace in Q3 (prev. expanded at a strong pace in Q3), while it also added that inflation has eased over the past year, but maintained language it remains elevated.
POWELL PRESSER:
Chair Powell declared in his presser that the Fed believes policy is at or near its peak, caveating that the Fed has been surprised in the past and is prepared to tighten policy further if appropriate. He said policy will be kept restrictive until the Fed is confident it’s on the path to 2% inflation.
-
- He noted inflation has eased without a significant rise in unemployment, with the usual caveats that inflation is still too high with a long way to go to target. He echoed his Spelman College appearance by bringing in the line that policy has been moved “well into restrictive territory” into his prepared remarks.
- Powell still believes more tightening is in the pipeline via lags, saying the full effects of tightening “have yet to be felt”. He reiterated prior commentary on the labour market, saying it remains tight but coming into better balance, which policymakers expect to continue, putting further downward pressure on prices.
- Ahead of Core PCE on Dec 22nd, Powell said the Fed expects a print of 3.1% Y/Y, but added that the Fed thinks it will take some time to bring inflation down to the 2% target.
- “inflation has eased without a significant rise in unemployment but reiterated inflation is still too high and they are fully committed to returning inflation to 2%, while he reiterated that policy is well into restrictive territory and full effects of tightening are likely not yet felt with the Fed proceeding carefully, given how far they have come.”
- Powell also said the Fed believes the policy rate is at or near its peak and is prepared to tighten policy further if appropriate, while it will keep policy restrictive until the Fed is confident on the path to 2% inflation. Furthermore, he noted the Fed added the word “any” to show the Fed thought they are at or near the peak for rates and repeated that participants did not want to take the possibility of further hikes off the table.
Q&A:
-
- Powell announced that policymakers think they have done enough on rates. He said it is not likely the Fed will hike further, but caveated the Fed is not fully confident in that view yet.
- Meanwhile, when asked about rate cuts, Powell said they are beginning to come into view and are now a topic of discussion, saying the timing of cuts were also discussed (he said they were not even being considered at the November FOMC).
- He added that there was a general expectation that cuts would be a topic of conversation going forward.
- After Waller made the case the other week for cuts in the coming months if real rates continued drifting higher amid the decline in inflation, Powell said that the Fed is very conscious of real rates and it is a part of how it thinks about things.
- The Fed Chair made the point that the reason you would not wait to achieve 2% inflation to cut rates is that it would be too late for the economy, saying the Fed needs to reduce the restriction on the economy well before 2%, or they would overshoot.
- On a soft landing, Powell said he has always felt there was a possibility the economy could avert a recession while inflation came down, and so far that is what they are seeing, saying there is little basis for thinking the economy is in a recession right now. He added that while stronger growth will be good, it will mean it takes longer to get inflation down, suggesting the Fed could have to keep rates higher for longer or hike again due to above-trend growth.
- Powell noted they had seen real progress on core inflation, whilst saying they had made reasonable progress in non-housing services inflation. On the neutral rate, Powell said the Fed does not know if it has risen. And on the balance sheet, he said the runoff has been working pretty much as expected with reserves not at levels where they would need to slow or stop the runoff, highlighting that the policy rate and balance sheet are on different tracks.
-
- Fed Chair Powell stated in the Q&A that the Fed is still focused on the question of whether rates are high enough and it is not likely the Fed will hike further, but the Fed does not take that possibility off the table.
- Powell noted policymakers are thinking and talking about when it will be appropriate, while he stated as rate cuts begin to come into view it is now a topic of discussion.
- Powell also noted that many mentioned their rate forecasts and the Fed discussed the timing of rate cuts at the meeting, while there was a general expectation that rate cuts will be a topic of conversation going forward. Furthermore, he said discussion on when to cut rates is still ahead and they will decide very carefully, as well as noted that the reason you would not wait to 2% inflation to cut rates is it would be too late and would overshoot, while they need to reduce restriction on the economy well before 2%, as it takes a while for policy to get into the economy.
EUROPEAN CENTRAL BANK – 12/14/23 ECB
 As expected, the ECB opted to stand pat on rates for a second consecutive meeting with the main policy adjustment coming via the balance sheet.
-
- The Governing Council has decided that reinvestments under PEPP will run at current levels during H1, (vs. previous guidance of at least until the end of 2024), after which, it intends to reduce the PEPP portfolio by EUR 7.5bln per month on average.
- Elsewhere, the statement reiterated that “policy rates will be set at sufficiently restrictive levels for as long as necessary”.
- However, the policy statement omitted the prior judgement “inflation is still expected to stay too high for too long”.
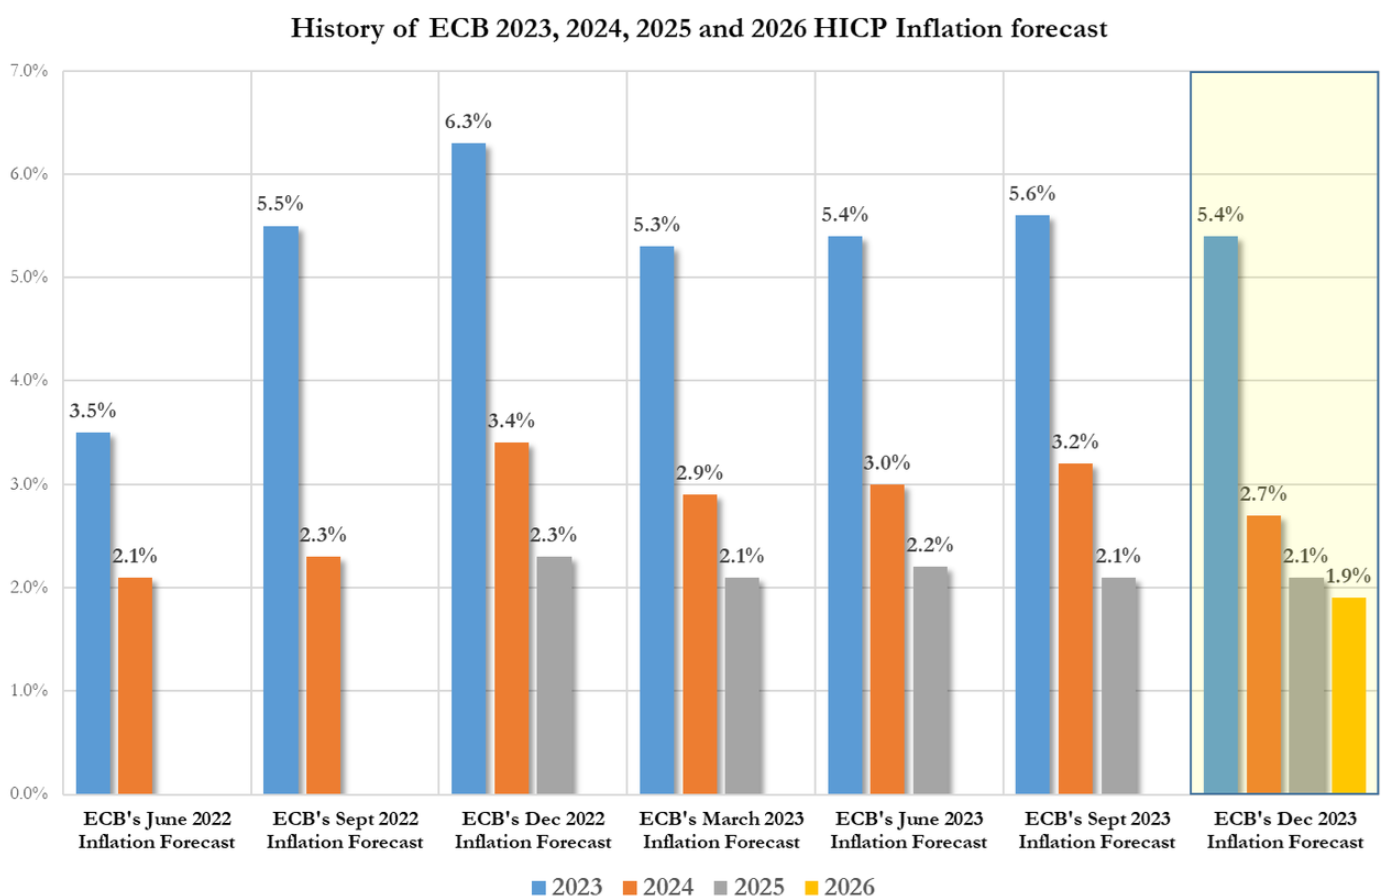
- The accompanying macro projections saw 2023 inflation downgraded to 5.4% from 5.6%, 2024 cut to 2.7% from 3.2% and 2025 held at 1.9%.
- Note, the forecasts drew criticism in some quarters given the November 23rd cut-off date, which has prompted suggestions that the 2024 core inflation projection of 2.7% is too high given recent economic developments.
- On the growth front, 2023 and 2024 projections were cut with GDP next year seen at just 0.8% with the 2025 forecast held steady at 1.5%.
- At the follow-up press conference, when questioned on the Bank’s plans for rate cuts next year, Lagarde stated the decisions will be data dependent, not time dependent, adding that policymakers will not let their guard down.
- Furthermore, Lagarde was clear in stating that the Governing Council did not discuss rate cuts this week with policy set for a “plateau of hold”.
- ECB president Lagarde also noted that the Bank will need to see more evidence on wage growth given that current data shows that wages are “not declining”.
- When questioned on the balance sheet, the President noted that there were differing views on PEPP whereby some governors wanted different tapering, earlier or later.
- Overall, market pricing has moved in a hawkish direction with a March hike now seen at circa 60% vs. 80% pre-announcement and 147bps of cuts seen by the end of next year vs. circa 160bps.
- In wake of the meeting, Bloomberg sources suggested the ECB is largely united on forecasting rate cuts later than what markets are expecting.
- The sources also added that officials do not expect to revise their stance before March, when the ECB will receive an update on the outlook for growth and inflation.
- ECB is largely united on forecasting rate cuts later than market bets, according to Bloomberg.
BANK OF ENGLAND – 12/14/23 BOE
 As expected, the MPC opted to stand pat on rates for a third consecutive meeting via a 6-3 vote with hawkish dissent once again from Greene, Haskel and Mann.
-
- The decision to stand pat on rates was based on the judgement that although “some of the news in key data had been to the downside since the MPC’s previous decision, economic developments had been relatively limited overall”.
- Overall, the key takeaway from the release, however, was the decision to maintain the phrase that policy will need to be restrictive for an “extended” period of time; some desks have touted an outside chance of a softening of this language.
- Furthermore, it remains the case that further tightening would be required if there were evidence of more persistent inflation pressures.
- Indeed, some of the language within the minutes leaned hawkishly by noting that “it was too early to conclude that services price inflation and pay growth were on a firmly downward path.”
- That being said, the inflation path was somewhat lower than projected in November, reflecting softer energy prices.
- Elsewhere, the MPC judges that the November Fiscal Plan will boost GDP by 0.25% in the coming years.
- In response to the announcement, pricing has shifted hawkishly from 114bps of cuts priced across 2024 to 107bps, with the first cut pushed back to June from May beforehand, with a May cut priced at 80% implied probability and a March cut falling to less than 30% implied vs 40%. ING concludes that it expects wage growth and services inflation to fall to 4% next year, setting the BoE up for an August rate reduction.
SWISS NATIONAL BANK – 12/14/23 SNB
Largely as expected from the SNB with the key rate maintained at 1.75% and the emphasis on selling foreign currency removed:
-
- Most pertinently, the inflation forecasts have seen relatively modest downward adjustments and while this does see CPI within the 0-2% band for 2024 as a whole, inflation is still seen rising in Q2/Q3-2024; though, this is now to just the top of the band, rather than September’s guidance for it to eclipse it.
- Overall, the statement still holds the assessment that “uncertainty remains high” around inflation and as such has not guided us towards the direction of the next move, merely stating they remain ready to adjust policy as necessary.
- Given this, participants will remain focused on upcoming inflation prints for insight into the development of the rental rate of inflation.
- From the press conference, Chairman Jordan underscored the FX tweak and more pertinently said that December’s discussion did not cover rate reductions and that further ahead the current forecasts do not see any tightening. In short, the SNB is barring a marked upward shock seemingly at the policy peak and the timing for a first rate-cut will likely be driven by the assessment/observation of inflation across Q2/Q3-2024, where it is forecast to rise to 2.0% once again.
OTHER CENTRAL BANKS – 12/14/23
NORGES BANK
Norges Bank defied consensus by triggering the hike that they flagged in November’s meeting as “likely” to occur in December.
-
- However, consensus was for unchanged, given the development of inflation and growth since then and the optionality at that meeting to leave rates unchanged if “the Committee becomes more assured that underlying inflation is on the decline”.
- December’s hike appears to have been spurred by the NOK; (marked recent currency depreciation was the sole factor in favor of a hike in the run-up to the announcement). Interestingly, the repo path and statement do not rule out further tightening.
- However, given the recent pivot from the Fed and pronounced market pricing for global easing, today’s 4.50% rate is likely the peak. The subsequent press conference from Governor Bache added little.
BANXICO
The Banxico left rates unchanged as expected at 11.25%, however, it was received hawkishly by giving away little signal on future rate cuts as it maintained guidance that rates need to stay at the current level for some time.
-
- It maintained its view that inflation risks are biased to the upside, and it raised several of its inflation forecasts, with the 2024 headline and core inflation being lifted, as was the Q4 core inflation view.
- The decision was unanimous.
- The statement also acknowledged that headline inflation increased slightly, but core inflation continued to decrease and noted the disinflation process is expected to continue. But current forecasts incorporate a more gradual decline in both food merchandise inflation and services inflation.
- Banxico acknowledged that, for this reason, their forecasts for headline and core inflation have been revised upwards for some quarters.
- Nonetheless, Banxico is expected to start cutting rates, perhaps in Q1 2024, joining LatAm peers and also after the Dovish Fed twist on Wednesday.
- However, when Banxico officials have spoken on rate cuts, many have alluded to it being non-consecutive, and only gradual – the minutes on Jan 4th will be eyed for more clues on the timing of rate cuts.
GLOBAL ECONOMIC INDICATORS: What This Week’s Key Global Economic Releases Tell Us
CONSUMER PRICE INDEX – CPI
-
- US CPI MM (Nov) 0.1% vs Exp. 0.0% (Prev. 0.0%)
- US CPI YY (Nov) 3.1% vs. Exp. 3.1% (Prev. 3.2%)
Overall, CPI was in line with expectations.
-
- Headline M/M rose 0.1%, a touch above the expected and prior 0.0% print while the Y/Y rose 3.1%, in line with forecasts and down from the prior 3.2%. Core M/M was in line at 0.3%, accelerating marginally from the prior 0.2% while the Y/Y rose 4.0%, in line with the prior and forecast. Looking into the breakdown, the index for shelter continued to rise in November, +0.4% (prev. +0.3%). Meanwhile used car prices also surged 1.6% in November, despite five months of consecutive decreases. Pantheon highlights the rise in used car sales and notes they have to expect a renewed sustained decline over the next few months. The consultancy also notes that the biggest contribution to the core was rents, but the consultancy does note that the rate of increase is slowing. The data will do little to alter the Fed’s thinking for the December meeting, but it will be digested to help with their Dot Plot forecasts. However, likely, inflation is still too high for the Fed to consider declaring victory just yet, and they may opt to fight back against the aggressive cuts being priced in by the market.
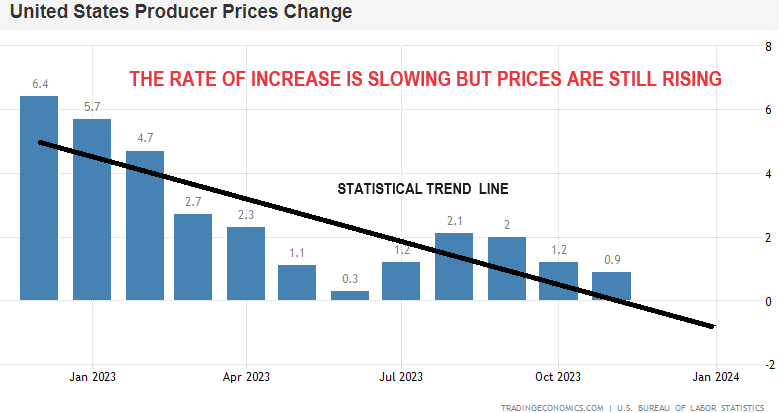 PRODUCER PRICE INDEX – PPI
-
- US PPI Final Demand YY (Nov) 0.9% vs. Exp. 1.0% (Prev. 1.3%, Rev. 1.2%)
- US PPI Ex. Food/Energy YY (Nov) 2.0% vs. Exp. 2.2% (Prev. 2.4%)
PPI for November was unchanged M/M, despite expectations for a 0.1% gain with the prior revised up to -0.4% from -0.5%. Y/Y PPI rose 0.9%, beneath the 1.0% forecast while the prior was revised down to 1.2% from 1.3%.
-
- Looking into the details, both the index for final demand goods and services were unchanged.
- The unchanged good prices followed the 1.4% drop in October while the services prices matched October’s pace.
- In goods, price increases of 0.6% for final demand foods and 0.2% for final demand goods less foods and energy offset a 1.2% decrease in the index for final demand energy.
- Core PPI (ex food and energy) was cooler than expected with M/M unchanged (exp. +0.2%), matching the prior month pace.
- The core Y/Y eased to 2.0% from 2.3% (revised down from 2.4%) and beneath the 2.0% forecast.
- The Super Core (ex food, energy and trade) maintained a 0.1% gain in November while the Y/Y eased to 2.5% from 2.8%, which was revised down from 2.9%.
- Overall a dovish report with PPI beneath expectations and it was more dovish than the in-line CPI released on Tuesday.
- With PCE due 22nd December, and now with CPI and PPI behind us, Fed Chair Powell had stated that he believes some members did update their SEP forecasts in the wake of both CPI and PPI. He even acknowledged the Fed expect the November PCE report to show Core PCE prices rose 3.1%.
- Meanwhile, Pantheon Macroeconomics “estimate that the core PCE deflator for November will rise by just 0.13%, pushing the Y/Y rate down to 3.3%.”
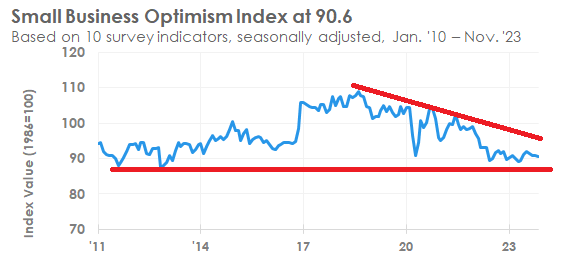 NFIB – SMALL BUSINESS OPTIMISM
NFIB’s Small Business Optimism Index decreased 0.1 point in November to 90.6, which marks the 23rd consecutive month below the 50-year average of 98.
Twenty-two percent of owners reported that inflation was their single most important problem in operating their business, unchanged from October but 10 points lower than this time last year.
KEY FINDINGS
-
- Owners expecting better business conditions over the next six months increased one point from October to a net negative 42% seasonally adjusted.
- A net negative 17% of all owners (seasonally adjusted) reported higher nominal sales in the past three months, unchanged from October and the lowest reading since July 2020.
- Forty percent (seasonally adjusted) of owners reported job openings that were hard to fill, down three points.
- Seasonally adjusted, a net 30% of owners plan to raise compensation in the next three months, up six points from October and the highest since December 2021.
- The net percent of owners raising average selling prices decreased five points from October to a net 25% (seasonally adjusted).
- The net percent of owners who expect real sales to be higher increased two points from October to a net negative 8% (seasonally adjusted).
GLOBAL MACRO
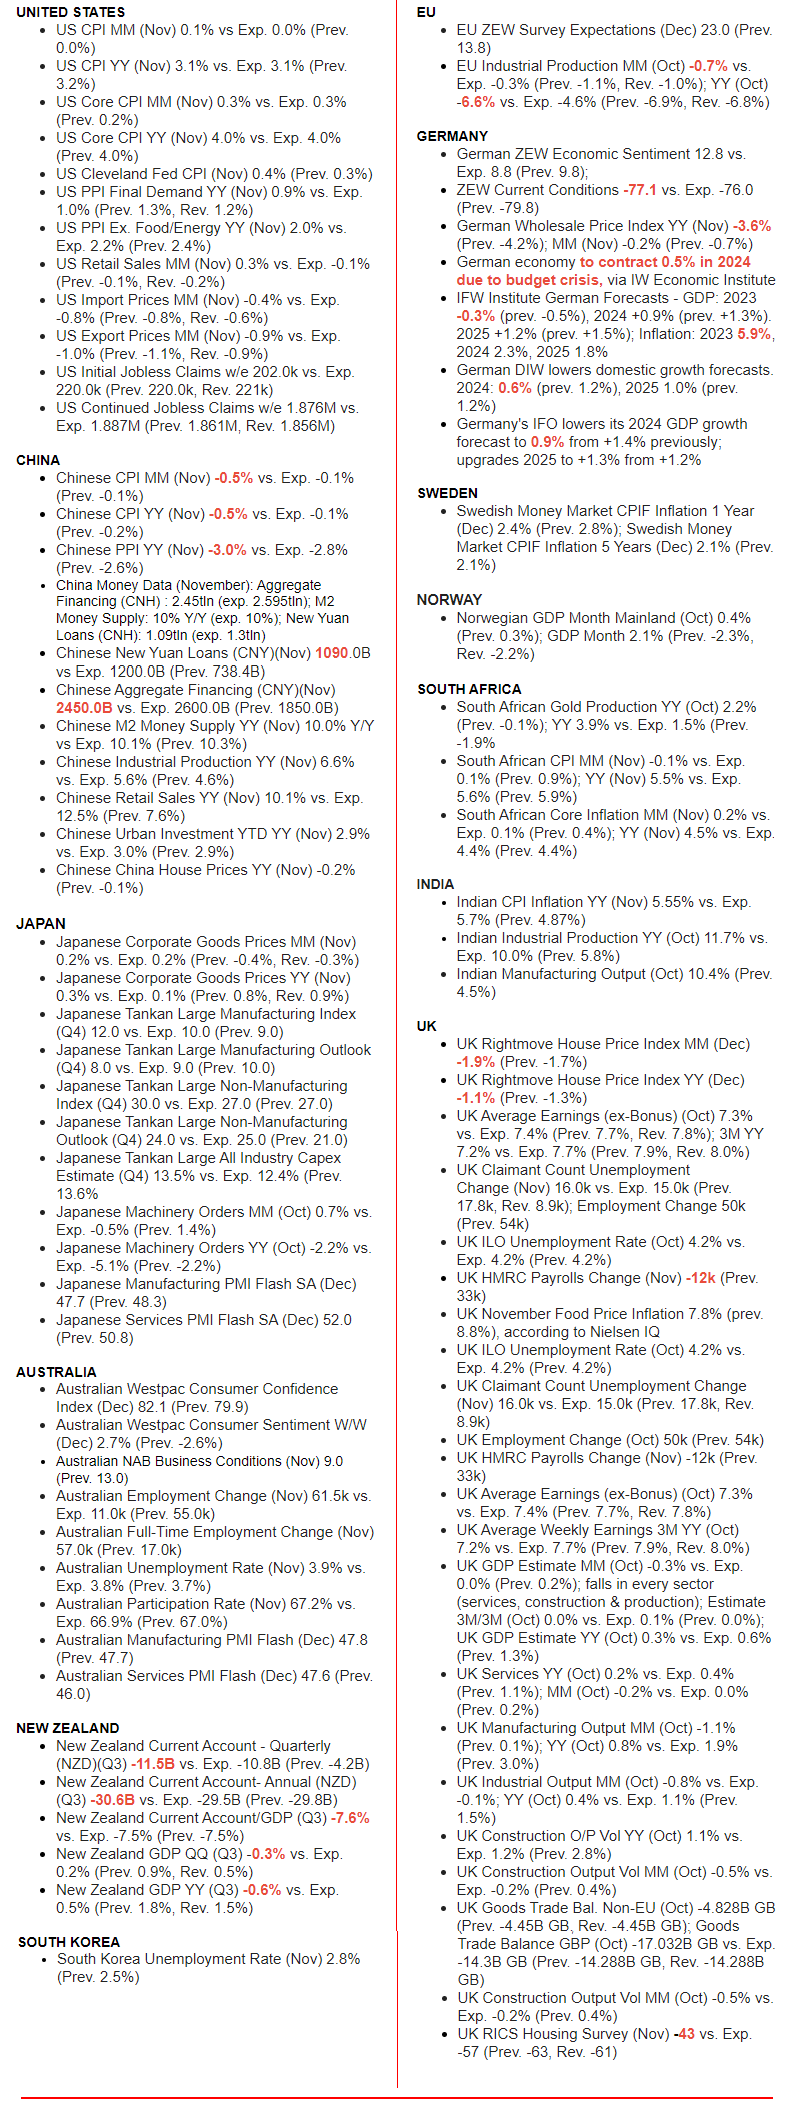
WHAT DOES YOUR SCAN OF THE DATA BELOW TELL YOU? – THE MEDIA AVOIDS BAD NEWS!
We present the data in a way you can quickly see what is happening.
THIS WEEK WE SAW
Exp=Expectations, Rev=Revision, Prev=Previous
DEVELOPMENTS TO WATCH
GASLIGHTING INFLATION: America Needs a Clearer Explanation of What Inflation IS and How HIGH It Really IS!
INFLATION IS: Too Much Money Chasing Too Few Goods
HOW HIGH IS IT? Up 18.5% In Three Years As Measured By CPI. Inflation is not falling. It is the rate of increase that is falling.
WHY HAS IT HAPPENED? We pushed $13.59T of total debt Into the Economy while Economic Growth was only $5.18. To further make matters worse, we financed Government Spending of $5.15T more than the revenue took In over the same three years.
ECONOMIC GROWTH
2020: $21,06T
2021: $23.32T Increase= 2.26T
2022: $25.46T Increase= 2.14T
2023: $26.24T Increase= 0.78T
======
= 5.18T
INCREASED SIZE OF TOTAL US DEBT
CORPORATE
2021: $875B
2022: $511B
2023: $800B
= 2.186T
GOVERNMENT
2021: 1.483T
2022: 2.500T
2023: 2.772T
= 8.755T
HOUSEHOLD
2021: 0.200T
2022: 1.050T
2023: 1.400T
= 2.650T
========
= 13.591T
ECONOMIC GROWTH = 5.18T, DEBT GROWTH = 13.59T or 2.65X as large
GOVERNMENT DEFICIT (REVENUE – SPENDING)
2021: 2.77T
2022: 1.38T
2023: 1.70T
=======
= 5.15T
GOVERNMENT DEFICIT (REVENUE MINUS SPENDING) = 5.15T
A COMPLETE LACK OF ACCOUNTABILITY & RESPONSIBILITY: The meaningless, “comforting talk” and political deflection from those who actually created the problem!
-
- US President Biden said CPI shows their continued progress against inflation and he is aware too many are finding things unaffordable.
- US Treasury Secretary Yellen said inflation is meaningfully coming down and sees no reason why inflation should not come down to the Fed’s target. Yellen said there is no evidence that inflation is becoming ingrained or that there is a wage-price spiral, while she added that rising real rates could impact the Fed decision on the rate path, according to WSJ.
FED FUNDS RATE: The Fed Has Lost Control of Its Own Financial Conditions Index (FCI)
-
- No One Believes the Fed and the market is now “front running” the obvious outcome.
- The dramatic easing of financial conditions has erased all of The Fed’s rate-hike pressures since June 2022.
Is that really what The Fed wants? No! But they no longer have control because the market doesn’t believe them!
FOMO & GREED REACT TO THE FED’S FOMC
FALLING YIELDS AND SEASONALS DICTATING MARKET DIRECTION
Click All Charts to Enlarge
1 – SITUATIONAL ANALYSIS
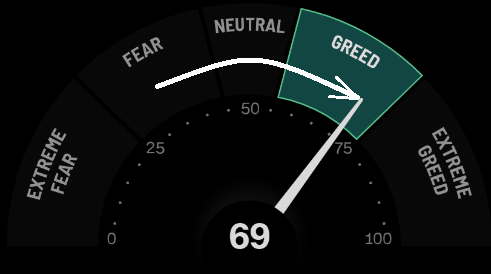 Powell “pivoted” and everything changed (bonds, stocks, rate-cut expectations, gold, oil, and crypto) as the dollar dumped. Greed and FOMO took over (chart right). The result was:
-
- A $2 trillion rise in the value of US aggregate bonds and stocks in the last three days of the week and over $7 trillion since the start of November (the prior FOMC).
- World equity and bond markets added $4 trillion this week alone, and are up over $15 trillion since the November FOMC.
- The S&P 500 is up 7 weeks in a row – its longest winning streak in six years (Nov 2017).
- 49% of the S&P 500 members are ‘overbought’ after Powell “rang the bell” this week on rates. That is the most ‘overbought’ breadth since Feb 1991.
- It only took 48 days for the small-cap Russell 2,000 to go from 52-week low to 52-week high; the shortest turnaround in the index’s 45+ year history.
- Nasdaq closed at a record high for the first time since Nov 2021,
- The 10Y Yield fell below (and held below) 4.00% and 30Y tumbled down to within a tick of the same level today – the lowest level since 7/31.
2 – FUNDAMENTAL ANALYSIS
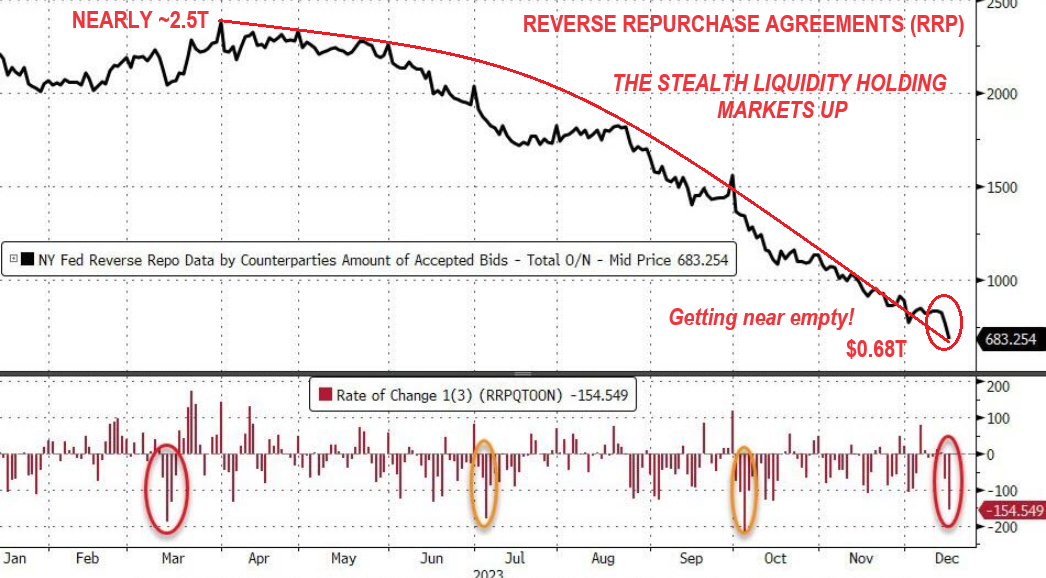 CREDIT & STEALTH LIQUIDITY
The Fed’s reverse repo facility saw over $150BN drained from it in the last 3 days of the week since the FOMC Meeting. It is getting towards “Empty”!
Outside of quarter-end liquidity needs is the largest drawdown since the SVB crisis in March.
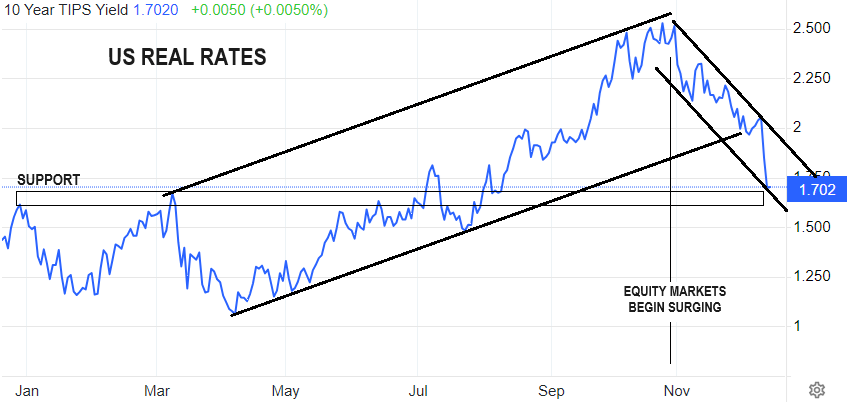 PLUMMETING REAL YIELDS
The decline in US real interest rates (chart right) include:
- Slowing Global Economic Growth
- Increasing Global demand for safe and liquid assets
- Slowing US Productivity Growth
- Lower capital-goods prices.
FINANCIAL CONDITIONS INDEX
Markets tend to outperform and even become “excessive” when financial conditions are too “easy”. We are now TOO EASY! We have been since easing began abruptly at the end of October??? Is it a result of falling Real Rates or did something also break associated within the plumbing of US debt funding?
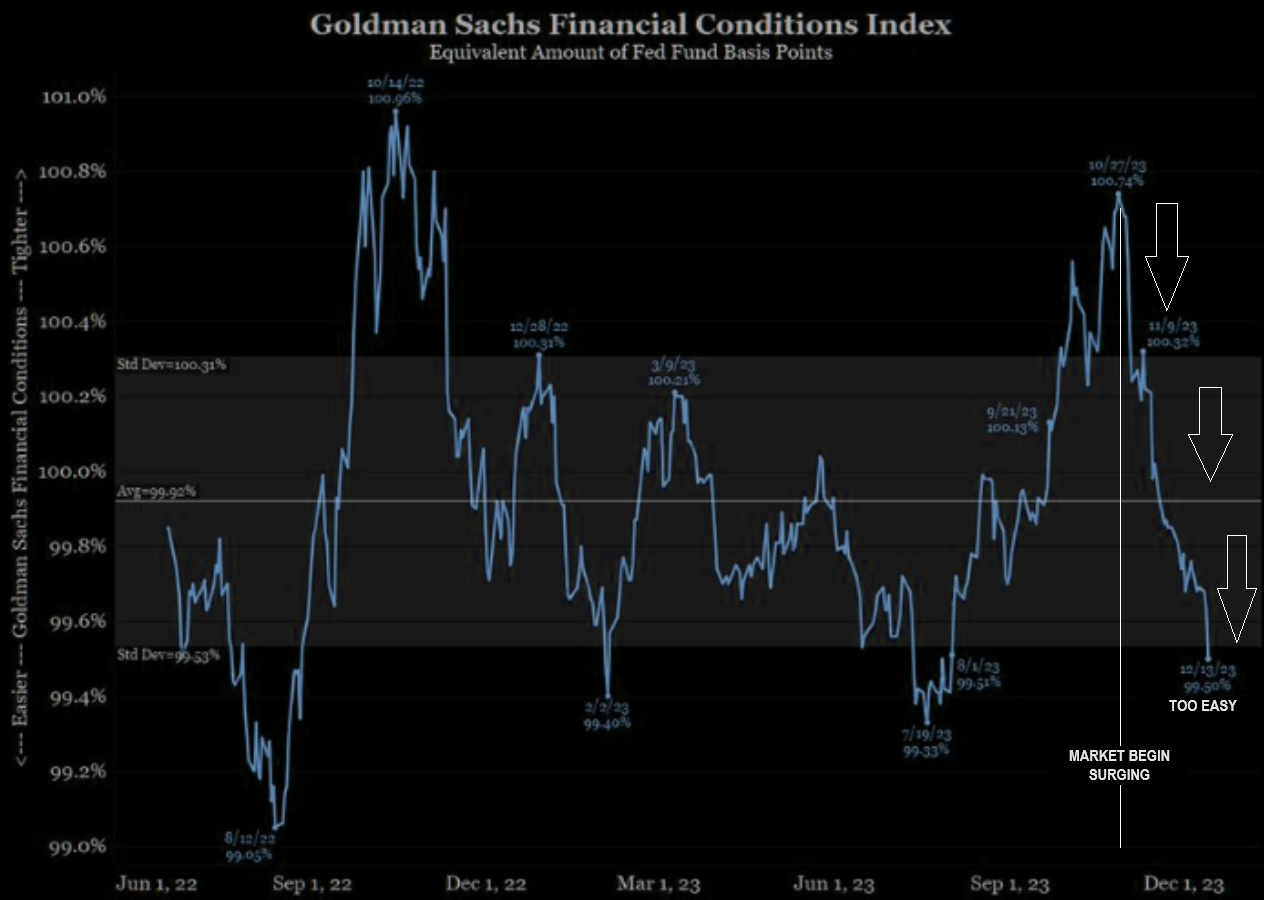
THESE ARE NOT SIGNS OF STABILITY, BUT RATHER EMERGING INSTABILITY (OR PANIC?)
3 – TECHNICAL ANALYSIS
-
- As Rates fall Stocks Normally Rise – Yields have been dropping and stocks have been rising.
- When the Dollar Weakens, Stocks Normally Rise – Dollar has been Weakening and Stocks have been Rising,
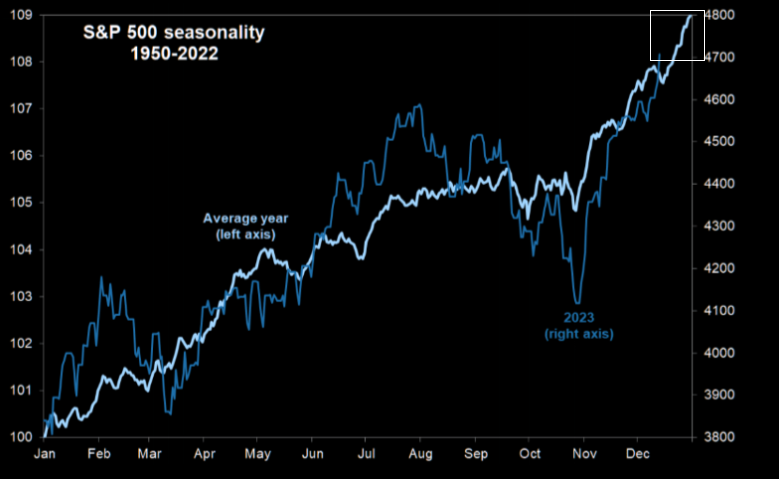
- Year End Stock Seasonals are Historically Strong – Stocks have been Strong.
- Markets are pricing in the last rate hike to have been July, the first rate cut to begin in July, to see 75 basis cuts in 2024 and a soft landing Recession to have begun no later than mid-year 2024.
BOND MARKET
 We start with the Bond Market, because that is what is currently driving the equity markets.
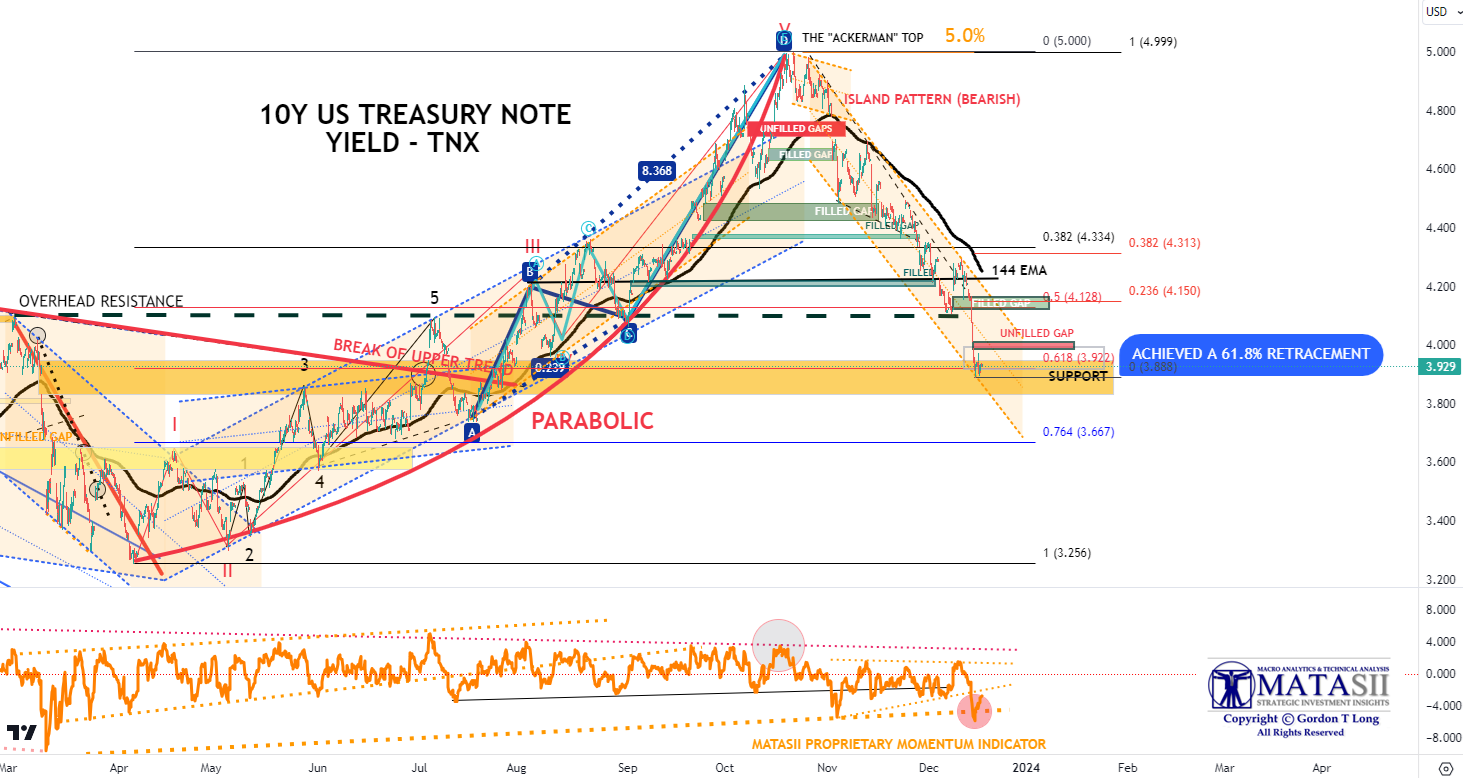
10Y US TREASURY YIELD
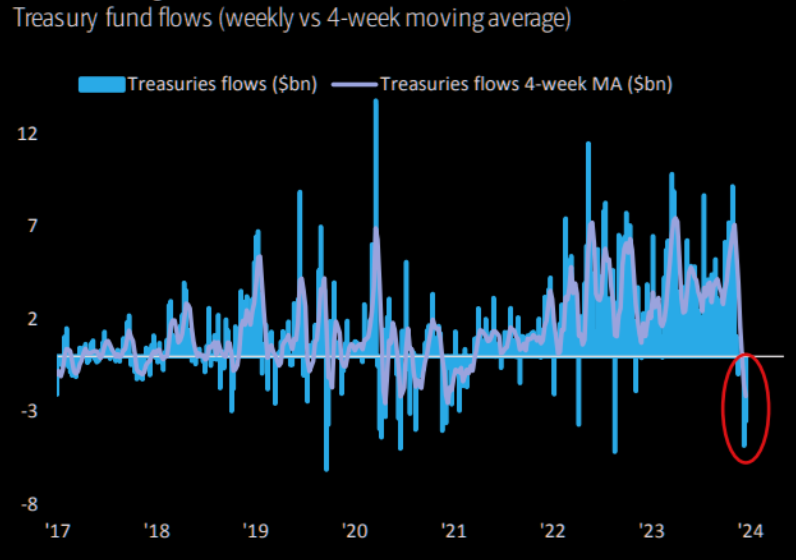
Though Treasury Yields have continued to fall (Prices rise) we have just witnessed the biggest 2-week outflow from Treasuries since June ’20 as Bond investors begin taking profits.
We are anchored by an expectation that the Fed bottoms at 3% when it completes this rate cutting cycle. We expect a fair value 100bp yield curve on top of that giving us a fair value at ~4% for the 10Y Treasury Yield.
We therefore suspect we might comfortably head towards 3.5% in 2024 as an overshoot. Enjoy the overshoot while it lasts, (and it will persist for a quarter or two), but don’t forget that it is an overshoot.
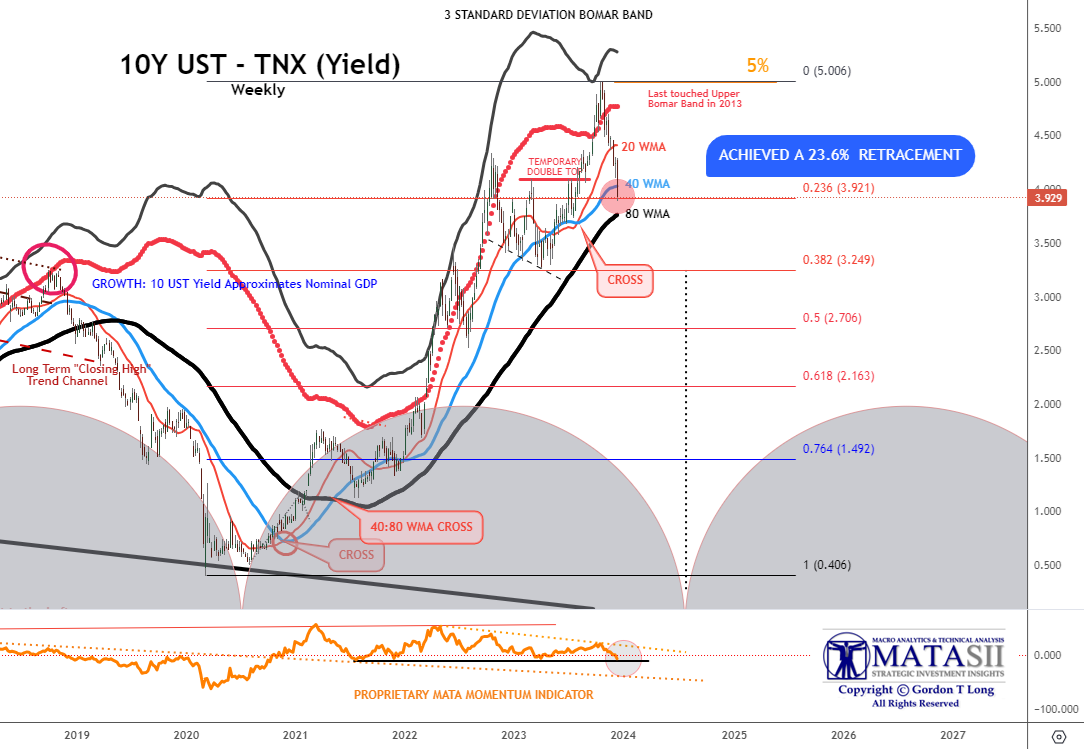
WEEKLY 10Y TREASURY YIELD – ‘TNX’
The TNX closed at exactly a 23.6% retracement of the total rise in yields since March 2020. This was slightly below the 40 WMA and above the 80 WMA.
YOUR DESKTOP / TABLET / PHONE ANNOTATED CHART
Macro Analytics Chart Above: SUBSCRIBER LINK
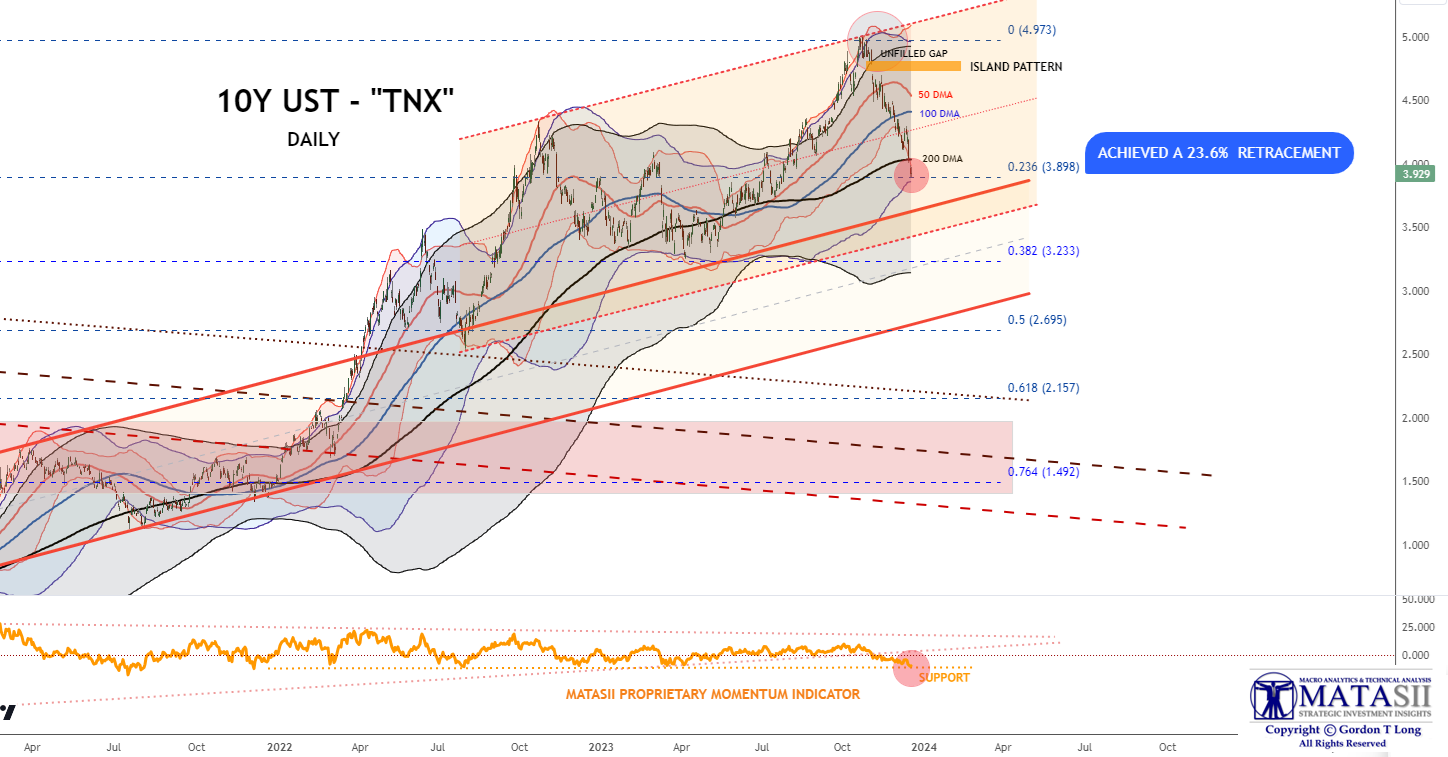
DAILY 10Y TREASURY YIELD – ‘TNX’
The Daily TNX closed on precisely the 200 DMA as shown below bt the dark black line.
YOUR DESKTOP / TABLET / PHONE ANNOTATED CHART
Macro Analytics Chart Above: SUBSCRIBER LINK
HOURLY 10Y TREASURY YIELD – ‘TNX’
The Hourly TNX closed on precisely 61.8% retracement of the rise in yield from April of this year to its high in October.
YOUR DESKTOP / TABLET / PHONE ANNOTATED CHART
Macro Analytics Chart Above: SUBSCRIBER LINK
EQUITY MARKETS
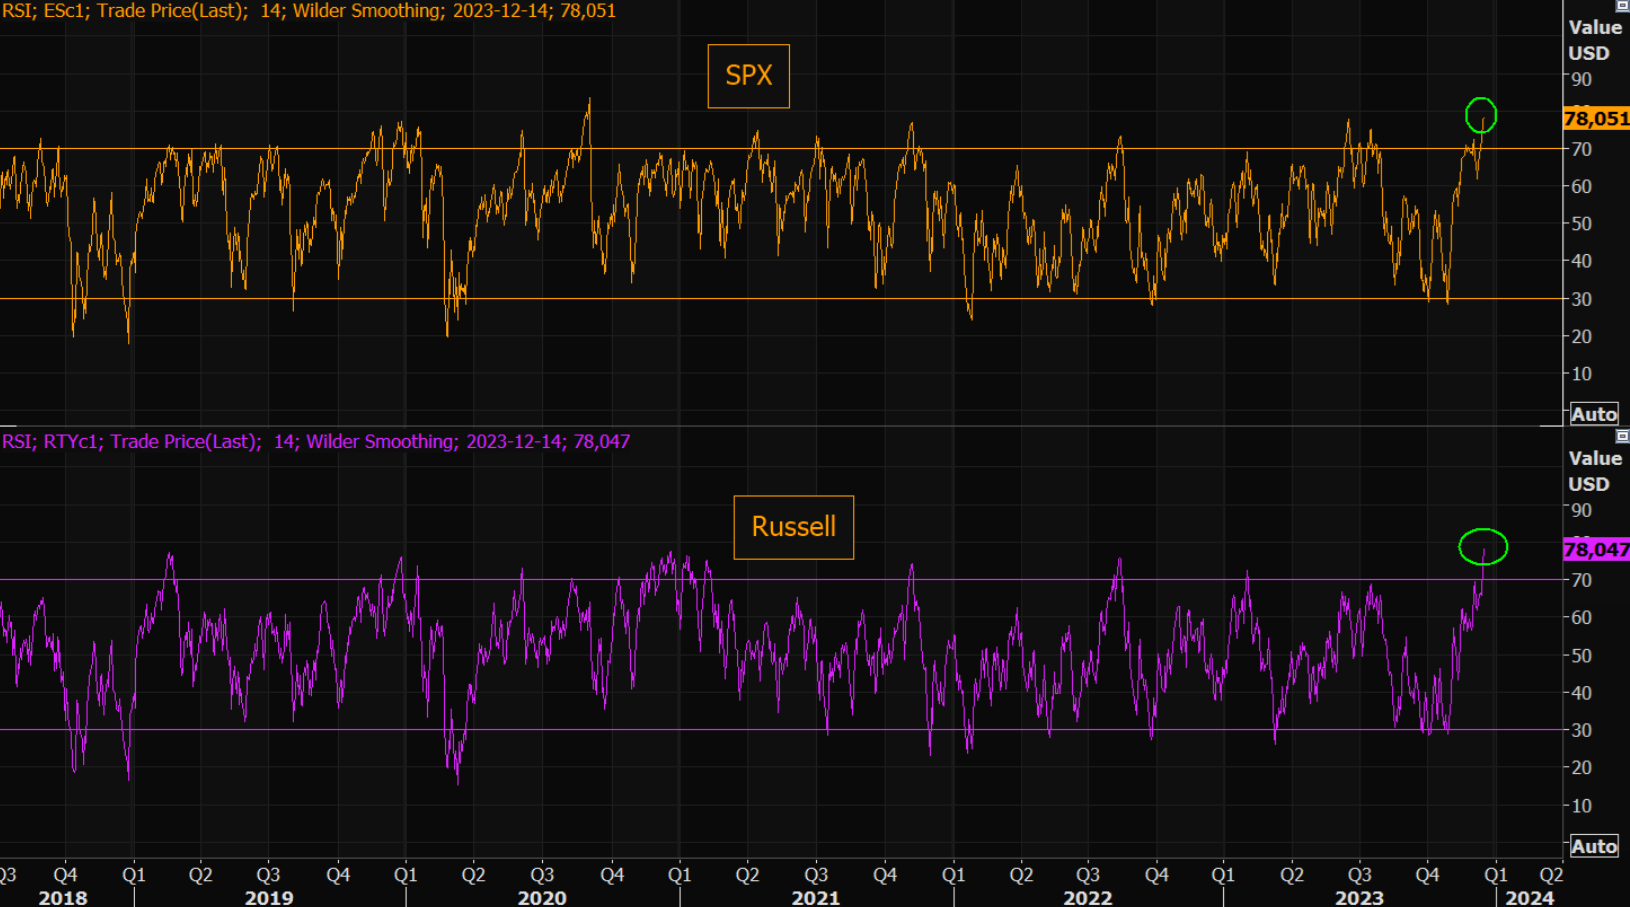 We still have not reached extreme greed (initial chart – top right). Buying extreme fear and shorting extreme greed has worked well in 2023!
Though markets are overbought (chart right), historic stock seasonality suggests (chart below) we may still have some more to potentially run.
This market presently has the FOMO (Fear Of Missing Out) attitude to squeeze out the very last drop! Maybe even overshoot / outperform if yields/dollar show further weakness into year end.
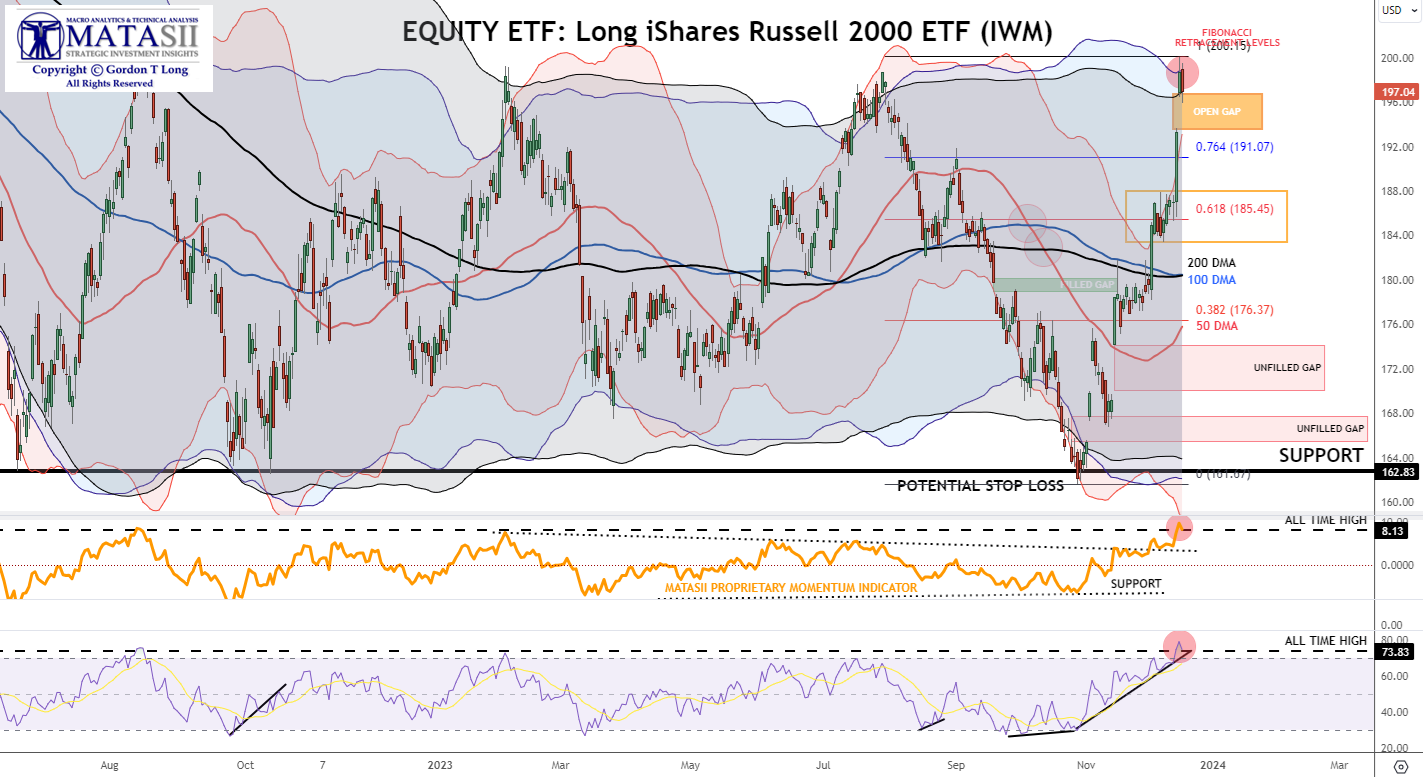
IWM – RUSSELL 2000 ETF – DAILY
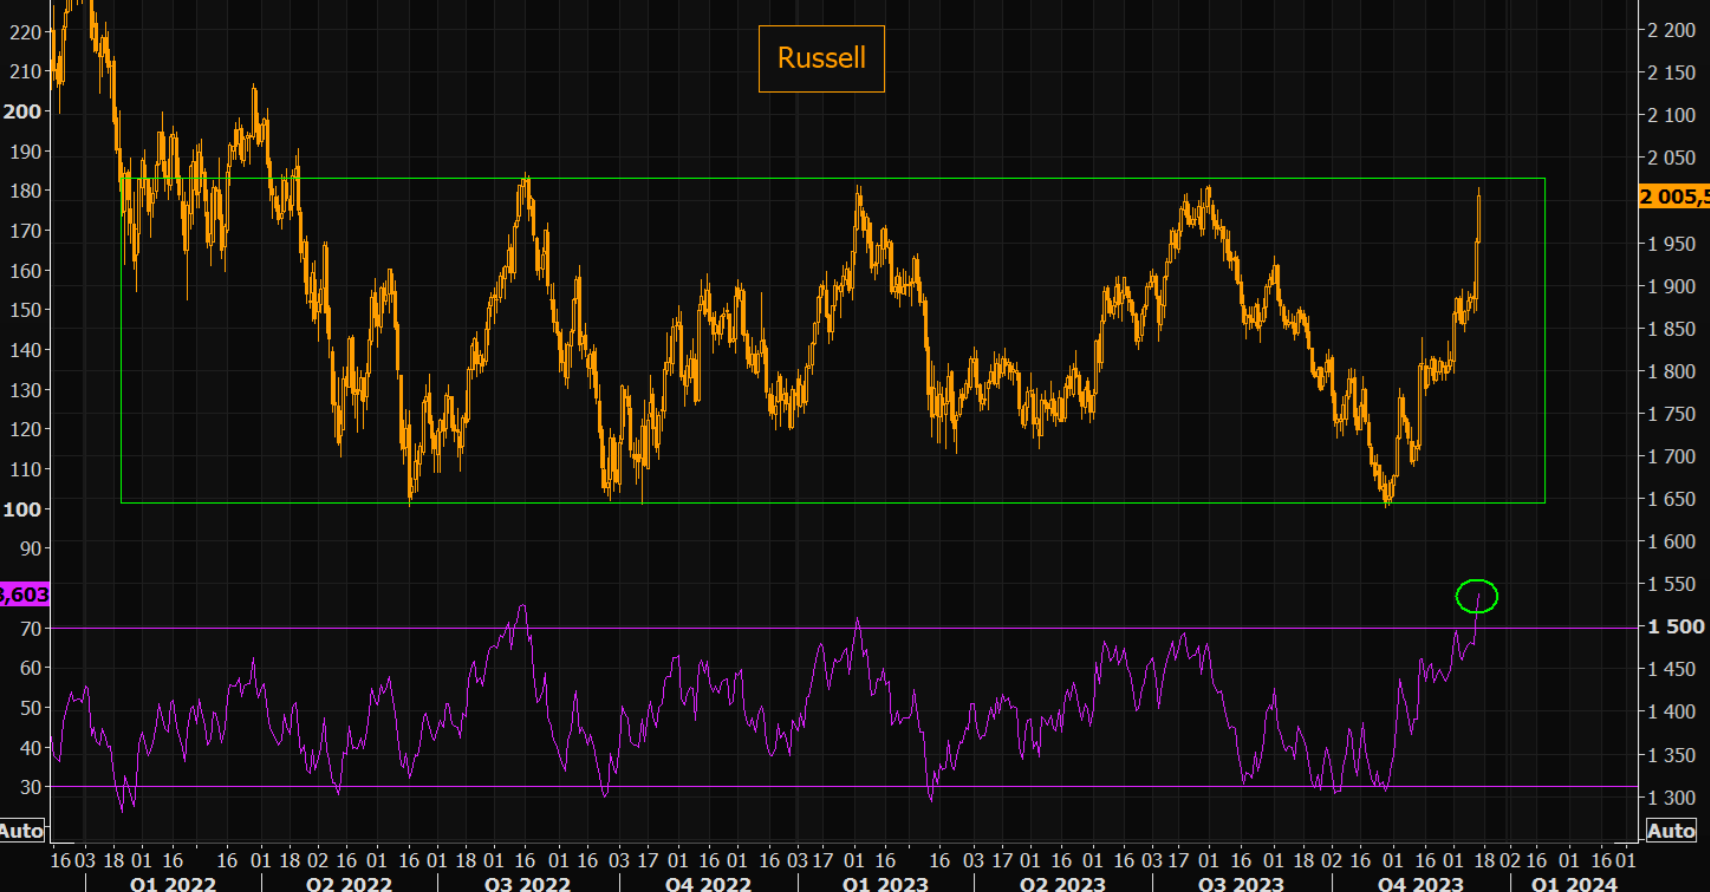 The “IWM” is near or at a near term top. A close of the open gap just below Friday’s close is to be expected. The Russell has been a major market gainer since we first started focusing on it in these technical briefs.
CHART RIGHT: Breaking a Quadruple Top might take a little consolidate first, considering how far and fast the IWM has come. Russell is up some 22% from the most recent lows. The Russell 2000 has been recently beating NASDAQ significantly as the market finally begins broadens its breadth.
YOUR DESKTOP / TABLET / PHONE ANNOTATED CHART
Macro Analytics Chart Above: SUBSCRIBER LINK
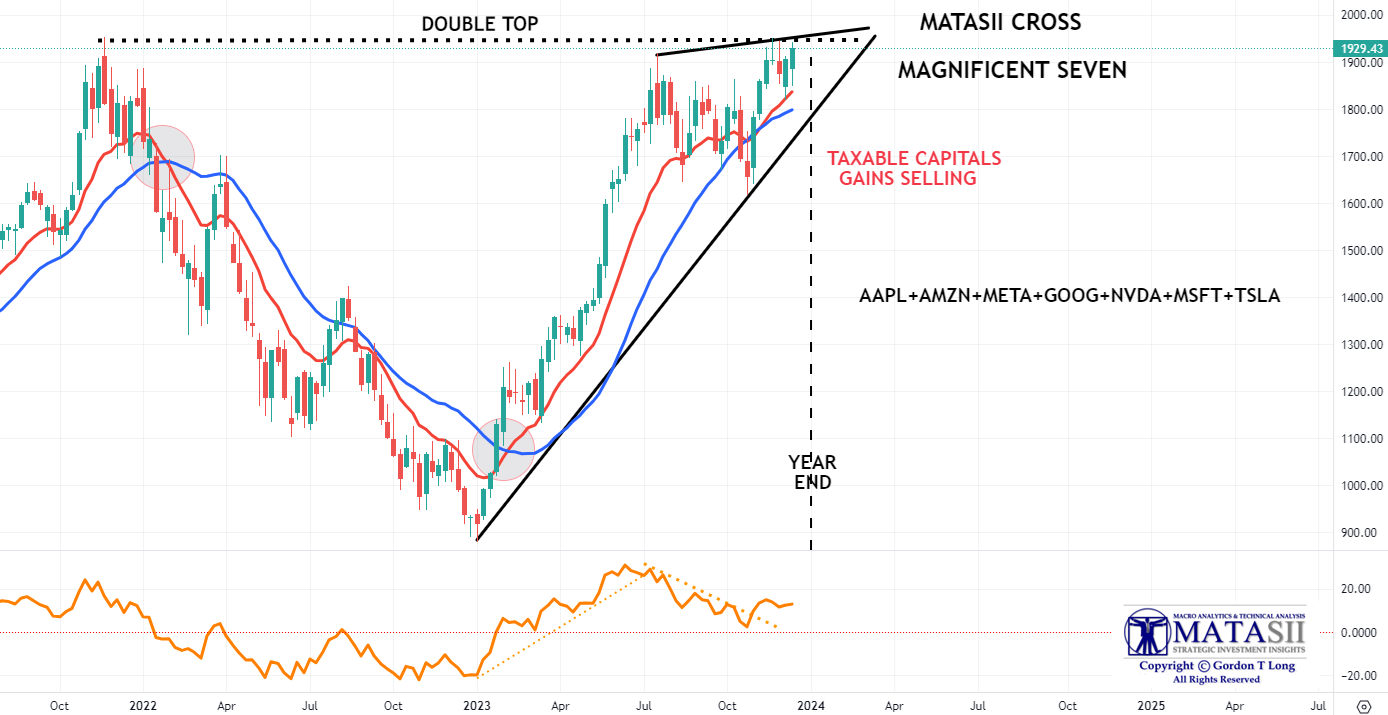
MAGNIFICENT SEVEN – DAILY
We show the MATASII CROSS in the chart below of the “Magnificent Seven”, which is still on a “BUY” signal but a clear ending diagonal (in black) appears to being put in. We expect Capital Gains selling in January on this group of stellar performers in 2023.which the ending diagonal pattern may be reflecting.
YOUR DESKTOP / TABLET / PHONE ANNOTATED CHART
Macro Analytics Chart Above: SUBSCRIBER LINK
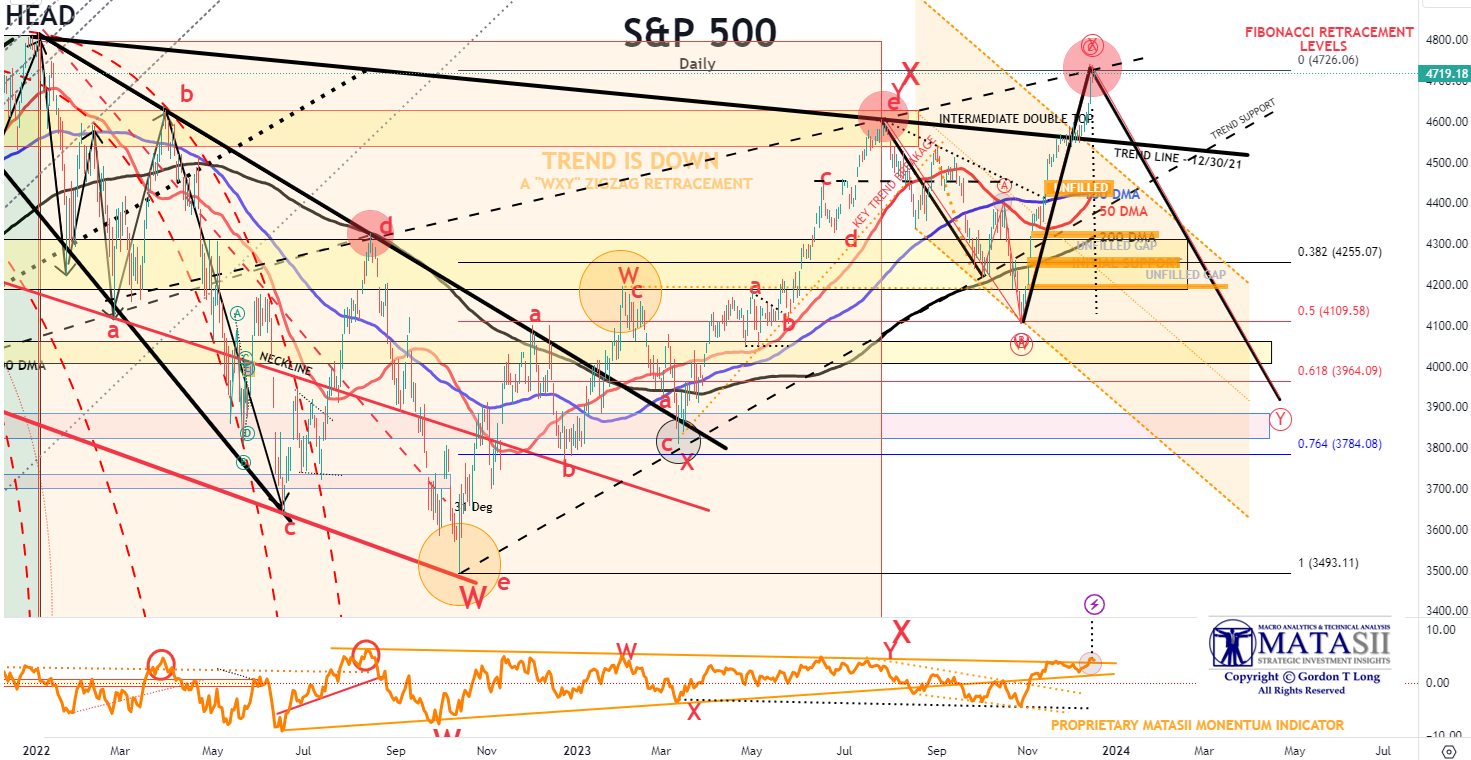
S&P 500 – DAILY
The S&P 500 gives every indication that a near term consolidation top has been reached and a consolidation is required. However, a ” trend line through-over” is not untypical with the current amount of market momentum and FOMO. Caution is required. Re-read all that has been said above before taking a view on where the S&P 500 is headed.
YOUR DESKTOP / TABLET / PHONE ANNOTATED CHART
Macro Analytics Chart Above: SUBSCRIBER LINK
CONCLUSION
Our opinion is we have not seen the final cyclical high yet! The situation is eerily the same as Christmas 1999 before the Dotcom Bubble Burst in March 2020. The market kept defying all rationale, with increasing volatility, by only continuing higher into Q1 – before finally beginning its multi-year decline.
Don’t be surprised by a correction before the markets reach their final top. It is important to realize that this is not a normal cyclical top, but rather a major generational top. They take longer and only later will it be clearly evident in the MONTHLY stock charts.
This is not about the US Markets! We see it as being driven globally!
FAIR USE NOTICE This site contains copyrighted material the use of which has not always been specifically authorized by the copyright owner. We are making such material available in our efforts to advance understanding of environmental, political, human rights, economic, democracy, scientific, and social justice issues, etc. We believe this constitutes a ‘fair use’ of any such copyrighted material as provided for in section 107 of the US Copyright Law. In accordance with Title 17 U.S.C. Section 107, the material on this site is distributed without profit to those who have expressed a prior interest in receiving the included information for research and educational purposes. If you wish to use copyrighted material from this site for purposes of your own that go beyond ‘fair use’, you must obtain permission from the copyright owner.
NOTICE Information on these pages contains forward-looking statements that involve risks and uncertainties. Markets and instruments profiled on this page are for informational purposes only and should not in any way come across as a recommendation to buy or sell in these assets. You should do your own thorough research before making any investment decisions. MATASII.com does not in any way guarantee that this information is free from mistakes, errors, or material misstatements. It also does not guarantee that this information is of a timely nature. Investing in Open Markets involves a great deal of risk, including the loss of all or a portion of your investment, as well as emotional distress. All risks, losses and costs associated with investing, including total loss of principal, are your responsibility.