Gordon T Long
Global Macro Research | Macro-Technical Analysis
GLOBAL MACRO
MONETARY POLICY
POLITICAL WILL IS LACKING, WHILE RHETORIC IS OVERLY ABUNDANT!
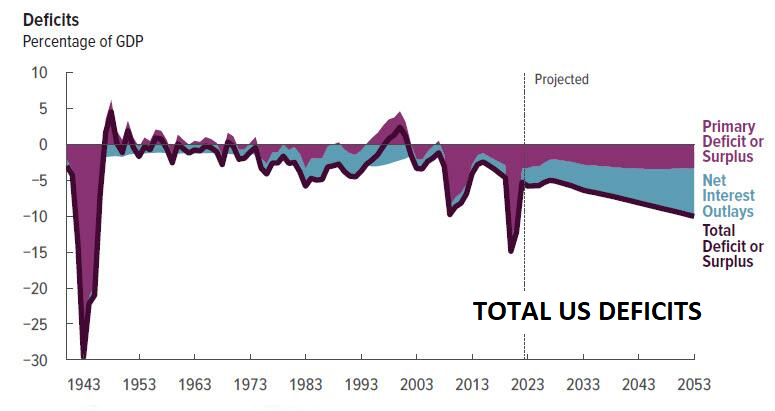
The reason inflation remains elevated today, despite coming off 40-year highs, is that government spending also remains elevated.
Annualized data since June 2022 show that inflation has not been trending towards the Fed’s 2 percent target, but rather towards a higher 3 percent level. It has arrived there, but there is no indication it is going any lower – anytime soon.
That is not surprising, since neither Biden nor most of Congress have any intention of returning the budget to reasonable levels. They do not have the political will or incentive to cut spending, as was espoused in the “Inflation Reduction Act” (IRA). That means the Treasury will continue borrowing at its current breakneck pace and faster when the economy inevitably falls into recession.
But political will is also in short supply at the Fed, which has not done enough to fight inflation, evidenced by their own Financial Conditions Index still reflecting loose conditions? Doing so would make today’s government spending levels, and laws like the IRA, prohibitively expensive. That means America is stuck with elevated inflation until there is real political will to end it.
Inflation accelerated last month, just ahead of the one-year anniversary of the deceptively named Inflation Reduction Act. When President Joe Biden signed that piece of legislation, he promised it would bring down costs. Instead, the IRA has increased costs through burdensome taxation and regulation while doing nothing to address the true causes of inflation.
Many forget that Biden and a Democrat-controlled Congress used parliamentary tricks to ram through the IRA at a time when inflation was at 40-year highs. Also now forgotten is that Inflation is fundamentally caused by the government spending too much money. The will to fight inflation won’t occur until an understanding of what actually caused it is fully realized!
WHAT YOU NEED TO KNOW
 CREDIT TIGHT BUT THE REAL CREDIT CRUNCH STILL AHEAD!
Globally, further falls in consumer price inflation are increasingly unlikely while bond yields are on the rise. It appears a new phase of the banking crisis has begun with the further contraction of bank credit and rising loan losses in its early stages. We have a credit crunch still in front of us.
A new bout of price inflation, which more accurately is an acceleration of falling purchasing power for currencies, should be expected to lead to higher interest rates and further credit pressures.
THE BRICS: Now Include Three of the World’s Largest Oil Producers Making A Formidable Trading Bloc.
-
- The Good News: The long awaited South African BRIC Summit did not announce a Gold backed alternative to the US dollar trade payment settlements.
- The Bad News: The Summit announced that the following countries have joined the “Anti-US$” BRICS:
- Putin announced at the Summit that “De-Dollarization is now Inevitable!”
- While the G7 condemned the attack on Ukraine and imposed strict sanctions on Russia, none of the BRICS, new member additions or invitee members denounced Russia’s actions or joined in on the sanctions.
JACKSON HOLE: The Annual Monetary “Conflab”
-
- 2% v 3% NEUTRAL RATE: Powell pushed back on speculation that the central bank could raise its inflation target. “Two percent is and will remain our inflation target.”
- HIGHER NEUTRAL RATE: “Additional evidence of persistently above-trend growth could put further progress on inflation at risk and could warrant further tightening of monetary policy.” – “We are prepared to raise rates further if appropriate, and intend to hold policy at a restrictive level until we are confident that inflation is moving sustainably down toward our objective.”
- HIGHER FOR LONGER: Powell further cautioned that the process “still has a long way to go, even with the more favorable recent readings”.
GLOBAL ECONOMIC REPORTING: What This Week’s Key Global Economic Reports Tell Us?
-
- BLS Revisions – The yearly revisions to the BLS establishment survey (March 2022-March 2023) saw a downward revision by 306k, implying that the labor market was perhaps a touch cooler than initially expected during this time, albeit analysts at JPM and Standard Chartered had been looking for a -500k revision. So the reversal was not as much as feared (so far).
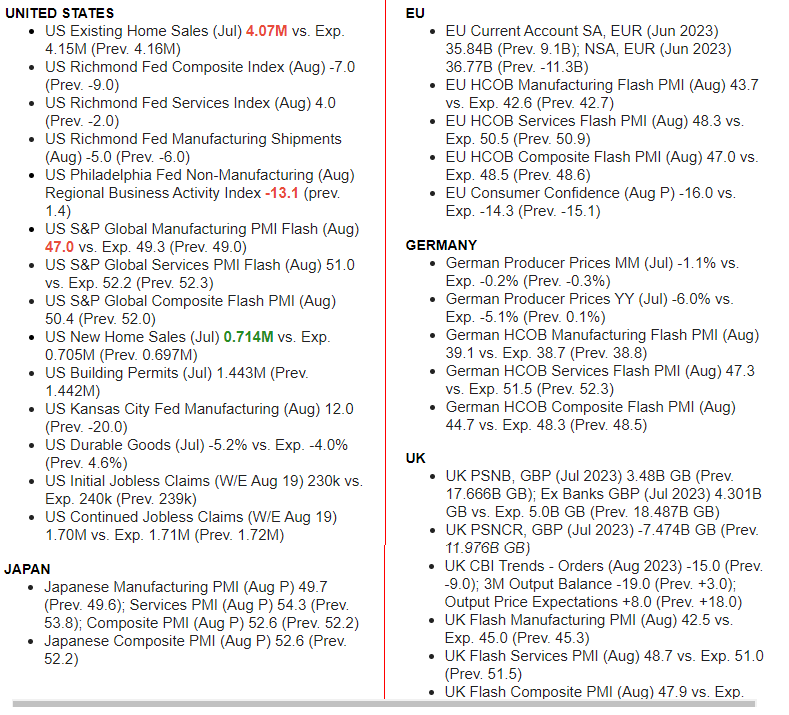
- European PMIs Signal Stagflation Accelerating Yields Tumble After European PMIs Signal Stagflation Accelerating.
- US PMIs Signal Stagflation: Service-Sector Slump, Price-Pressures Mount …the service sector-led acceleration of growth in the second quarter has faded.
- Existing home sales fell 2.2% in July to 4.07mln, beneath the expected (4.15mln) and the prior (4.16mln).
- Unemployment Claims – According to Bloomberg the percentage of states’ unemployment claims are rising sharply on an annual basis.
CONCLUSION
WHAT BIDENOMICS HAS DELIVERED
This is what Bidenomics has delivered over the last three years. The data I use is taken from the US Inflation Calculator (LINK), which I highly recommend you visit.
The inflation items below were selected because almost anyone trying to get by today must have absorbed these prices. The question is, did your wages (in after tax dollars) go up by even half of this, or a quarter?
FOOD: Three Years ago the average household spent $8100 annually. In 2023 it is expected to be +$10,500/Household.
-
-
- FOOD prices are up 25-30% overall with some much higher.
- CHICKEN: Up from $3 to $4 per pound.
- BEEF: Up from $3.50 to $6.00 per pound.
- CORN: Up from $3.50 to $4.70 per pound.
- WHEAT: Up from $5 to $7 per pound.
-
RENT:
-
-
- SINGLE FAMILY HOME RENTAL: Up from $1450/month to ~$2000/month.
- SINGLE FAMILY HOME PRICE: Up from $320,000 to $416,000.
-
GASOLINE:
-
-
- Up from $2.50/gallon to $3.80/gallon.
-
ELECTRICITY:
-
-
- Up from 0.13 cents/KWH to 0.17 cents/KWH (+30.7%)
-
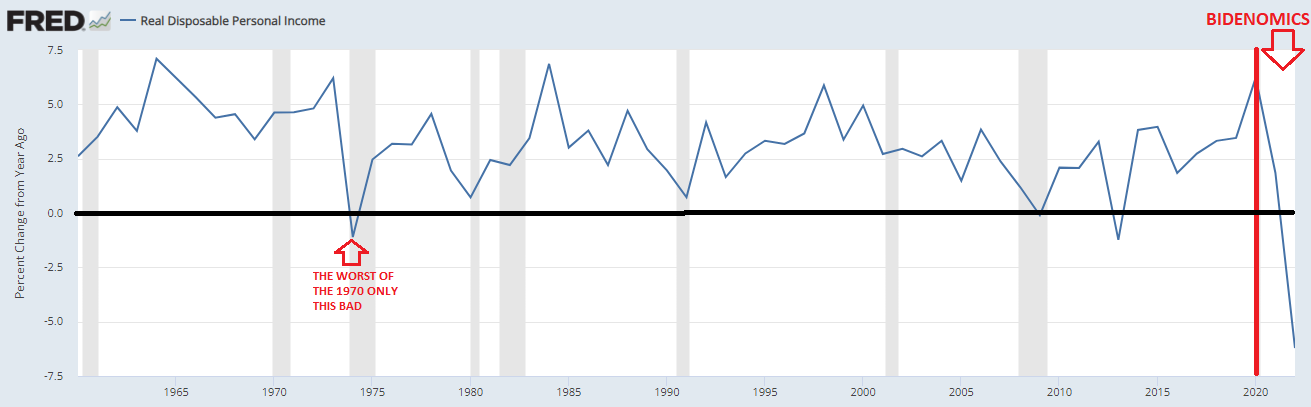
Below is a view of how that worked out for you over the last three years, based on the government’s Real Personal Disposable Income calculation for you.
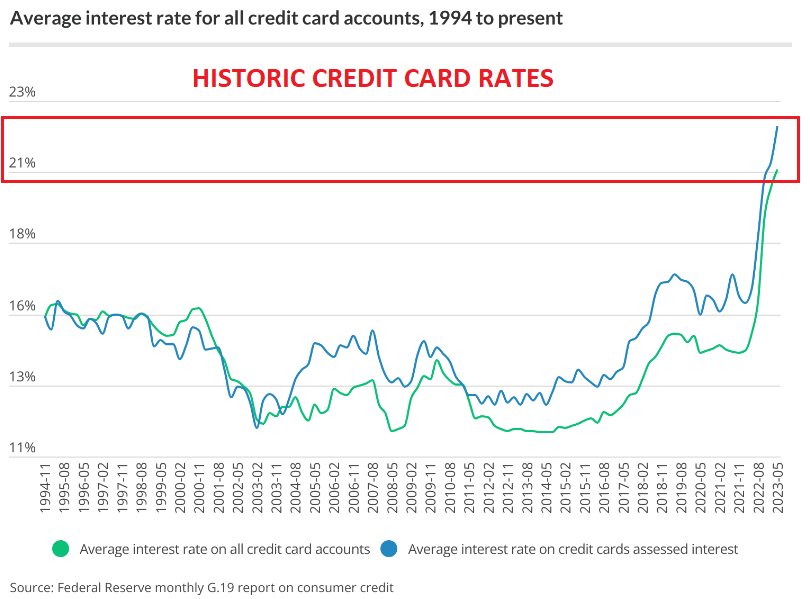
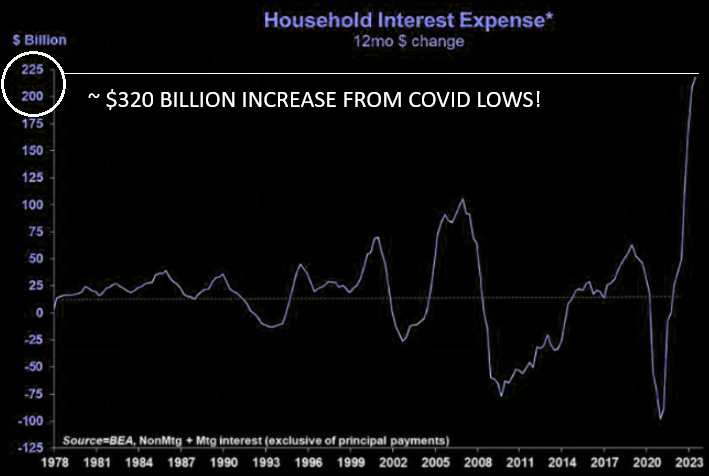
Household interest expense has risen to the highest level ever recorded.
In case you had to charge some of these increases, below is how that has likely worked out for you!
THE BRICS: Will Now Include Three of the World’s Largest Oil Producers – Making A Formidable Trading Bloc.
 The original BRICS nations formed the cooperation mechanism with the intent of protecting their firm belief in the principle of respect for sovereignty, independence and non-interference in internal affairs. To do this they felt an “Anti-Western Bloc” was needed to counter the US & G7 developed nations.
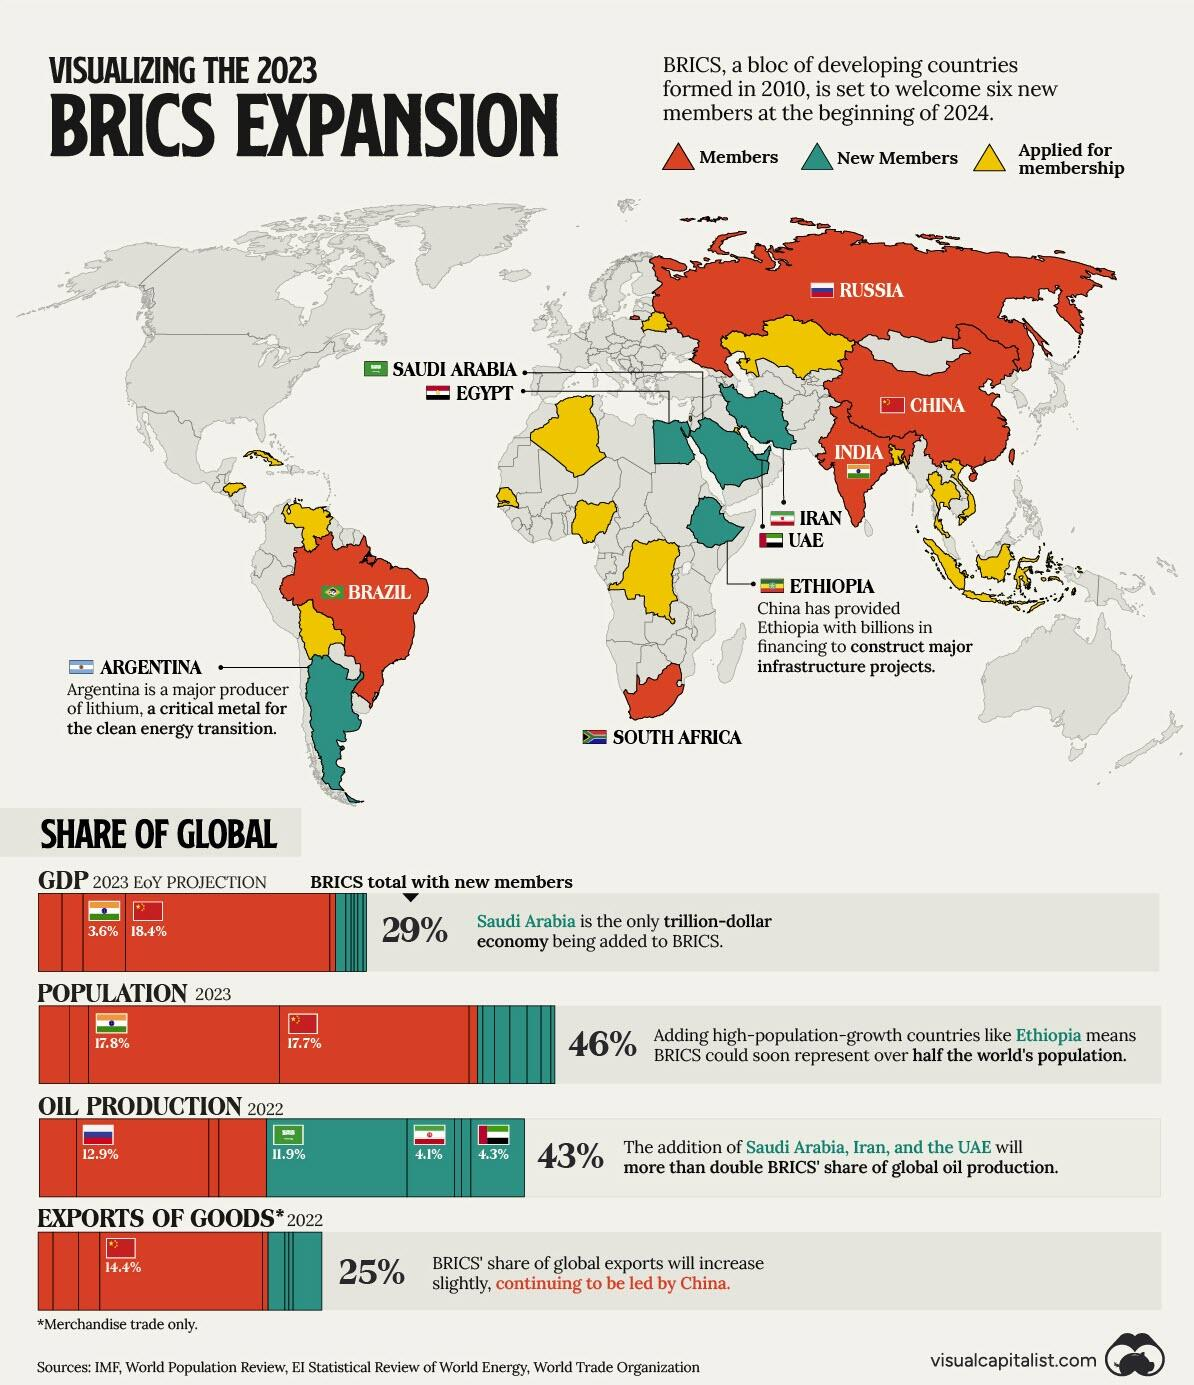
MAJOR EXPANSION
CURRENT BRICS MEMBERSHIP:
Brazil, Russia, India, China and South Africa
TO BE ADDED EFFECTIVE JANUARY 2024
Saudi Arabia and the United Arab Emirates
AGREED TO BE ADDED IN 2024
Argentina, Egypt, Ethiopia and Iran
The BRICS seek to expand its reach, encompassing a multitude of countries from the “Global South,” with Africa, Latin America, and the Middle East at its core.
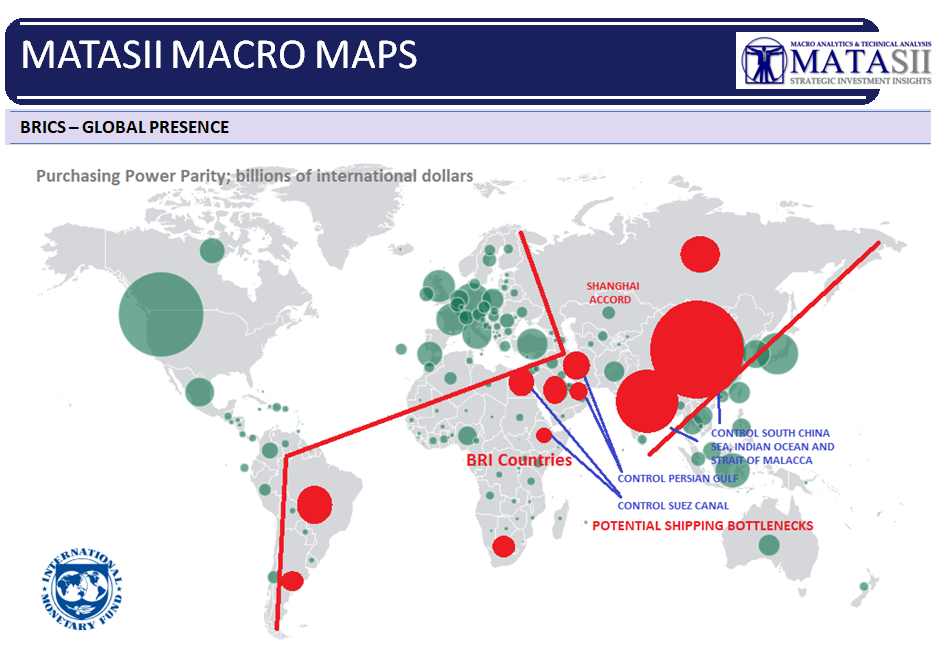
When you add the already very BRICS aligned Shanghai Agreement and BRI nations you have a membership that now effectively controls global commodities from food, to mining, to energy, and to rare earth materials.
-
- 29.3% of World GDP
- 46.0% of World Population
- 43.1% of World Oil Production
- 25.1% of World Trade Exports
IT ONLY AWAITS A GEO-POLITICAL EVENT TO FLEX ITS MASSIVE ECONOMIC POWER!
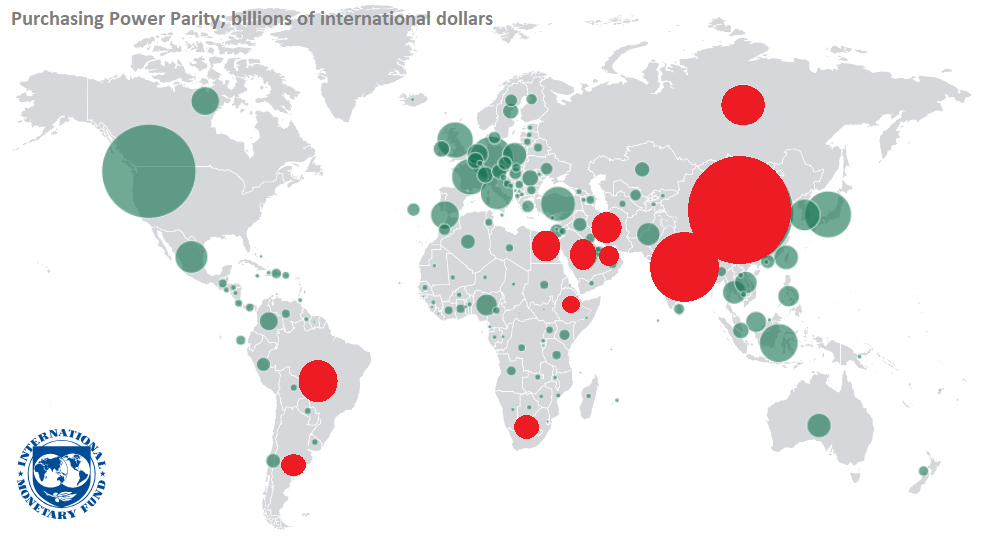
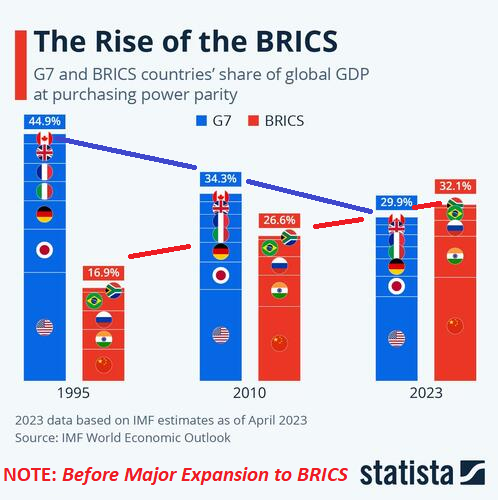
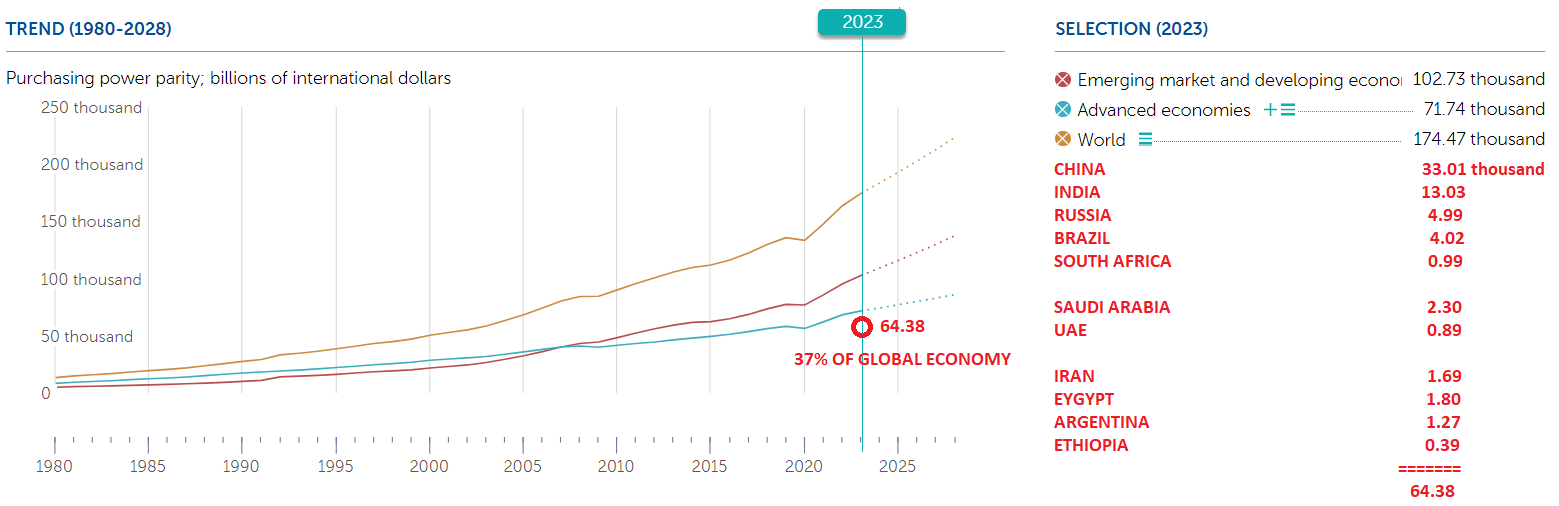
According to the IMF, the bloc will collectively account for 32.1 percent of global GDP this year. That’s up from just 16.9 percent in 1995 and more than the G7’s share of 29.9 percent.
On a Purchasing Power Parity basis the bloc will control 37% of the Global Economy.
In the lead up to the August 22nd to 24th South African BRICS Summit OilPrice.com observed:
Beneath the surface, a formidable energy-oriented bloc is forming, aligning BRICS with key energy exporters like Saudi Arabia, Egypt, and potentially Algeria and the UAE. Although not officially tied to a BRICS-OPEC+ affiliation, the convergence of interests in the list of participating or invited nations could revolutionize energy and commodity markets. An integrated alliance of energy giants would reshape global energy supply security, possibly prioritizing BRICS routes. This also extends to ambitious global supply chain projects, including China’s One Belt One Road, UAE’s port expansions, and Saudi’s Vision 2030 initiatives.
Simultaneously, BRICS’ expansion into Africa, particularly in mining, minerals, and metals, merits attention in the coming months. The inclusion of new members with critical mineral and metal resources could fundamentally shift this coalition, possibly with China and Russia spearheading efforts. Arab nations like Saudi Arabia and the UAE have also entered the global mining sphere, aligning with renewable energy and decarbonization strategies. BRICS’ expansion holds implications not just for the US dollar’s dominance but for Western influence and access to energy resources and supply chains.
…..
As Riyadh, Abu Dhabi, Cairo, Algiers, and others pivot toward the East, including Russia, a significant challenge emerges. Not just hydrocarbons, but access to supply chains and maritime trade routes, will be high on the agenda. The integration of North Africa and the Middle East into a Beijing-Moscow-led BRICS+ adds pressure. China and Russia are no longer bystanders; they actively undermine Western interests. The potential integration of OPEC and gas-exporting nations into BRICS threatens Western energy interests. The convergence of Saudi Arabia, Egypt, Algeria, Brazil, and Russia empowers BRICS with control over 60% of global energy reserves and production.
The new BRICs alliance and aligned accords now have sovereign control over a large part of the globe as well as the major shipping routes for energy and supply chains!
While the G7 condemned the attack on Ukraine and imposed strict sanctions on Russia, none of the BRICS, new member additions or invitee members denounced Russia’s actions or joined in on the sanctions.
JACKSON HOLE: The Annual Monetary “Conflab”
 Going into the Jackson Hole meeting and specifically Chairman Powell’s address, our view was to watch for anything that set the stage for the Fed changing the Fed Inflation target rate from 2% to 3%.
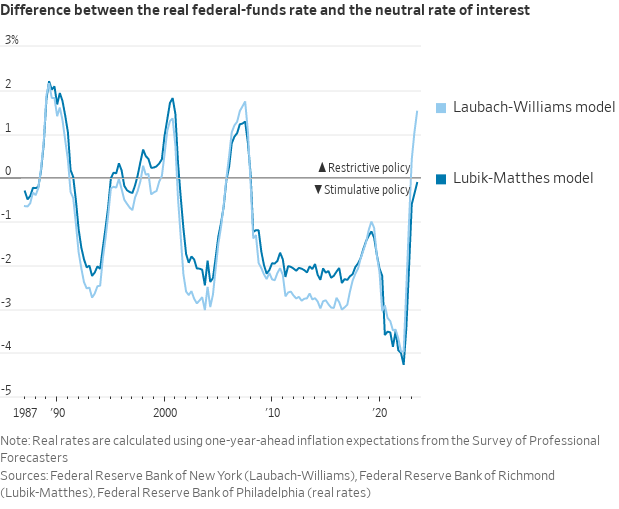
This is going to eventually happen, but will not be announced at this time. However, the signals may come on how Powell addresses the fact that stronger productivity gains and a wider budget deficit might raise the neutral interest rate (r*). If the economy is running above potential at 5.25% interest rates, then that might suggest that the neutral rate might be higher than analysts currently believe.
According to the well respected Fed watcher Nick Timiraos @nicktimiraos
Low neutral rate estimates are a result of GFC reverberations which depressed demand and inflation, and that the cyclical backdrop points towards higher neutral rates. Moreover, resilience in the face of a large policy shift would reinforce the case for revising neutral higher. Notably, individual FOMC estimates of the longer-run Fed funds rate, which markets view as a proxy for r*, have been gradually moving up in recent SEP, but have yet to affect the median rate. In an environment in which long-term yields have been climbing for the last month driven by increased growth and inflation expectations, and perhaps exaggerated by a less supportive monetary policy backdrop globally and fears of increased duration supply, this has only added pressure to yields ahead of Chair Powell’s comments at Jackson Hole.
It’s unlikely the Chair’s comments will foreshadow a larger change to the longer-run dot at the September FOMC meeting, as Chair Powell has repeatedly discussed policy as being restrictive.
Moreover, if history is a guide, this could be a slow process: Figure 2 shows the median longer-run dot declined 175bp over the last expansion, but this was spread over a decade. Thus, we think it would be difficult to conclude with certainty the Chair would make an aggressive statement on this topic on Friday, even though the risk may lean in this direction.
HERE IS WHAT HAPPENED
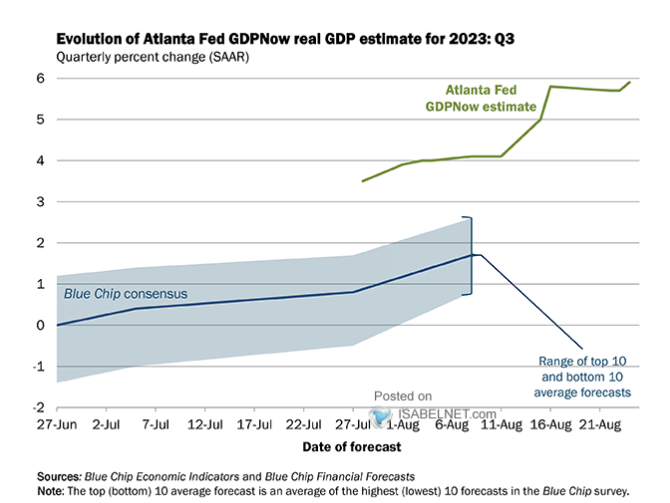 With the Fed’s own GDPNow forecast calling for a hot Q3 GDP of 5.9% Chairman Powell came out quite hawkish!
-
- 2% v 3% NEUTRAL RATE: Powell pushed back on speculation that the central bank could raise its inflation target. “Two percent is and will remain our inflation target.”
- HIGHER NEUTRAL RATE: “Additional evidence of persistently above-trend growth could put further progress on inflation at risk and could warrant further tightening of monetary policy,” – “We are prepared to raise rates further if appropriate, and intend to hold policy at a restrictive level until we are confident that inflation is moving sustainably down toward our objective.”
- HIGHER FOR LONGER: Powell further cautioned that the process “still has a long way to go, even with the more favorable recent readings.”
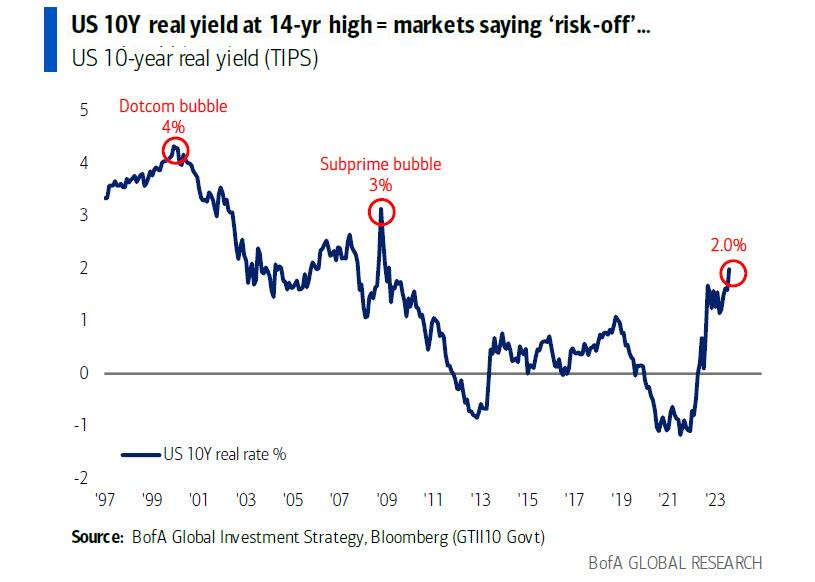
The 10Y UST Note Yield as well as the real Rate on TIPS rose as we suspected Powell wanted!
WHAT IT LIKELY MEANS:
1- INFLATION BREAKEVENS:
-
- 5yr BEI -0.2bps at 2.361%
- 10yr BEI -1.1bps at 2.332%
- 30yr BEI -1.2bps at 2.320%
MATASII VIEW: 10Y UST YIELD
-
- Inflation Breakevens = 2.5%-3%, Real Rates = 1.5%-1.75% == 10Y UST Nominal Rates 4.0% – 4.75%
- Expected Trading Range: 4.15% – 4.60%
CHAIRMAN POWELL IS GOING TO LET SOMETHING BREAK BEFORE BLAMING THE REALITY OF A 3% INFLATION TARGET ON THE REQUIRED “BREAKAGE” RESPONSE.
GLOBAL ECONOMIC REPORTING: What This Week’s Key Global Economic Reports Tell Us
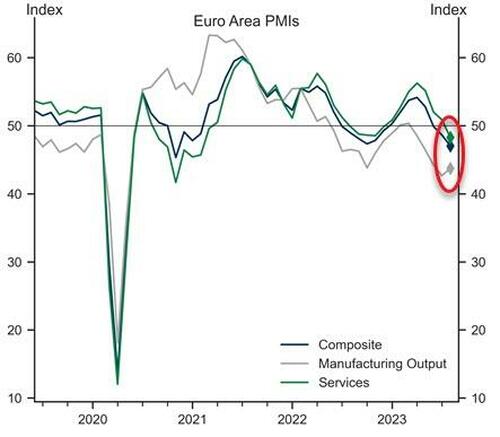 European PMIs Signal Stagflation Accelerating: Yields Tumble After European PMIs Signal Stagflation Accelerating.
The contraction of private-sector activity in the euro area intensified in August as the composite flash PMI decreased by 1.6pt to 47.0, below consensus expectations (48.5), on the back of a further meaningful decline in services activity, (offset only partially by an improvement in the manufacturing output index).
US PMIs Signal Stagflation: Service-Sector Slump, Price-Pressures Mount …the service sector-led acceleration of growth in the second quarter has faded.
US Flash PMIs (AUG 23) – The Mfg component has only printed above 50 one time this year, which has not hurt markets, given elevated goods inflation. Given the expected shift in demand from services to goods, the market likely wants to see a higher print MoM in the manufacturing component. With Services/Composite, the key is staying in expansion territory. That said, Services had increased each of the first five months of the year before stalling over the last two months. To maintain Goldilocks, the bar is probably higher than a 50.0 print, so 51/51.5 should be enough to help break the recent recession narrative.
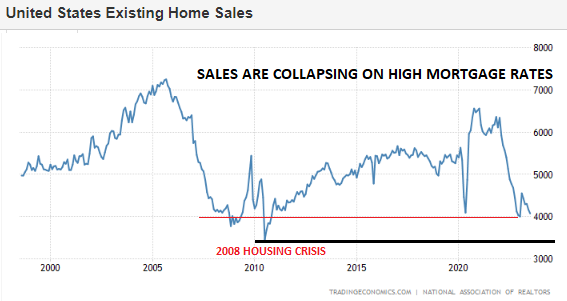 US Existing Home Sales (Jul) 4.07M vs. Exp. 4.15M (Prev. 4.16M)
-
- Existing home sales fell 2.2% in July to 4.07mln, beneath the expected (4.15mln) and the prior (4.16mln).
- Oxford Economics thinks they likely have further to fall over the rest of the year as higher mortgage rates and a mild recession squeeze demand and keep supply conditions tight.
- Inventories rose to 3.3 months’ worth (prev. 3.1), while the prospect of higher-for-longer mortgage rates will keep more sellers on the sidelines over the coming months.
- OxEco adds, “even the expected slowdown in the economy probably won’t generate much in terms of distressed sales, with the unemployment rate forecast to peak at just over 5% and households’ balance sheets in aggregate still in great shape.”
- Overall, reflecting tight supply, the median home price rose by 1.9% Y/Y, although the consultancy does not expect the rebound in price growth to be sustained with the economy still heading for a recession.
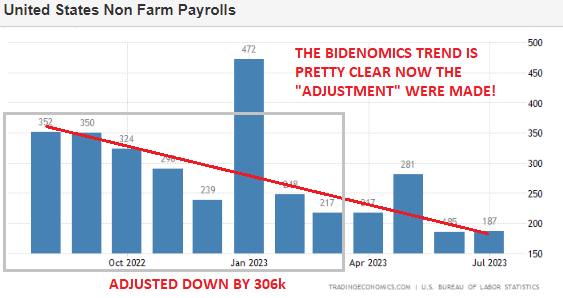 BLS Revisions
-
- The yearly revisions to the BLS establishment survey (March 2022-March 2023) saw a downward revision by 306k, implying that the labor market was perhaps a touch cooler than initially expected during this time, albeit analysts at JPM and Standard Chartered had been looking for a -500k revision. So the reversal was not as much as feared.
- Given the data comes ahead of the Jackson Hole economic symposium, the Fed speakers and potentially Chair Powell, may be quizzed on the revisions. Nonetheless, given there is still the July CPI and NFP report due before the September FOMC, Powell will likely reiterate their data-dependent stance.
- The latest FOMC minutes noted that participants still saw below-trend growth and a softer labour market as necessary to restore economic balance. Therefore the downward revisions would likely help somewhat, albeit it may not be enough given expectations were skewed towards a steeper decline and even with the revision, job growth would still be well above pre-COVID averages.
- Analysts at Oxford Economics note the revisions do not change their call for the Fed to keep policy steady through year-end, or their expectations of the real economy.
- However, at the margin, Ox Eco suggests Fed officials may see the revisions, alongside moderating wage growth, as a sign their rate hikes are having the intended effect.
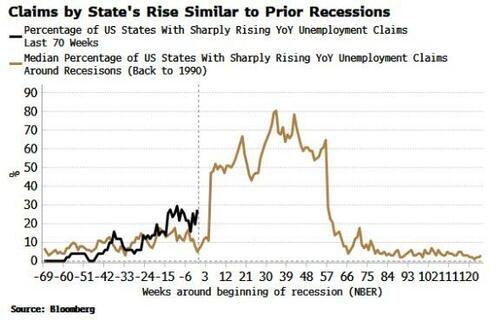 Unemployment Claims
According to Bloomberg the percentage of states unemployment claims are rising sharply on an annual basis.
The chart to the right shows this percentage for this year (black line), and the median of this percentage over recessions back to 1990 (brown line).
The current path is consistent with a recession in the near future.
NOTE: The indicator also captures the regime-shift nature of recessions, with economies moving abruptly from non-recessionary to recessionary states (i.e. everything looks fine … until it doesn’t!).
GLOBAL MACRO
WHAT DOES YOUR SCAN OF THE DATA BELOW TELL YOU? – THE MEDIA AVOIDS BAD NEWS!
We present the data in a way you can quickly see what is happening.
THIS WEEK WE SAW
Exp=Expectations, Rev=Revision, Prev=Previous
CONCLUSION
 I have written extensively why the US Government’s CPI measure is not the best way to measure what inflation is. Even the Federal Reserve doesn’t use it as it prefers the Core PCE measure.
John William’s ShadowStats gets you much closer to reality (chart to the right).
However it fails in a number of ways, one of which is a rate of change Y-o-Y. When Energy for example is down from last year and yet food is up substantially, the impression may be given that overall inflation is improving. In reality we are only witnessing inflation using these aggregated measures and they are not going up as fast. Nevertheless, areas other than energy are still rising and making your life even more uncomfortable. This is because the ever increasing bleed is pushing you over your solvency line with neither your wages nor bank account available to keep up. This is why 74% of Americans say the economy under Bidenomics is getting worse.
WHAT BIDENOMICS HAS DELIVERED
Let’s forget the ups and downs and aggregating and see what Bidenomics has delivered over the last three years. The data I use is taken from the US Inflation Calculator (LINK), which I highly recommend you visit.
FOOD: Three Years ago the average household spent $8100 annually. In 2023 it is expected to be +$10,500/Household.
-
-
- FOOD prices are up 25-30% overall with some much higher
- CHICKEN: Up from $3 to $4 per pound
- BEEF: Up from $3.50 to $6.00 per pound
- CORN: Up from $3.50 to $4.70 per pound
- WHEAT: Up from $5 to $7 per poind
-
RENT:
-
-
- SINGLE FAMILY HOME RENTAL: Up from $1450/month to ~$2000/month
- SINGLE FAMILY HOME PRICE: Up from $320,000 to $416,000
-
GASOLINE:
-
-
- Up from $2.50/gallon to $3.80/gallon
-
ELECTRICITY:
-
-
- Up from 0.13 cents/KWH to 0.17 cents/KWH (+30.7%)
-
The above were selected because almost anyone trying to get by today must have absorbed these prices. The question is, did your wages (in after tax dollars) go up by even a Half of this? A Quarter?
Here is a view of how that worked out for you over the last three years, based on the government’s Real Personal Disposable Income calculation.
CAN AI CARRY THE MARKET?
WEEK DRIVEN BY NIVIDIA EARNINGS, RETAIL & JACKSON HOLE
Click All Charts to Enlarge
 1 – SITUATIONAL ANALYSIS
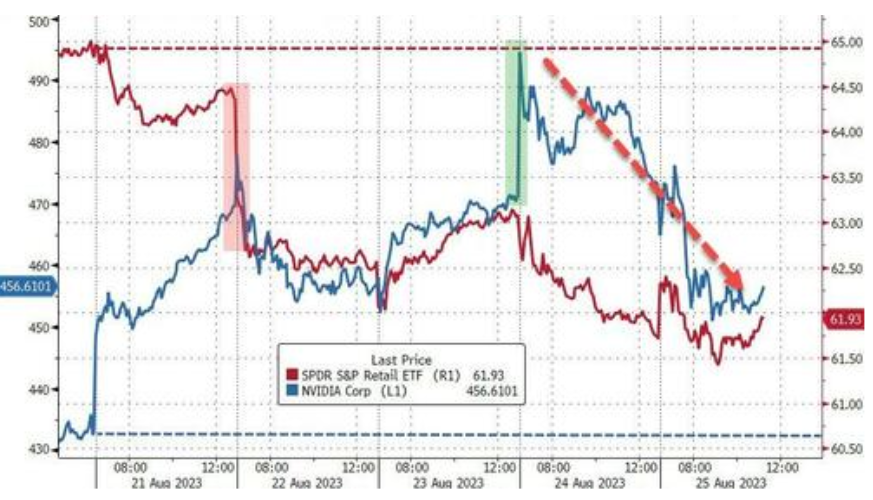
This week was all about retailers (consumer credit challenges and shrinkage) and NVDA (keeping the dream alive for the AI bubble).
Retail stock ended the week lower and while NVDA exploded higher on the earnings news, it collapsed back in the last two days, down over 10% from its highs…
 NVIDIA Q2 EARNINGS
Nvidia erupts on its Q2 earnings to a new record high on blowout Q2 earnings. Earnings far exceeded investor expectations with a “whisper” shattering Q3 guidance and a new $25BN Buyback.
-
- Adjusted EPS $2.70 (Expectations $2.09)
- Revenue $13.51B (Expectations $11.22B)
- Nvidia approved a further $25B in share buybacks, without expiration.
- Friday Close: $460/Share
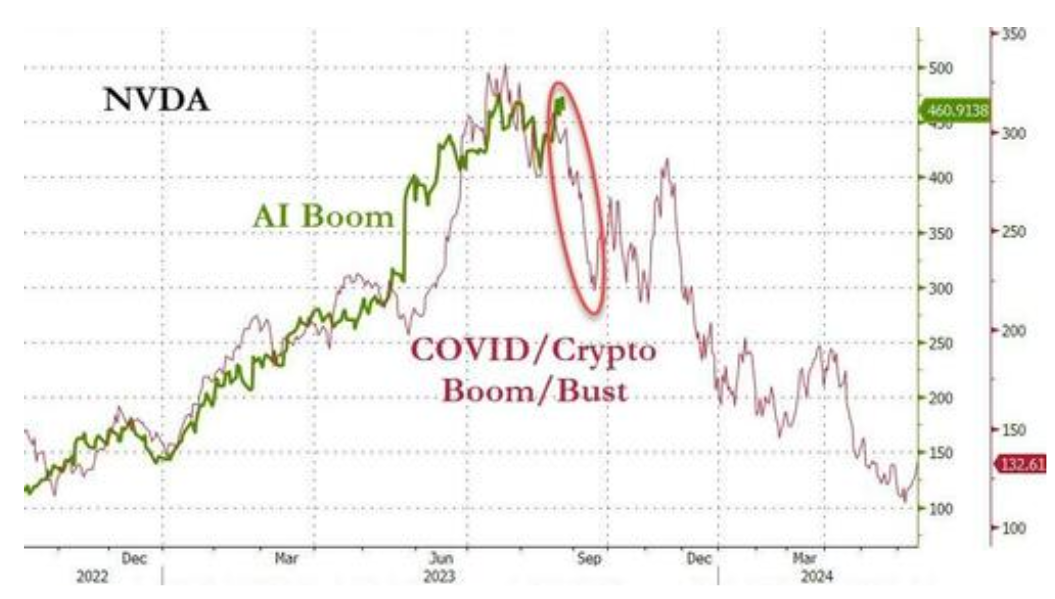
Prices initially rose substantially following our analogy (chart right), which we have been showing since well before the peak.
INVESTMENT COMMUNITY REACTION: Initially Overwhelming
“A new computing era has begun.
Companies worldwide are transitioning from general-purpose to accelerated computing and generative AI.”
-
- $NVDA: Stifel Upgrades to Buy PT $600 from $440
- $NVDA: Rosenblatt raises price target to $1,100 from $800
- $NVDA: Baird raises price target to $750 from $570
- $NVDA: KeyBanc raises price target to $670 from $620
- $NVDA: BofA Securities raises target to $650 from $550
- $NVDA: Wolfe Research raises target to $630 from $570
- $NVDA: Morgan Stanley raises target to $630 from $500
- $NVDA: Piper Sandler raises target to $620 from $500
- $NVDA: Raymond James raises target to $600 from $500
- $NVDA: Wedbush raises price target to $600 from $490
- $NVDA: JPMorgan raises price target to $600 from $500
- $NVDA: Mizuho Securities raises target to $590 from $530
- $NVDA: Deutsche Bank raises target to $560 from $440
 Rosenblatt raised its price target on Nvidia to a Wall ST high of $1,100, up from $800 while maintaining its Buy rating.
- 1100 would put NVDA just ahead of MSFT as the 2nd largest company in the world.
CHART RIGHT
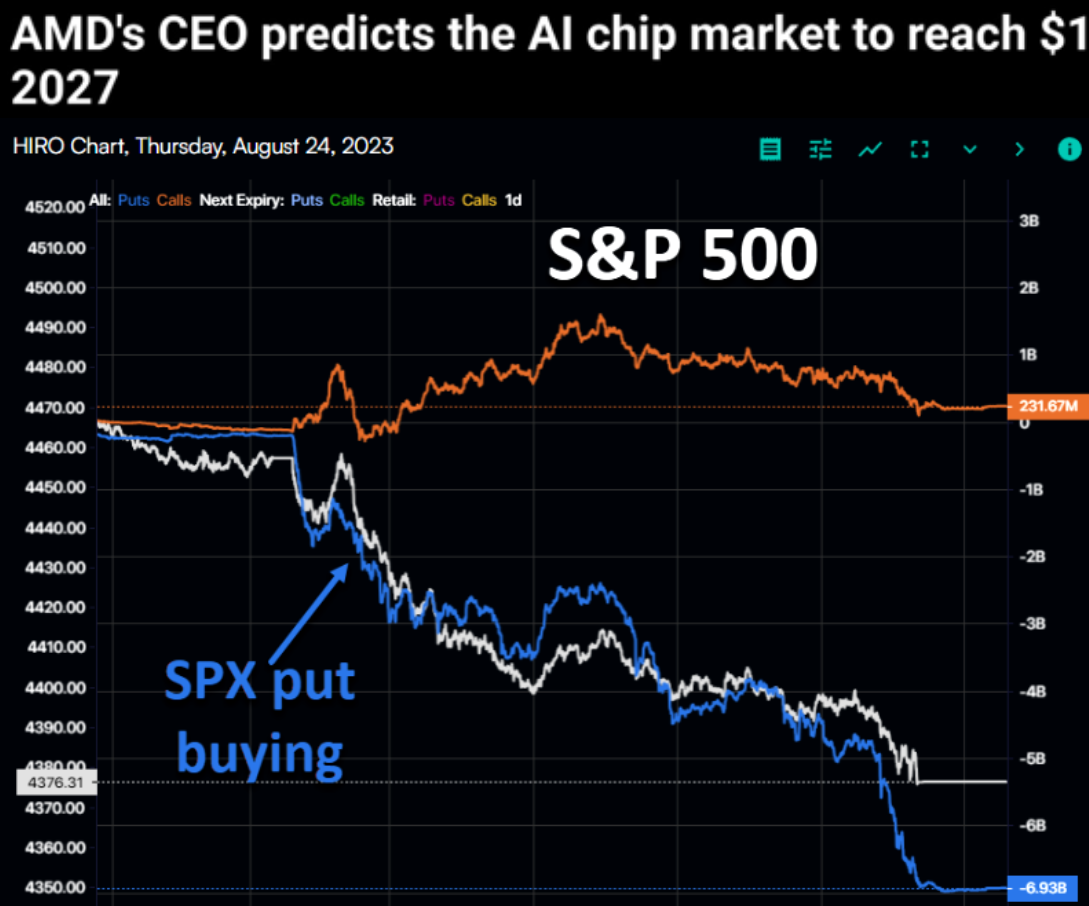
Subsequent to NVDA Earnings after the bell Wednesday night, we had a very marked rush to buy PUTS on Thursday!
The equity markets overall are at a key inflection point. The question is whether NVDA & AI Momentum will continue to carry the markets with market breadth extremely weak? Two further metaphors (below) are also quite interesting and need watching, in case their signals are in fact correct.
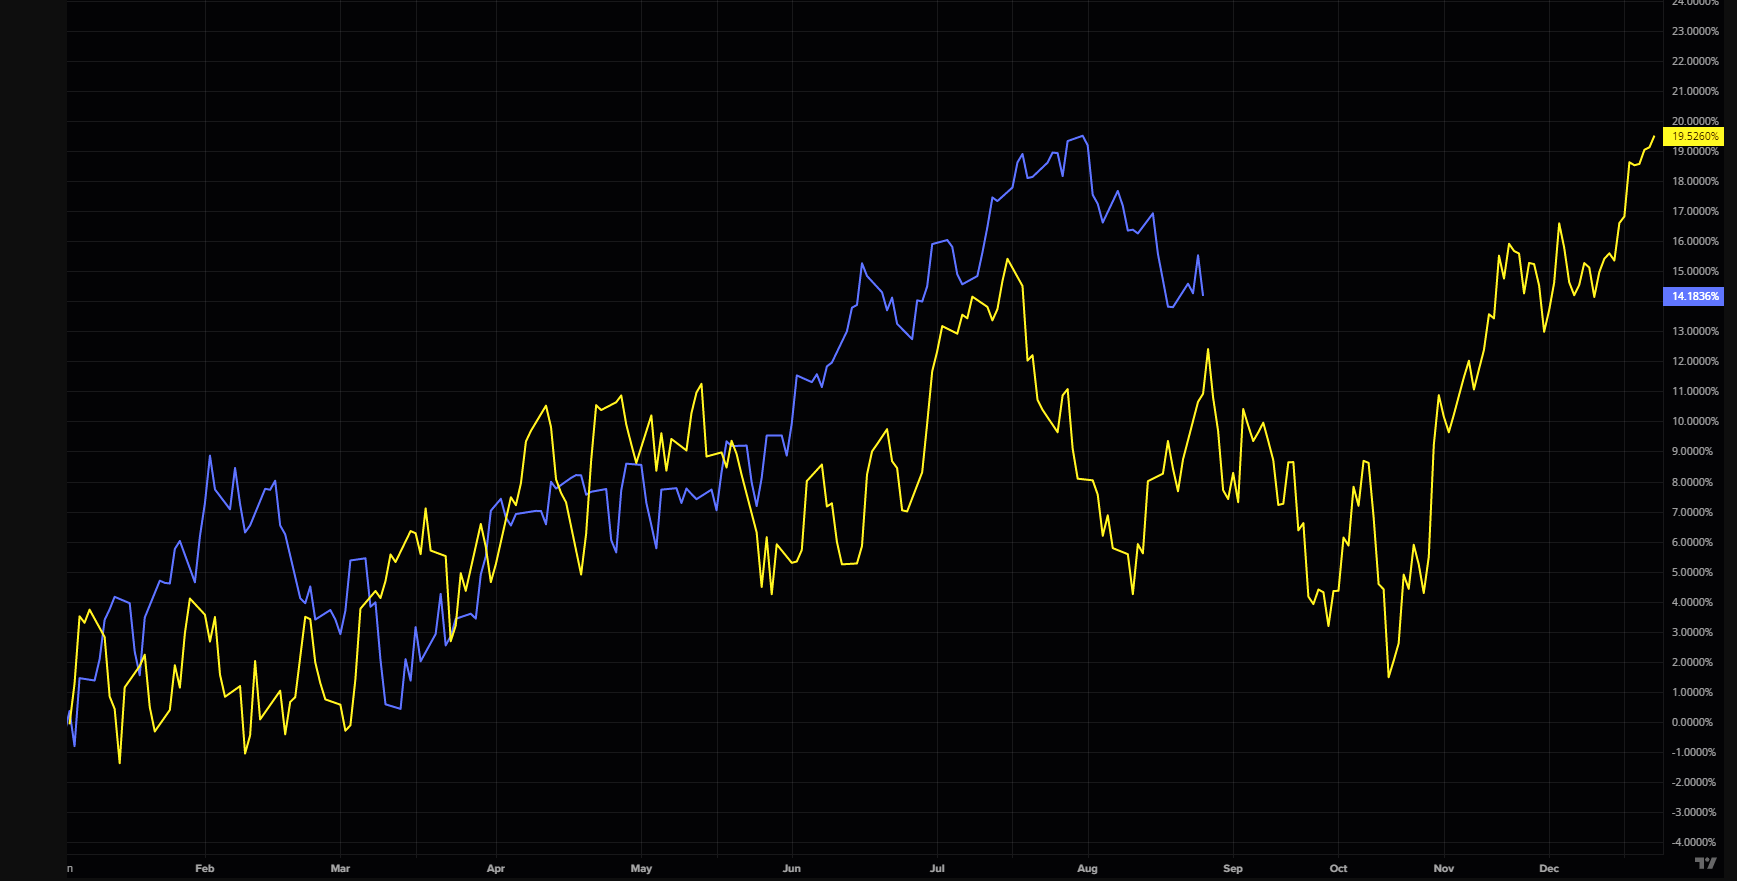
1999 ANALOGY
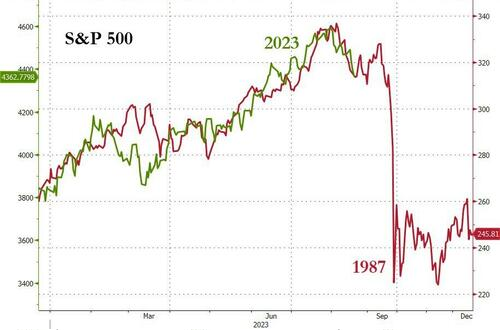
1987 ANALOGY
2 – FUNDAMENTAL ANALYSIS
 There is little doubt that the NVDA fundamentals are excessive. However, this is to be expected when we are in the early stages of potentially revolutionizing technology.
-
- Nvidia’s P/E: 48.9x →10Y average: 33.1x
- Nvidia’s EV/EBITDA: 59.9x →10Y average: 30.2x
- Nvidia’s Price to Sales: 23.4x →10Y average: 10.4x
- Nvidia’s Price to Free Cash Flow: 235.1x →10Y average: 50.5x (Koyfin)
-
- NVDA: 53% CAGR with stable margins
- GS model Data Center revenue CAGR of ~53% through CY2025 driven by the adoption of Generative AI
- GS model a step increase in gross margins to ~72% in CY2023 followed by a steady increase in CY2024/25
-
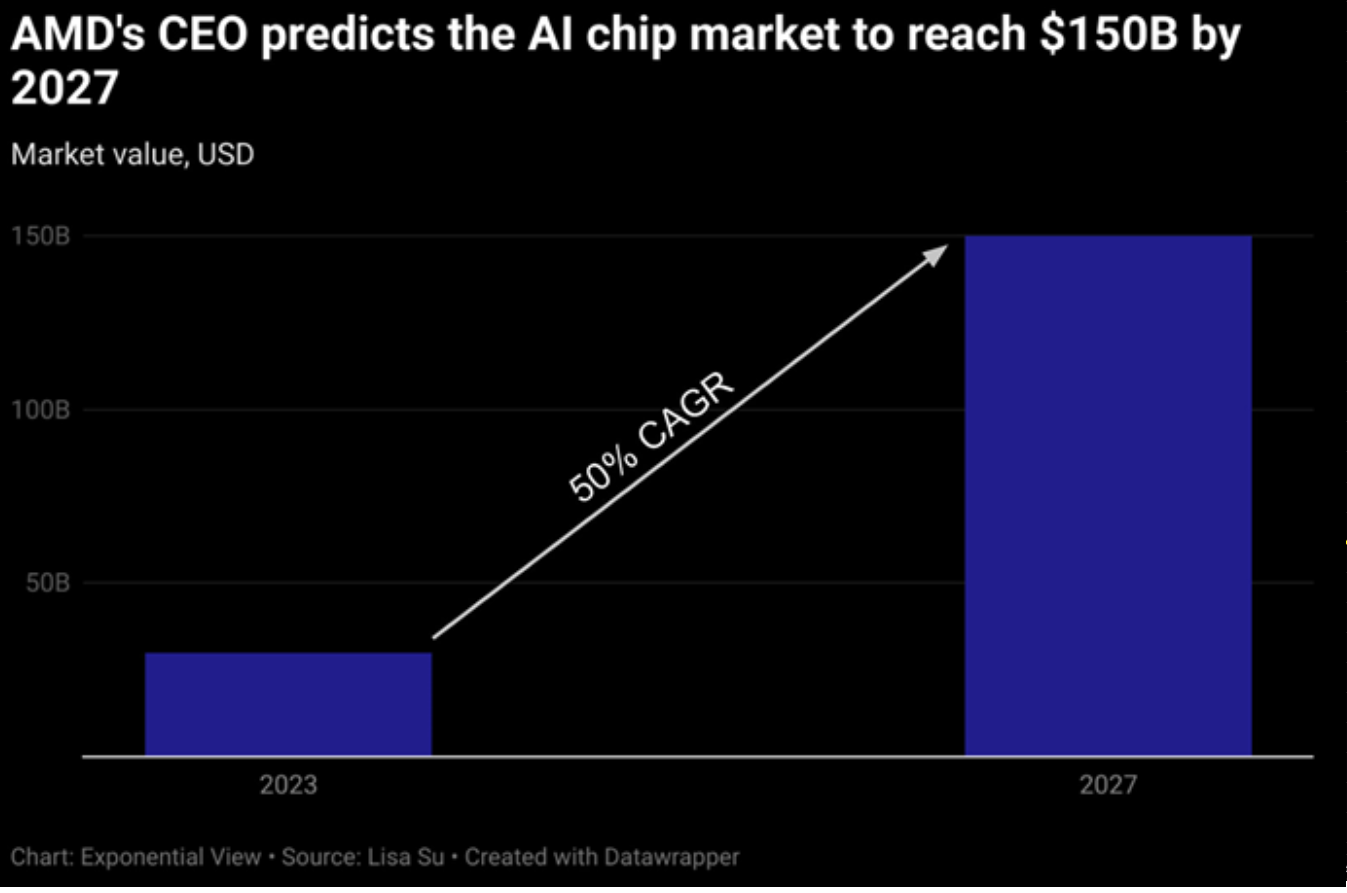
 Lisa Su, AMD’s chief executive, forecasts a surge in the AI chip market from $30 billion this year to an impressive $150 billion in 2027(Chart: Above Right).
-
- 1. Nvidia is now worth 8.8x more than Intel
- 2. Nvidia is now worth 6.9x more than AMD
- 3. Nvidia is now the 5th most valuable public company
- 4. Nvidia is now worth nearly 3x as much as JP Morgan by market cap
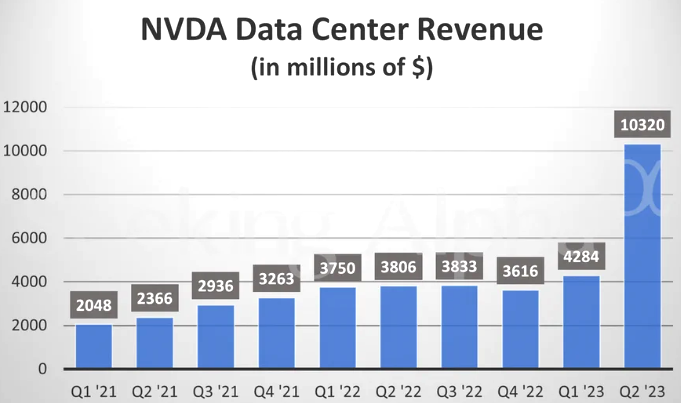
REINVENTING THE DATA CENTER
Data Center revenue of $10.32bn, up 171% YoY. “During the quarter, major cloud service providers announced massive Nvidia H100 (artificial intelligence) infrastructures,” CEO Jensen Huang said. (Chart Below)
3 – TECHNICAL ANALYSIS
The question is what should we be expecting near term? Those that want into NVDA are probably already in. Sure more will come, but what will it take for institutions to add significantly to their existng allocations? The answer to that is attractive buying opportunities usually occurring during inevitable consolidations, support tests, overall market weakness and lulls between earnings announcements and major news announcements.
Let’s see what the charts suggest…
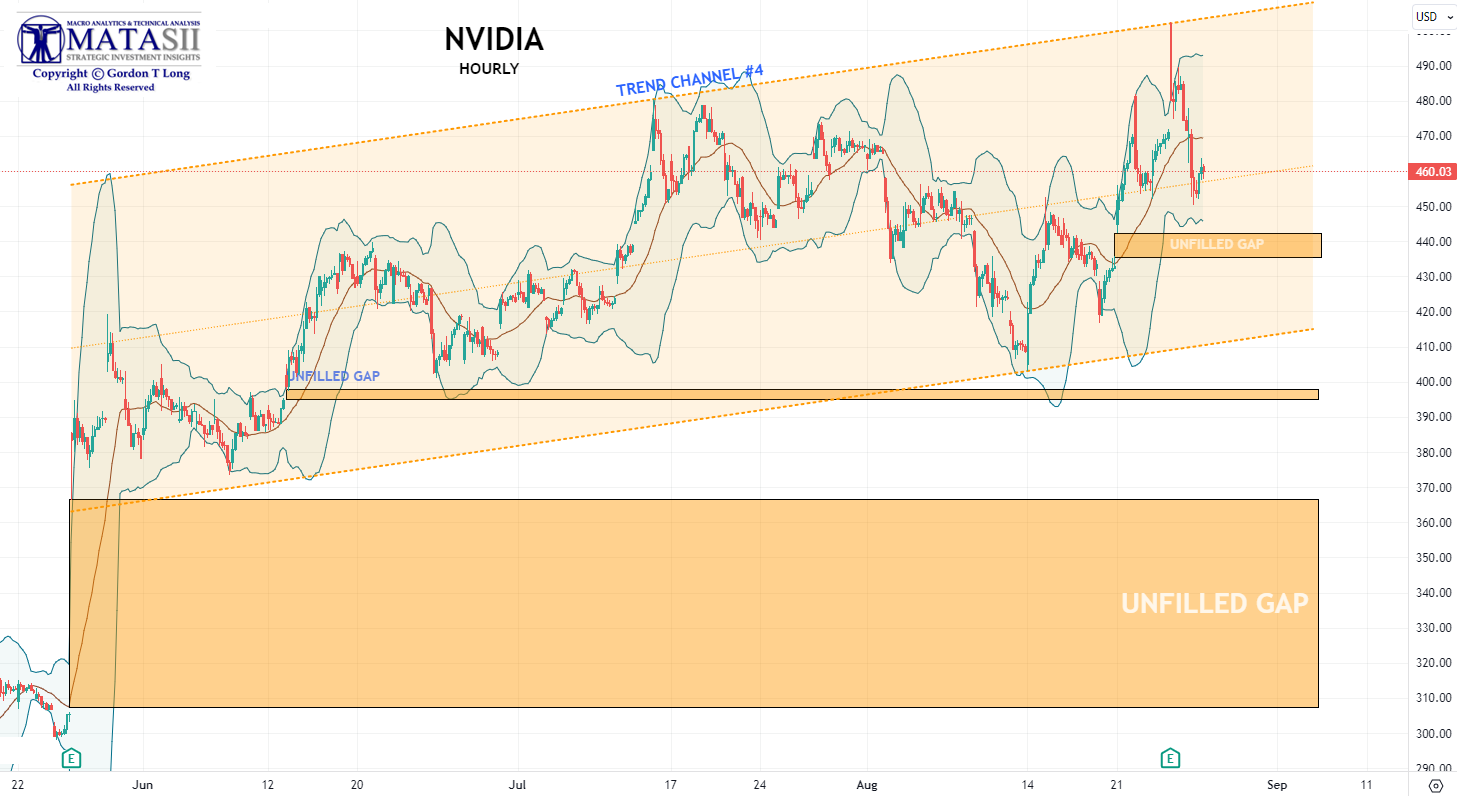
NVIDIA – HOURLY – #1
The first hourly chart we show indicates:
-
- Since the last earnings report and a major gap up, (which has not yet been filled), the trend has been steadily rising in a well defined trend channel (labeled #4).
- We now have three unfilled gaps. All other gaps have been consistently filled.
- Volatile price action has been well contained within the 2.4 standard deviation bands of the 20 hours simple moving average.
YOUR DESK TOP / TABLET / PHONE ANNOTATED CHART
Macro Analytics Chart Above: SUBSCRIBER LINK
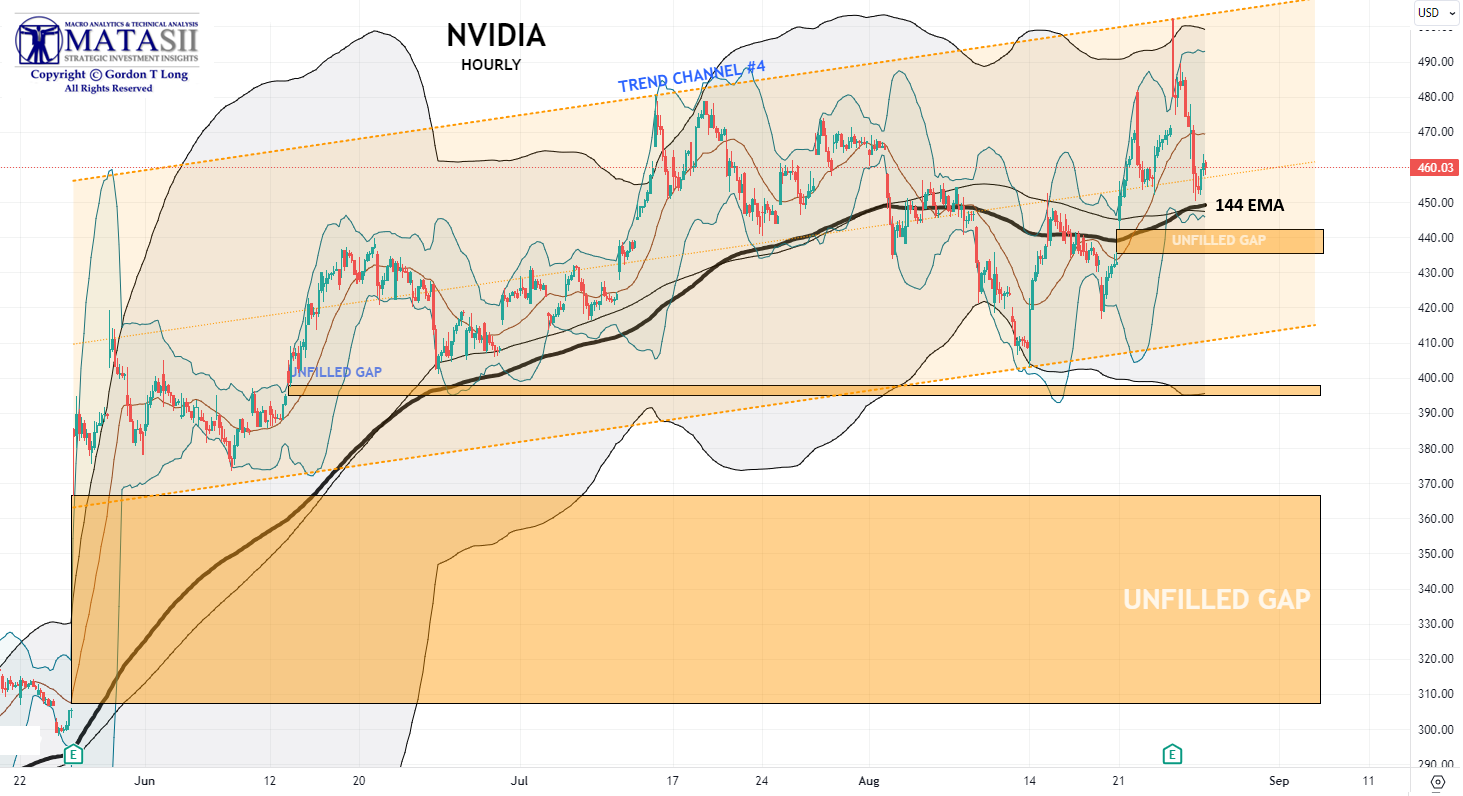
NVIDIA – HOURLY – #2
We next add the 144 EMA and its 144 SMA Bomar Bands set at 3.0 standard deviations.
-
- The 144 EMA has shown itself to be the hourly chart measure that NVDA continues to test – either to the downside or upside. It seems to measure quite well the expected slope of rise or consolidation of NVDA.
- Major price shocks are also contained within the 144 SMA 3.0 standard deviation bands.
YOUR DESK TOP / TABLET / PHONE ANNOTATED CHART
Macro Analytics Chart Above: SUBSCRIBER LINK
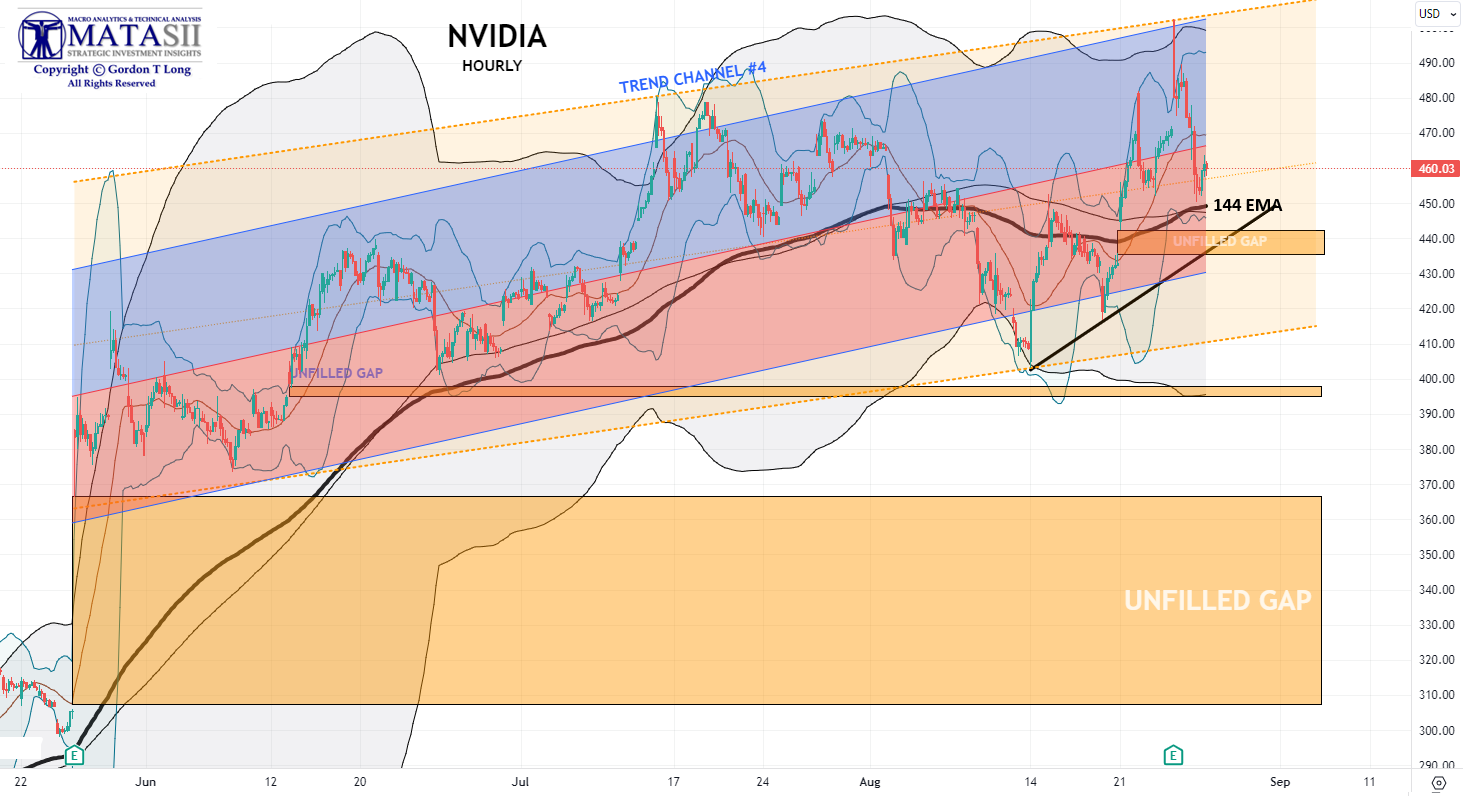
NVIDIA – HOURLY – #3
Next we add a Regression channel since the last earnings announcement and a black trend line connecting recent lows.
-
- We notice when all these hourly settings are applied we have a suggestion that we will likely see the upper unfilled gap filled during any initial post Q2 earnings consolidation.
- Overall market weakness may take NVDA towards testing its second unfilled gap.
- At this point there is no reason to believe the larger post Q1 unfilled gap will be filled.
YOUR DESK TOP / TABLET / PHONE ANNOTATED CHART
Macro Analytics Chart Above: SUBSCRIBER LINK
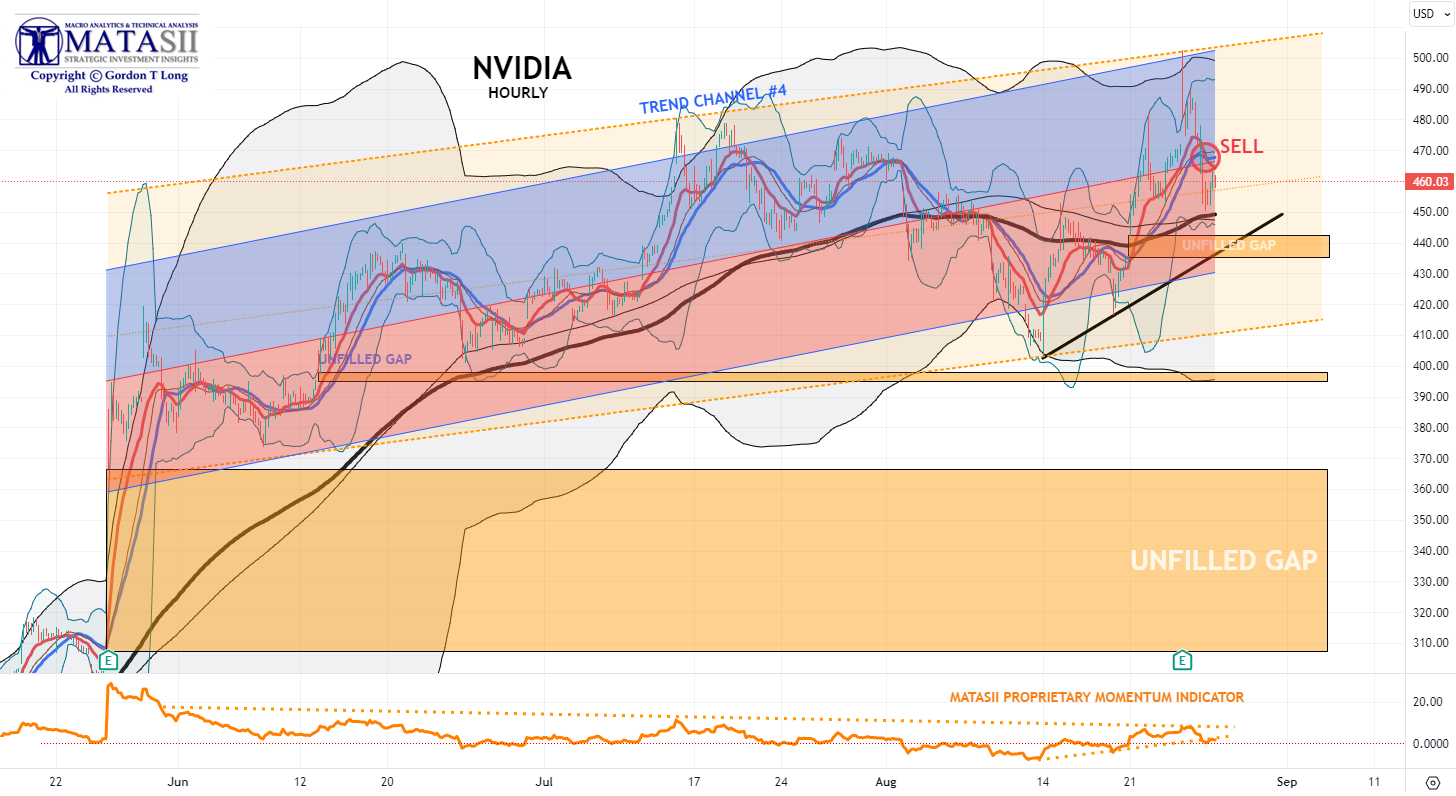
NVIDIA – HOURLY – #4 – MATASII CROSS / MATASII MOMENTUM INDICATOR
For further analysis we look at what MATASII proprietary indicators are suggesting…
-
- The MATASII Cross on an hourly basis only has issued a short term sell signal
- The MATASII Momentum indicator is showing momentum weakening and on the verge of breaking a longer term support trend line.(lower pane)
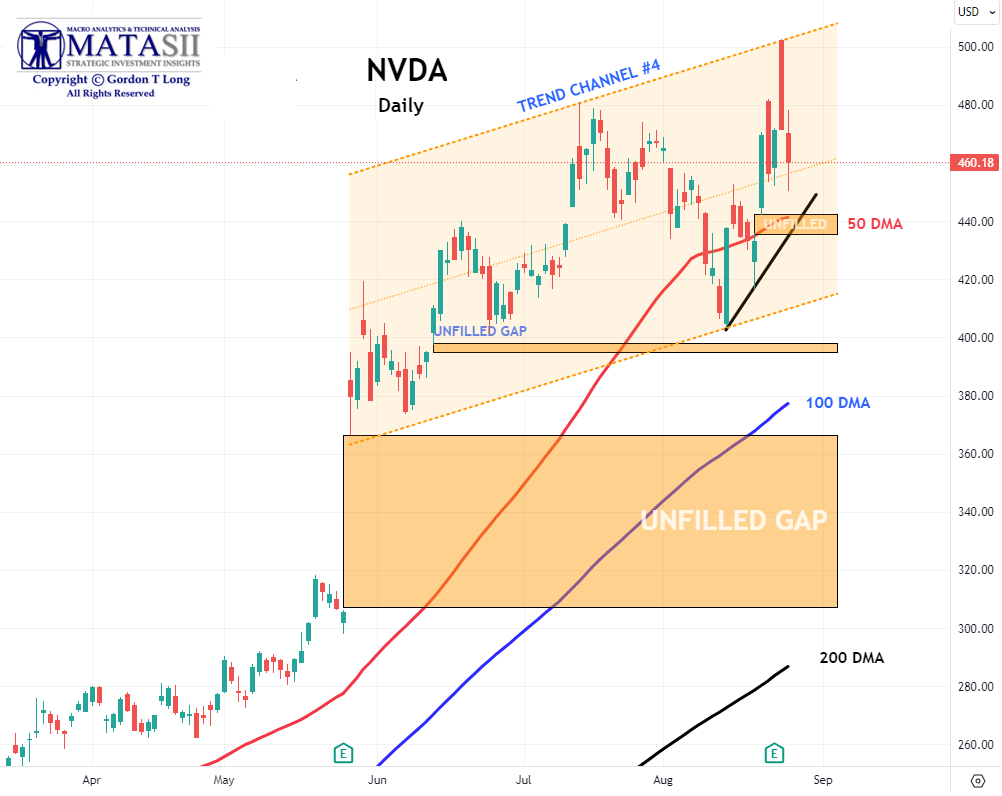
NVIDIA – DAILY
When we look at the Daily chart for NVDA we see the 50 DMA (in red) intersecting the initial unfilled gap. This further suggests where initial consolidation should be expected.
Overall market weakness and the rising 100 DMA (in blue) is likely to be tested in the area of the second unfilled gap.
YOUR DESK TOP / TABLET / PHONE ANNOTATED CHART
Macro Analytics Chart Above: SUBSCRIBER LINK
FAIR USE NOTICE This site contains copyrighted material the use of which has not always been specifically authorized by the copyright owner. We are making such material available in our efforts to advance understanding of environmental, political, human rights, economic, democracy, scientific, and social justice issues, etc. We believe this constitutes a ‘fair use’ of any such copyrighted material as provided for in section 107 of the US Copyright Law. In accordance with Title 17 U.S.C. Section 107, the material on this site is distributed without profit to those who have expressed a prior interest in receiving the included information for research and educational purposes. If you wish to use copyrighted material from this site for purposes of your own that go beyond ‘fair use’, you must obtain permission from the copyright owner.
NOTICE Information on these pages contains forward-looking statements that involve risks and uncertainties. Markets and instruments profiled on this page are for informational purposes only and should not in any way come across as a recommendation to buy or sell in these assets. You should do your own thorough research before making any investment decisions. MATASII.com does not in any way guarantee that this information is free from mistakes, errors, or material misstatements. It also does not guarantee that this information is of a timely nature. Investing in Open Markets involves a great deal of risk, including the loss of all or a portion of your investment, as well as emotional distress. All risks, losses and costs associated with investing, including total loss of principal, are your responsibility.