Gordon T Long
Global Macro Research | Macro-Technical Analysis
GLOBAL MACRO
MONETARY POLICY
A QUICKLY STALLING GLOBAL ENGINE
The global economy’s engine of growth has been dominated by China since the 2008 Financial Crisis. As we have documented many times since the GFC it has been Chinese credit growth and specifically the Chinese Credit Impulse that has fostered global growth and economic stability on four separate occasions during this period. Today the world is feeling the impacts of a stalling China.
Additionally, the world realizes it is currently lacking an alternative engine.
-
- The growth challenges facing China, the euro-zone and UK are not susceptible to quick policy fixes.
- A still levered international financial system with high debt levels can ill afford another surge in US interest rates and strong dollar appreciation.
- Japan has yet to figure out how to exit its “yield-curve control” policy in a smooth manner.
- The global economy continues to suffer unprecedented fragmentation, gradual De-Financialization and De-Globalization.
The US on the surface appears to be the best of a “bad lot”, but itself will soon face the harsh realities that foreigners will no longer be willing to finance the monstrous Bidenomic fiscal deficits at rates the US can afford. Foreigners have neither the FX Reserves or investment capital growth to match the rate of fiscal spending of Bidenomics nor the unfunded US entitlement program now coming due.
The US presently sits on a “knife’s edge” as US Treasury yields reach levels not seen in decades, while top quartile equity valuations and leverage within the financial system are unparalleled in its history.
With earnings season and August options expiration behind us, the US now faces the potential shocks of the August 22nd BRICS “Durban Assault”, the global Central Bankers Jackson Hole Policy Summit and the concerning technical “similes” outlined in this week’s “Current Market Perspective”. It could get rocky as September is historically the worst month of the year for stocks.
WHAT YOU NEED TO KNOW
AGING DEMOGRAPHICS MEANS HIGHER INFLATION
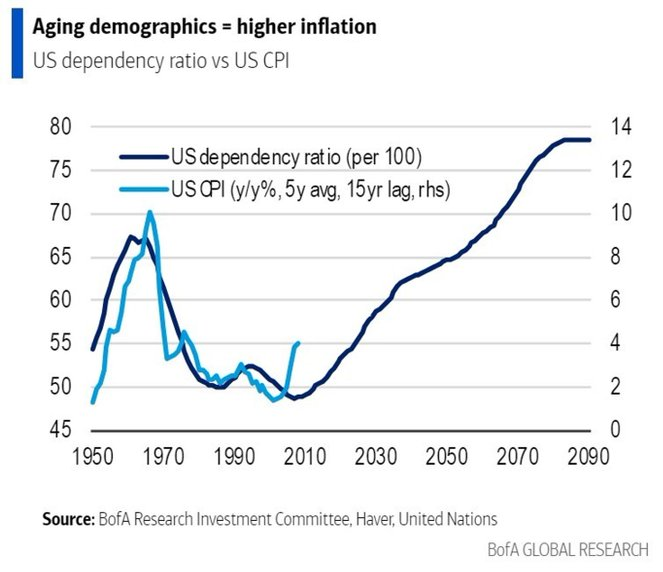 We can be assured that politicans will resort to “deficit spending” as global economies continue to slow. Infrastructure spending and expanding “reshoring” manufacturing, at a time when the working population is rapidly shrinking relative to the total, will only compound an already serious Inflation problem.
US DEBT: Who Will Buy The Exploding US Debt?
-
- The opaque offical holdings of Luxembourg and Grand Caymans seem to be mysteriously shouldering the buying of US debt supply.
REAL RATES: Why Are They Rising?
-
- Risk Duration Premiums Are Now Being demanded by global lenders.
- Rates are additionally being driven up to attract sufficent buyers of Treasury TGA supply volume.
CENTRAL BANK GOLD BUYING: What Has Shifted Central Bank Reserve Strategies?
-
- The BRICs and alliance nations (“Southern Nations”) are reducing US Treasury Holdings and Buying Gold for FX Reserves.
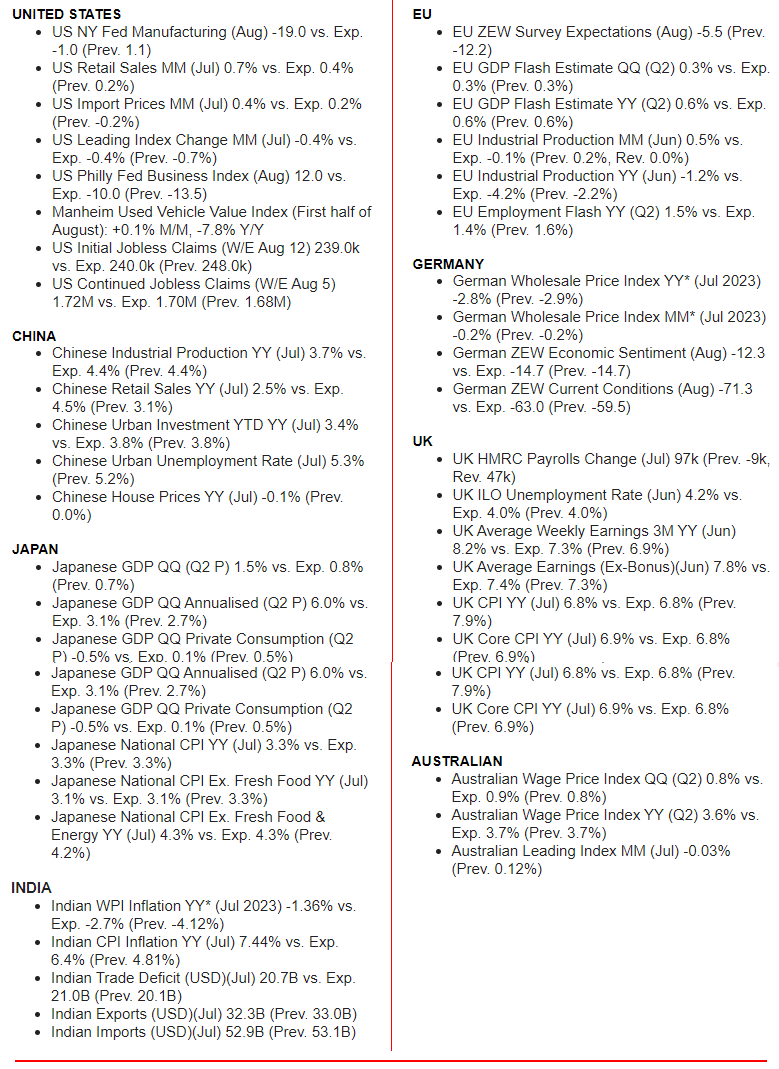
GLOBAL ECONOMIC REPORTING: What This Week’s Key Global Economic Reports Tell Us
-
- Chinese Economic Data is a significant concern — Chinese Industrial Production YY (Jul) 3.7% vs. Exp. 4.4% (Prev. 4.4%); Chinese Retail Sales YY (Jul) 2.5% vs. Exp. 4.5% (Prev. 3.1%); Chinese Urban Investment YTD YY (Jul) 3.4% vs. Exp. 3.8% (Prev. 3.8%); Chinese Urban Unemployment Rate (Jul) 5.3% (Prev. 5.2%); Chinese House Prices YY (Jul) -0.1% (Prev. 0.0%).
- US Import Prices are surging.
- Strong Retail Salesmay be short lived.
CONCLUSION
We have major reservations that the US has either the Monetary or Political leadership to face the problems before it.
US leadership in our opinion is highly unlikely to deliver anything close to approaching a “soft landing”.
-
- The Fed’s operating manual is outdated. Its “new monetary framework” is, in fact, suited for the prior decade of insufficient aggregate demand, rather than to this decade of insufficient aggregate supply.
- The Fed’s landing zone is questionable, because the inflation target it is pursuing may well be too low, given current structural and secular realities.
- With its excessive focus on immediate conditions, the Fed could end up neglecting the future wind patterns that it will encounter as its altitude changes.
- It initiated its landing sequence late, following a long period in which it had mischaracterized inflation as “transitory” before finally implementing an intense cycle of rate hikes.
- It is not clear whether the Fed has learned enough from its forecasting and communication mistakes to make the necessary course corrections.
A “hard landing” or worse is the high probability outcome in 2024.
Be prepared! Plan for the worst, but hope for the best”.
US DEBT: Who Will Buy The Exploding US Debt?
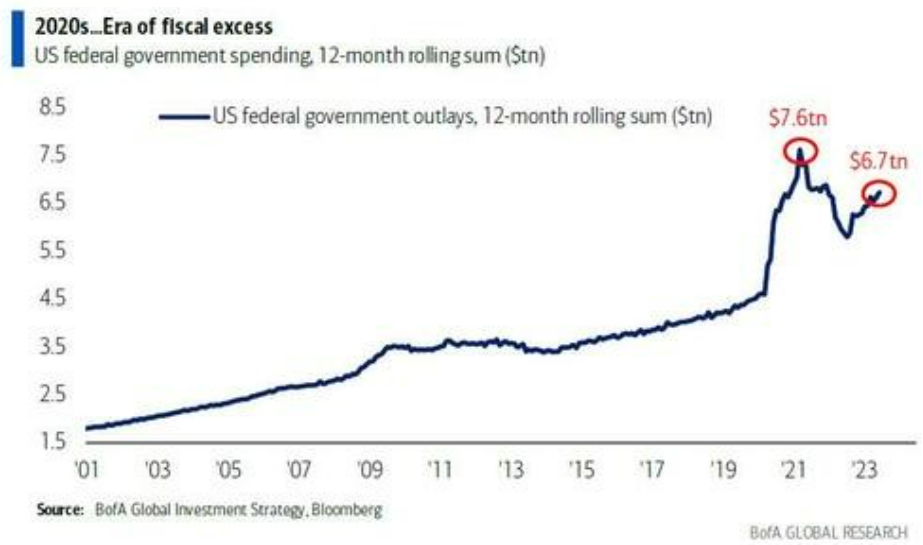
 BIDENOMIC SPENDING
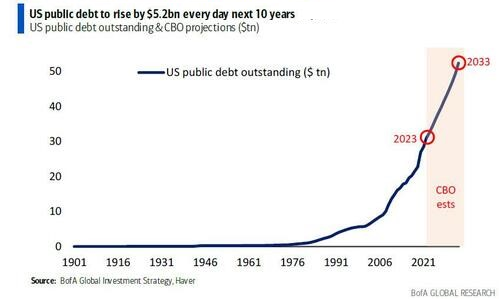
The explosion in US government debt since the Biden Administration implemented its Bidenomic Economic Strategy has been nothing short of historical, unprecdented and just plain shocking. The world has yet to fully grasp what the fall-out will be.
The immediate impact has been inflation levels not seen since the 1970’s. What is still unfolding is who is going to buy the massive increase in US government debt and at what yield?
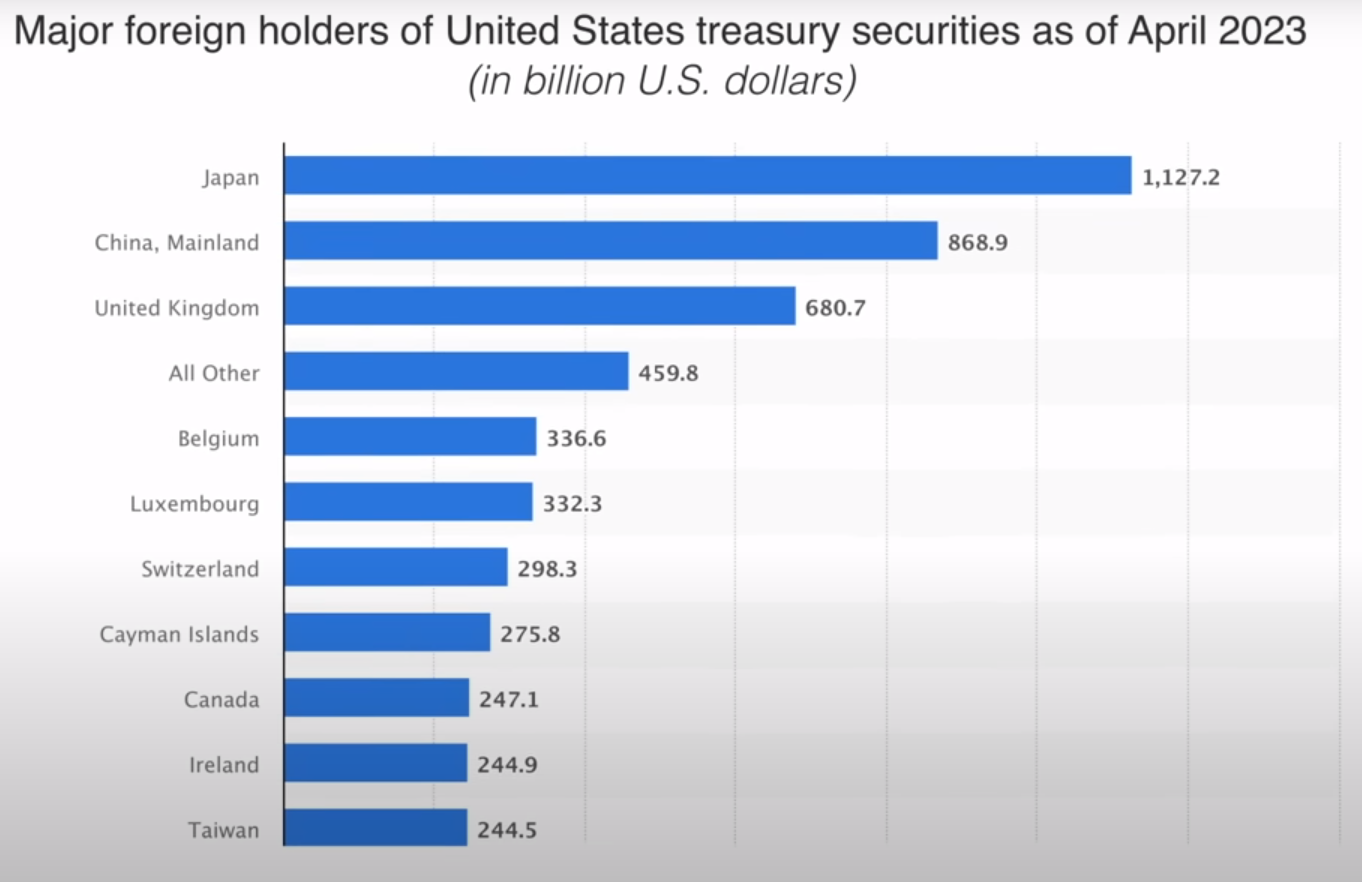
WHO IS BUYING?
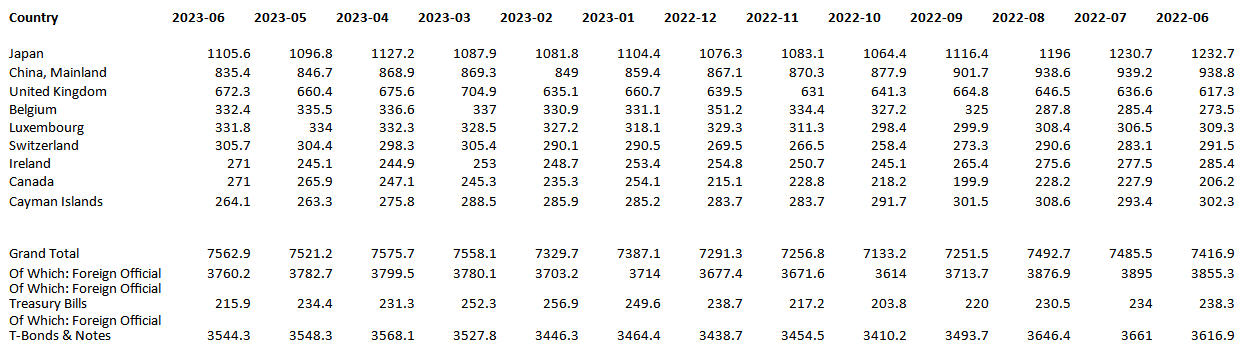
After three years of Bidenomic spending we are already seeing the beginnings of a global reaction in the buying of US government debt securities. Below is a chart of the major official foreign holders of US Treasury secuities as of April 2023.
What this chart doesn’t show is how the makeup is changing.
FALLING RATE OF PURCHASE OF US DEBT BY MAJOR BUYERS
In the table below we show the latest release so we can contrast the change in the last 60 days alone! The top four are all down, but this needs to be placed in the context of how much the top two as well some others have fallen in the last year.
Japan: From 1232.7 to 1105.6 = -127or -10.3%
China: From 938.8 to 835.4 = -103.4B or -11.0%
But this even hides the real story unless we look back further. Bidenomics is naively being overlaid onto the US having agressively weaponized the use of the US Dollar as a big stick of foreign policy. Those impacted have been steadily adjusting their FX Reserve dependency on the US$ and the holding of those reserves in the form of US Treasuries. (We ouline in the following section who the major players are in regard to how they are shifting to the buying of gold for their FX reserves).
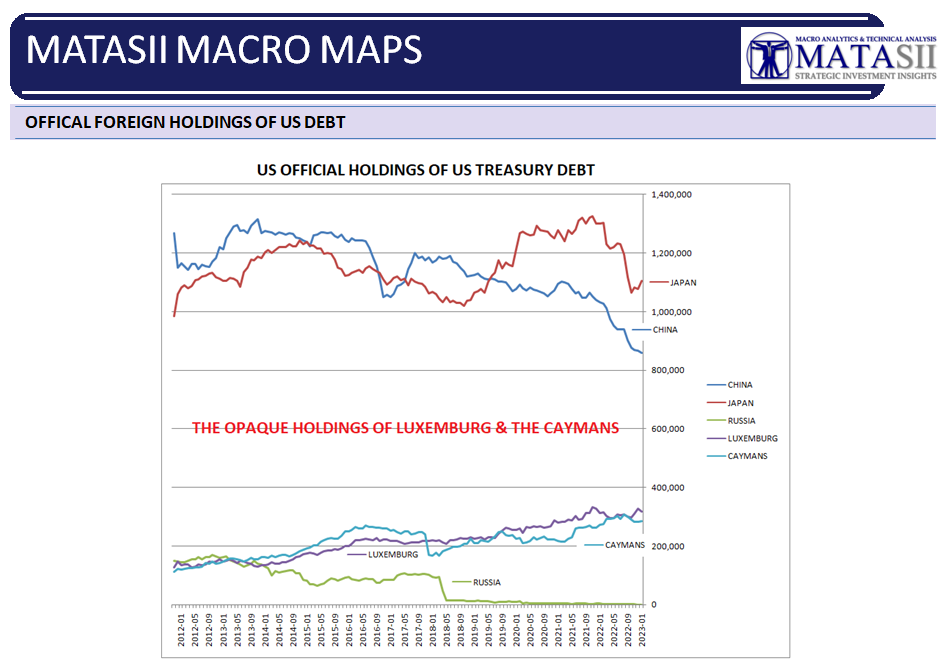
THE MYSTERIOUS LUXEMBOURG & GRAND CAYMAN BALANCING
What the chart below illustrates is how mysterious it is that when the US Treasury has experienced major draw downs in the the holdings of US Treasuries, it has been offset by an equal amount being increased through the shrouded mysteries buying of Luxembourg and the Grand Cayman Islands.
If you compare the longer term draw downs of specifically China and Russia, they are almost exactly matched by longer term increases in Luxembourg and the Grand Caymans. No one has offred a realistic explanation to this.
Something else no one has offered ia satisfactory answer to and is also shrouded in mystery is the missing $80T reported by the Bank of International Settlements (BIS) in FX Swaps and Forwards. (Links To Learn More).
Somehow today, despite De-Dolarization advances, the US has been able to sell its US Treasury debt. How long this will continue is a very important question that no one yet has an answer to.
THREE CHARTS BELOW (Click to enlarge to see trend)
The three charts below reflect the auction buying activities of US Treasury Debt. What stands out is that the US is now almost completely dependent on US foreign buying of its debt. Such a dependency historically never ends well for the lending nation! (NOTE: Foreign buying occurs through “indirects” at auction.)
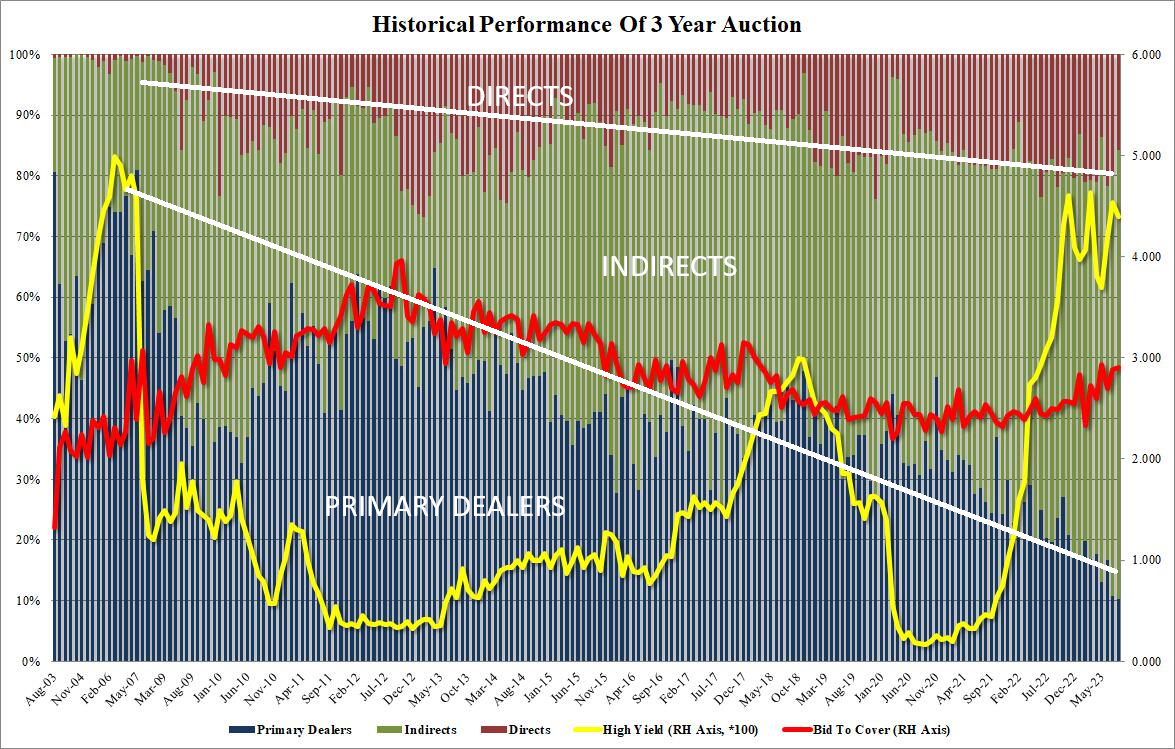
3YR AUCTION: USD 42bln of 3yr notes (prev. 40bln) on Aug 8th
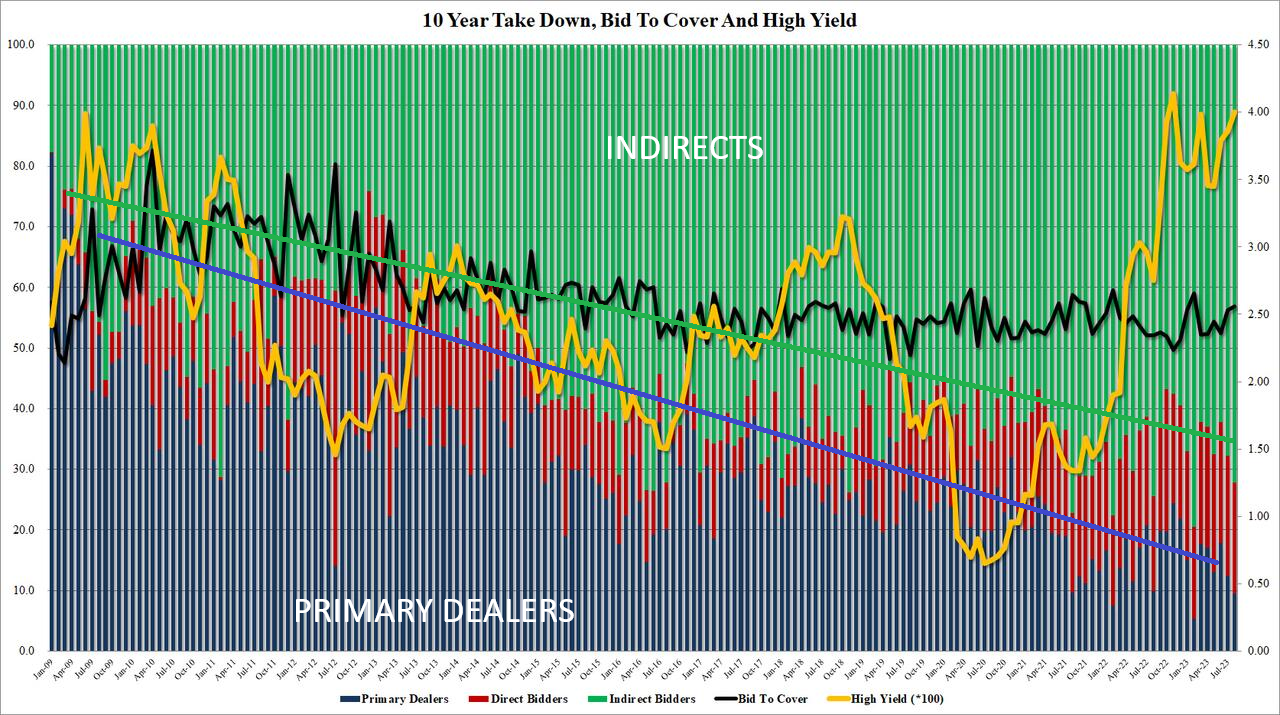
10YR AUCTION: USD 38bln of 10yr notes (prev. 35bln) on Aug 9th
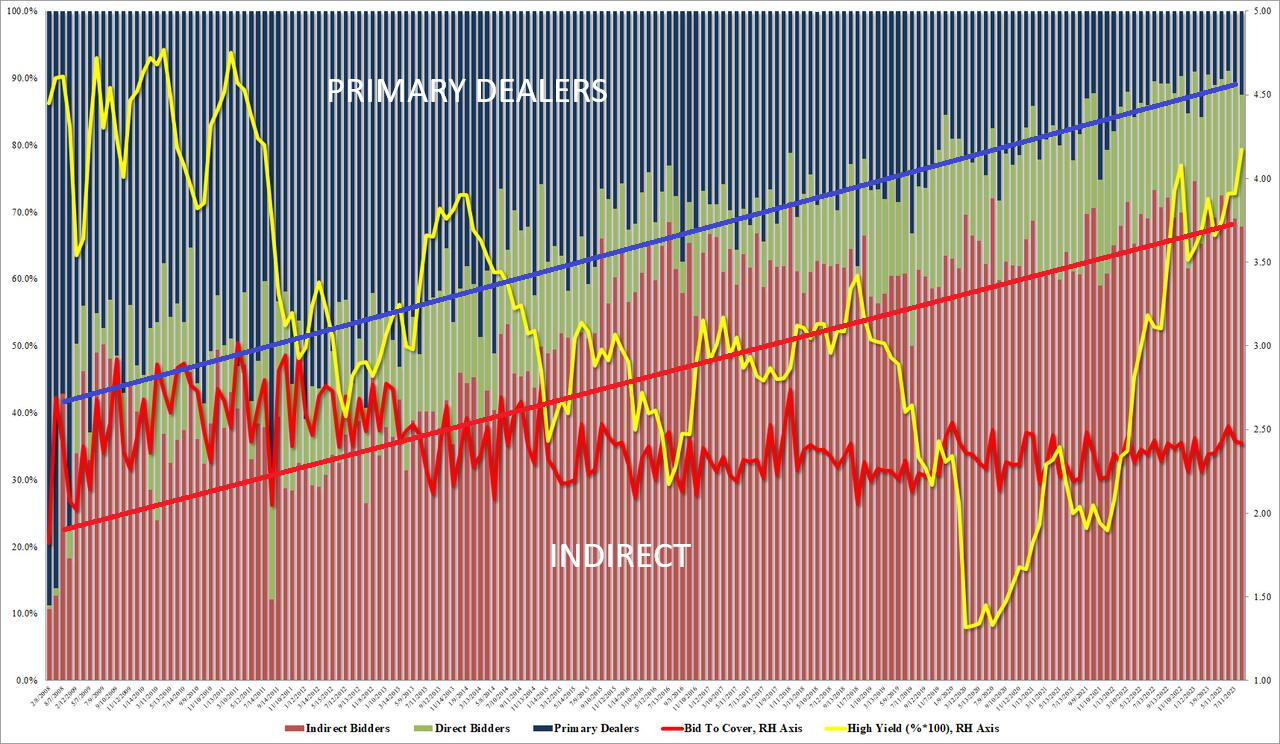
30YR AUCTION: USD 23bln of 30yr bonds (prev. 21bln) on Aug 10th
REAL RATES: Why Are They Rising?
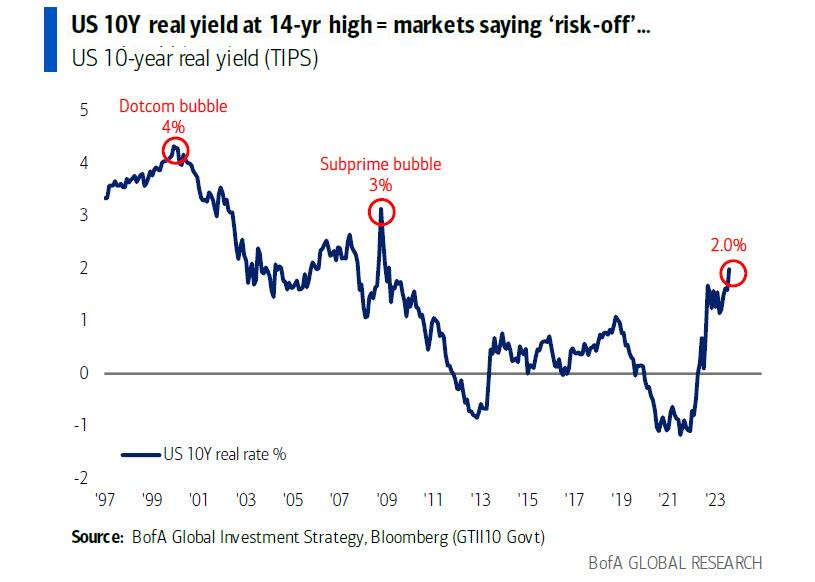
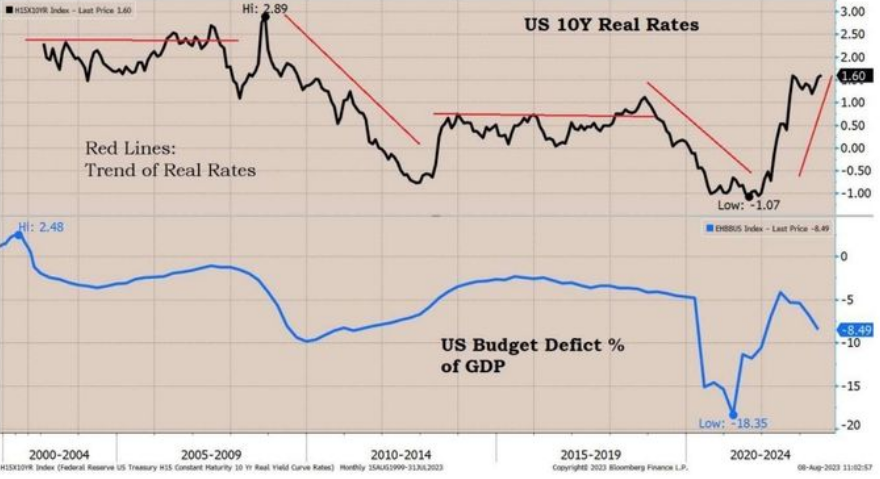 Though inflation and inflation breakevens have been coming down, Treasury Note and Bond prices have been rising. This is because Real Rates have been rising.
Global Real Rates have been on the rise for a number of reasons. Currently part of the short term reason is because of enthusiastic growth perspective of a US “Soft Landing”.
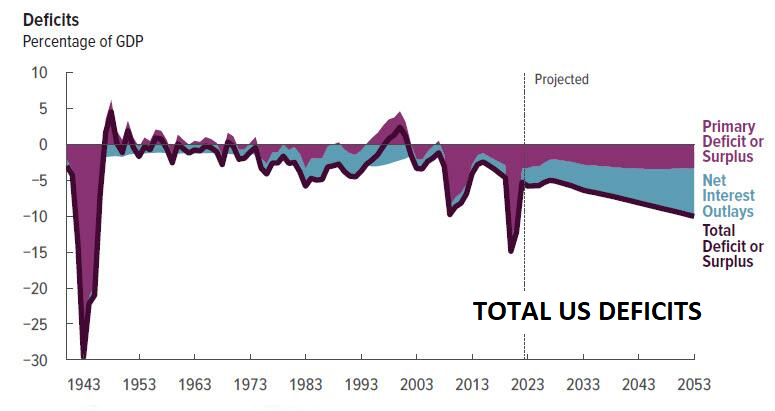
However, as the chart to the right illustrates, 10Y Real Rates intermediate to longer term have a strong correlation with US Budget Deficits as a
percentage of GDP. This suggests rates are high for a reasson and may be headed even higher.
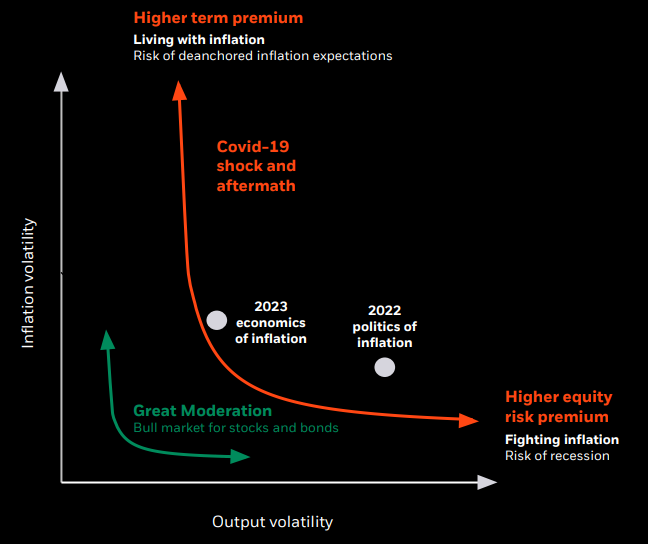 We have been arguing for some time that rates would rise in the post Great Moderation era as higher Risk Duration Premia are demanded by borrowrs. The downgrade of US debt by Fitch to AA+ suggests risk has increased and therefore holders need to be rewarded with higher rates.
FISHER’S EQUATION
Bond King Bill Gross believes 4.5% 10Y Nominal with Inflation at 3% means a 1.5% Real Rate longer term.
We are in the same camp, though we believe something serious will break, as rates move above 4.3% towards a possible 4.5% level. The US real estate market alone is likely unable to support mortage rates north of 7% for very long.
THIS IS AN IMPORTANT MARKET LEVEL
 CENTRAL BANK GOLD BUYING: What Has Shifted Central Bank Reserve Strategies?
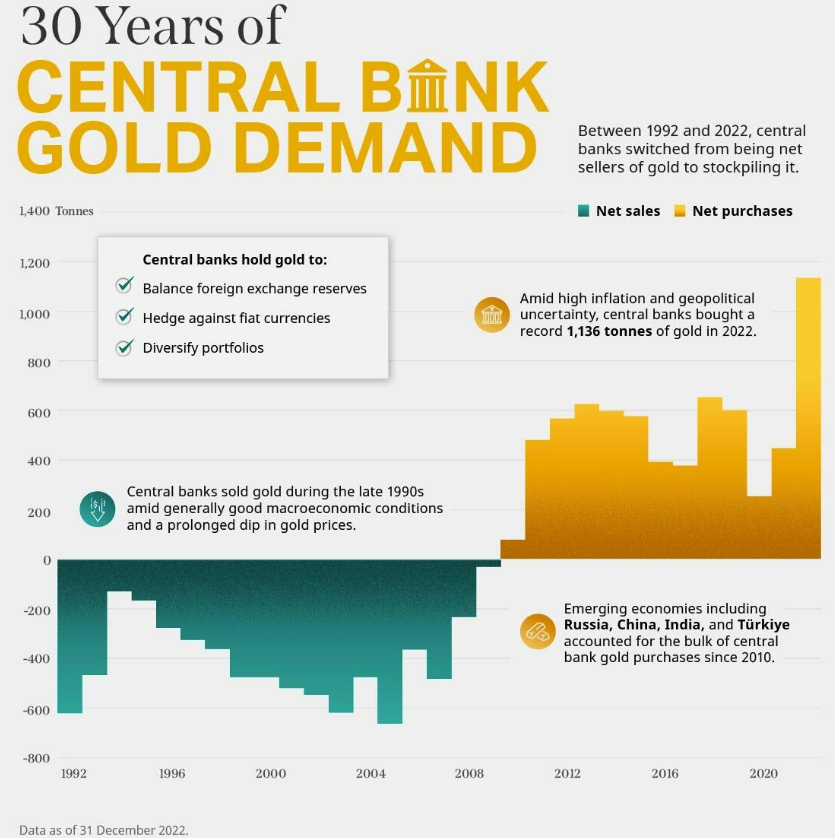
HAS SHIFTED FROM LEASING TO SELLING TO ACCUMULATION
In the 1980’s and 90’s large central banks holders of gold leased their gold. The most predominant player participating in leasing was the US with the largest gold holdings at the time. That gold is still on the books of the US, though the gold has likely been consumed as Jewelry, leaving the US with an IOU ilikely n US dollars.
In the 1990’s and the first decade of the new millennia many central banks sold their gold. The most notable of the major palyers was the UK
As the chart to the right and below show, since the 2008 Financial Crisis central banks have been accumulators of gold ……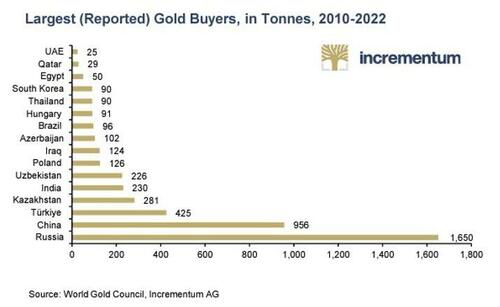
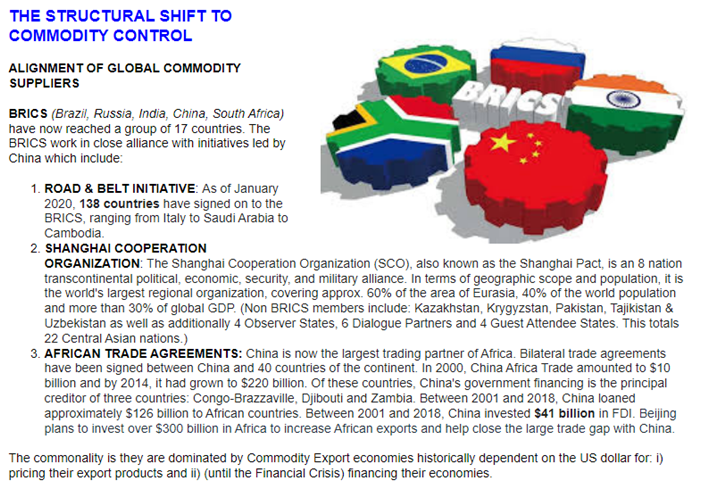
…… dominated by the BRICS and their close allies through various organixzation such as the Shanghai Cooperation Agreement.
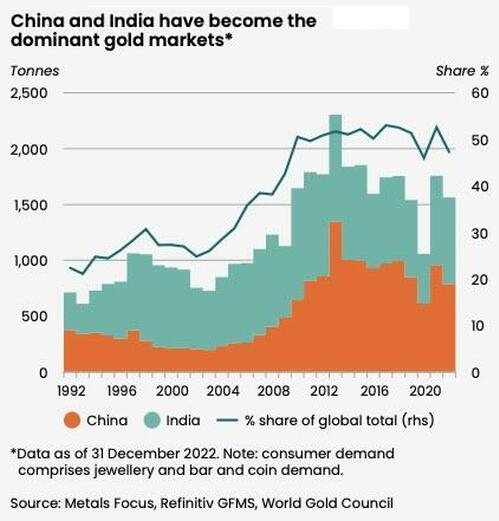 CHINA AND INDIA DOMINATE GOLD MARKETS
CHINA: The People’s Bank of China was the biggest gold buyer in H1, adding 103 tons of gold to its official holding. The PBOC reported that it bought 23 tons of Gold for the 9th straight month of purchases. The total rose to a record 2,137 tons The bullion held by the People’s Bank of China rose by 740,000 troy ounces, or about 23 tons, bringing the country’s total stockpile to a record 2,137 tons.
TURKEY & MIDDLE EAST: Extremely strong demand for physical gold in Q2 was reported for Turkey and more broadly in the Middle East. This helped drive gold coin and bar demand higher.
Investment demand for physical gold was up by 20% in the second quarter compared to last year, continuing a trend over the last 12 months. This helped push overall gold demand up 7% year on year when including over-the-counter (OTC) sales and stock flows.
 WHERE IS THE MONEY COMING FROM TO BUY GOLD?
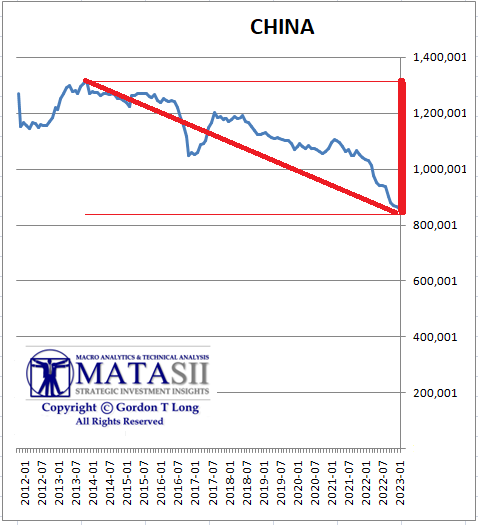
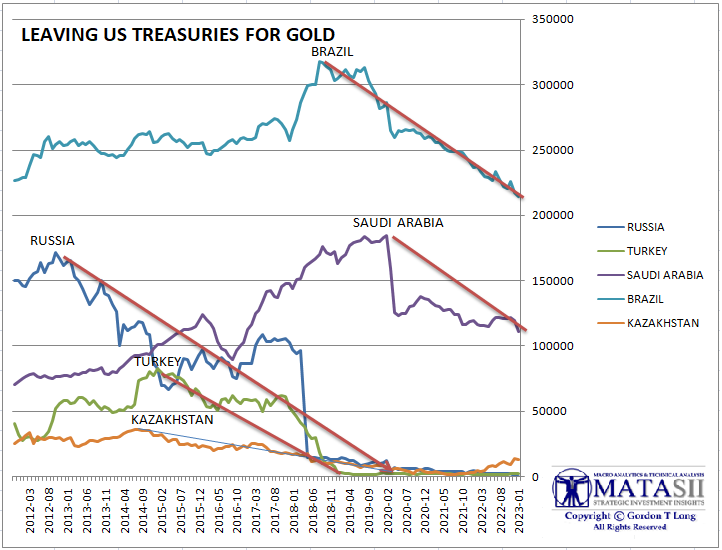
To answer that question we only need to examine the falling US Treasury holdings of the BRICS members in relationship to their purchases of gold.
The primary two major sellers of US Treasuries for Gold are China and Russia.
As the chart below shows, Russia now has zero holdings of US Treasuries for their FX Reserves.
The chart below highlights the more significant players steadily moving from holding US Treasuries to fund increasing their gold reserves.
GLOBAL ECONOMIC REPORTING: What This Week’s Key Global Economic Reports Tell Us
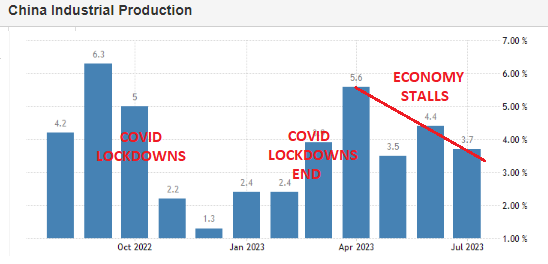 CHINA
CHINA
- Chinese Industrial Production YY (Jul) 3.7% vs. Exp. 4.4% (Prev. 4.4%)
- Chinese Retail Sales YY (Jul) 2.5% vs. Exp. 4.5% (Prev. 3.1%)
- Chinese Urban Investment YTD YY (Jul) 3.4% vs. Exp. 3.8% (Prev. 3.8%)
- Chinese Urban Unemployment Rate (Jul) 5.3% (Prev. 5.2%)
- Chinese House Prices YY (Jul) -0.1% (Prev. 0.0%)
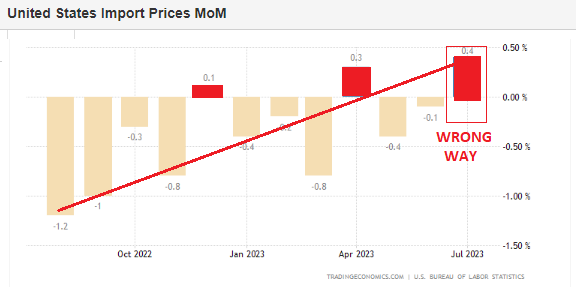 US Import Prices MM (Jul) 0.4% vs. Exp. 0.2% (Prev. -0.2%)
-
- Import prices for July rose 0.4% M/M (exp. +0.2%) after declining 0.1% the prior month, while export prices rose 0.7% (prev. -0.7%), exceeding the expected +0.2%. Imports rose for only the second time in 2023 and were largely driven by higher fuel prices (+3.6%).
- Meanwhile, the advance in exports was the greatest monthly increase since a 1.1% rise in June 2022.
- Higher prices in July for both agricultural and nonagricultural exports contributed to the overall advance.
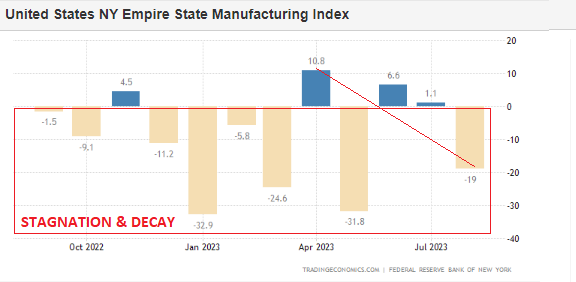 US NY Fed Manufacturing (Aug) -19.0 vs. Exp. -1.0 (Prev. 1.1)
-
- The NY Fed’s Empire State Manufacturing Survey index, the first regional mfg. survey of the month, fell to -19.0 in August from July’s +1.1, a larger fall than the expected -1.0, failing to notch a third consecutive positive reading for the first time since late 2021 and reflective of the index’s volatility.
- Regardless, the overall trend has remained suppressed over the last year or so, with 3m, 6m, and 12m averages all in negative territory.
- Looking within, new orders and shipments saw big declines. While delivery times were steady and inventories moved lower.
- Labour market indicators pointed to steady employment levels but a shorter average workweek.
- Input and selling price increases picked up and capital spending plans firmed somewhat.
- Looking ahead, firms grew more optimistic about the six-month outlook with new orders, shipments and employment, all expected to see noticeable increases, but with it, so are price pressures.
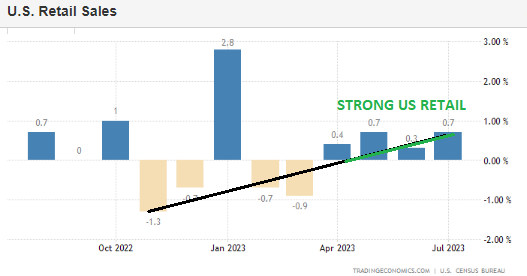 US Retail Sales MM (Jul) 0.7% vs. Exp. 0.4% (Prev. 0.2%)
-
- The headline retail sales rose by 0.7% in July, accelerating from the upwardly revised 0.3% and above expectations of 0.4%, matching the highest analyst forecast.
- The core measure, ex-autos, rose 1%, above the 0.4% expected and 0.2% prior, and was above all analyst forecasts.
- The super core, ex-gas and autos, rose 1% (prev. +0.4%), while the control metric, which feeds into the GDP numbers, was also hot, rising 1.0% (exp. 0.5%, prev. 0.5%).
- The strong data, alongside import and export prices data, saw the Atlanta Fed GDP Now estimate for Q3 be revised up to 5.0% from 4.1%, previously.
- Meanwhile, ING highlight data indicates a 3% annualised GDP growth rate is possible for Q3, but looking ahead ING warn that “higher consumer borrowing costs, reduced credit availability, the exhausting of pandemic-era savings and the restart of student loan repayments pose major challenges for fourth quarter activity”.
- Looking into the report, the nonstore retailers saw the largest jump (+1.9%), with analysts suggesting this is likely due to Amazon’s July prime day.
- Elsewhere, sporting goods, hobbies, musical instruments, & bookstores saw a 1.5% gain, while food services and drinking places rose by 1.4%. On the flipside, furniture & home furniture stores declined by 1.8% M/M and electronic and appliance stores fell 1.3%.
- There was little reaction to Fed pricing on the data with the Fed aware of the resilient US economy, while a lot of their attention is on inflation.
- Meanwhile, many on the FOMC are cognizant of the lagged effects of monetary policy and have been expecting a slowdown in the future, but not so much that it causes a recession.
GLOBAL MACRO
WHAT DOES YOUR SCAN OF THE DATA BELOW TELL YOU? – THE MEDIA AVOIDS BAD NEWS!
We present the data in a way you can quickly see what is happening.
THIS WEEK WE SAW
Exp=Expectations, Rev=Revision, Prev=Previous
CONCLUSION
 We have major reservations that the US has either the Monetary or Political leadership to face the problems before it. Even rating agency FITCH, when it announced the downgrade of US credit, specifically stated:
In Fitch’s view, there has been a steady deterioration in standards of governance over the last 20 years, including on fiscal and debt matters, notwithstanding the June bipartisan agreement to suspend the debt limit until January 2025. The repeated debt-limit political standoffs and last-minute resolutions have eroded confidence in fiscal management. In addition, the government lacks a medium-term fiscal framework, unlike most peers, and has a complex budgeting process. These factors, along with several economic shocks as well as tax cuts and new spending initiatives, have contributed to successive debt increases over the last decade. Additionally, there has been only limited progress in tackling medium-term challenges related to rising social security and Medicare costs due to an aging population.
US leadership in our opinion is highly unlikely to deliver anything close to approaching a “soft landing”.
-
- The Fed’s operating manual is outdated. Its “new monetary framework” is, in fact, suited for the prior decade of insufficient aggregate demand, rather than to this decade of insufficient aggregate supply.
- The Fed’s landing zone is questionable, because the inflation target it is pursuing may well be too low given current structural and secular realities.
- With its excessive focus on immediate conditions, the Fed could end up neglecting the future wind patterns that it will encounter as its altitude changes.
- It initiated its landing sequence late, following a long period in which it had mischaracterized inflation as “transitory” before finally implementing an intense cycle of rate hikes.
- It is not clear whether the Fed has learned enough from its forecasting and communication mistakes to make the necessary course corrections.
A “hard landing” or worse is the high probability outcome in 2024.
Be prepared! Plan for the worst, but hope for the best”.
MARKETS ARE ACTING WORRIED?
BIGGER MARKET DROPS OCCUR FROM AN ALREADY FALLING MARKET!
Click All Charts to Enlarge
1 – SITUATIONAL ANALYSIS
Both the Equity and Bond Markets have been feeling the pain since late July following a postive earning season, punctuated by “Selling the News” on earning “Beats”. This is normally a clear warning that markets are looking to consolidate at lower support levels. This is what the markets are looking at:
-
- SPX now down 5% in three weeks
- SOX, NYFANG, Magnificent 7 off >10% from highs
- US Real yield 2.0% (14-year high)
- Equity Risk Premium 39bps (19-year low)
- US 30-year mortgage 7.6% (23-year high)
- US-China yield spread 150bps (16-year high)
- Equity Put/Call Ratio surged to 1.03 (highest since SVB)
- FMS investors are now the least bearish on risk since Feb’22, e.g. cash levels sharply lower 5.3% to 4.8%.
What is most concerning is that this could easily get out of control if initial support levels fail to hold. What to watch for is a catalyst that potentially triggers fear when a market is already nervous and in a precarious position. The trigger is any incremental increases spiking yields decisively over 4.3% (globally hit a new 15 year high this week) or negative news out of China. Either is likely to translate almost instantly into new waves of selling?
We examine below what may suddenly increase market fear levels and what initial supports are to be heeded.
 EQUITY & BOND MARKETS FEELING THE PAIN
I am not a particular fan of market ‘similes’, but I have to admit two have caught my attention.
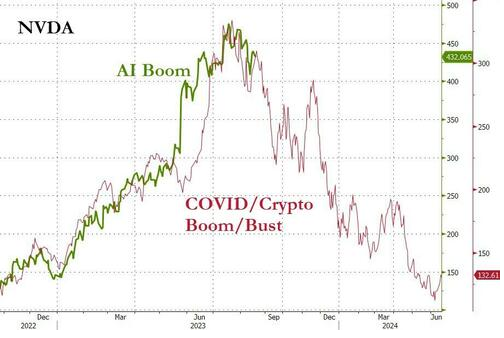
NVIDIA
The first is the chart to the right comparing AI leader Nvidia to the collapse of the Covid/Crypto Boom. The comparison has been tracking extremely close for some time now.
Next Wednesday August 23rd NVDA will release its well anticipated earnings for this quarter. The market smells fear!
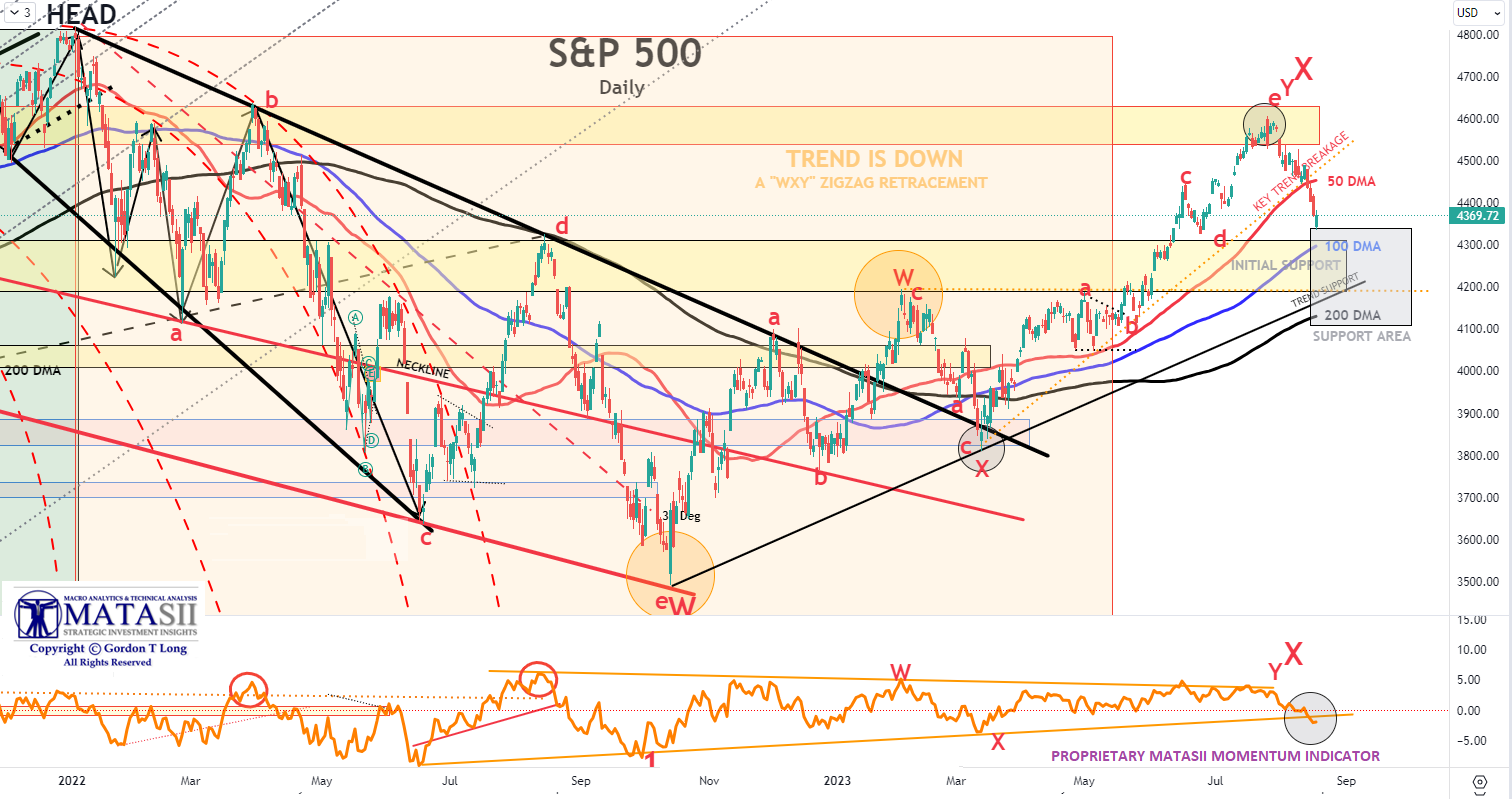
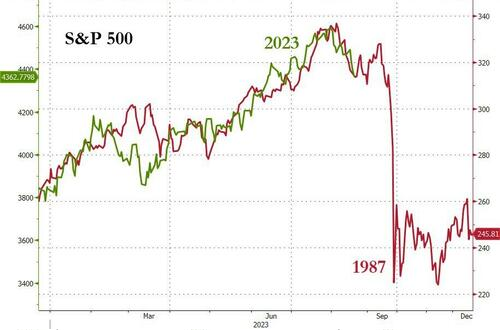 S&P 500
The second is the chart to the right comparing the S&P 500 to the run-up to the sudden market collapse of 1987.
Uncertainty in Currencies and Yields similar to what we are experiencing today were quite prevalent then also. It was abrupt as the market was caught unexpectantly – simiiar to what may occur next week coming out of the Annual Jackson Hole Monetary Conference. Chairman Jay Powell will deliver his address on Friday.
Together they have the potential to catalyse potential market moves in nervous equity and bond markets, both currently under stress.
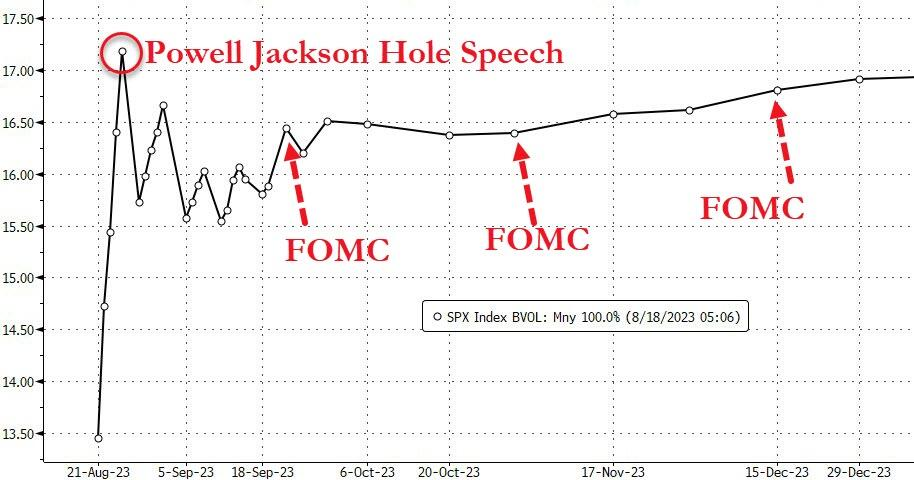 VOLATILITY TERM STRUCTURE
The particulary nervous US Treasury Market is already reflecting this.
The S&P volatility term structure is also starting to fear it. (chart right)
When volatility rises, equity markets normally fall. Markets fall the greatest when they are already in a sharply falling trend, as is happening (see S&P 500 chart below).
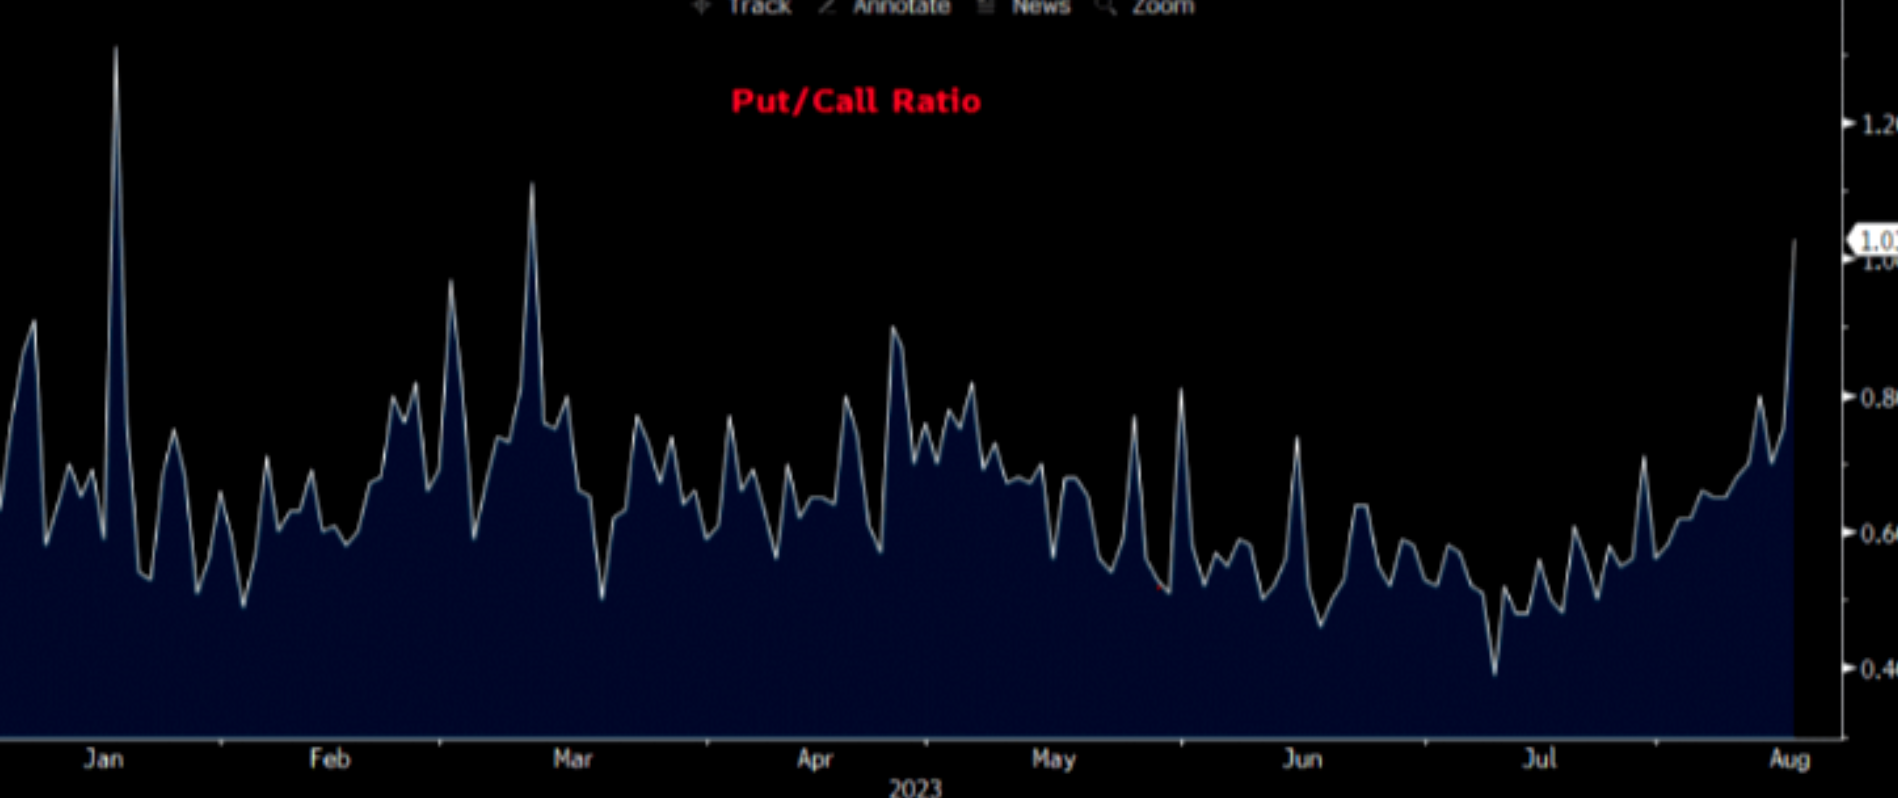
The Put/Call Ratio spike has reached the highest level since March at 1.03 (highest since SVB ).
This is a bad sign if stocks can’t hold here.
Of note is how quickly market sentiment has reversed and the Out/Call Ratio has risen.
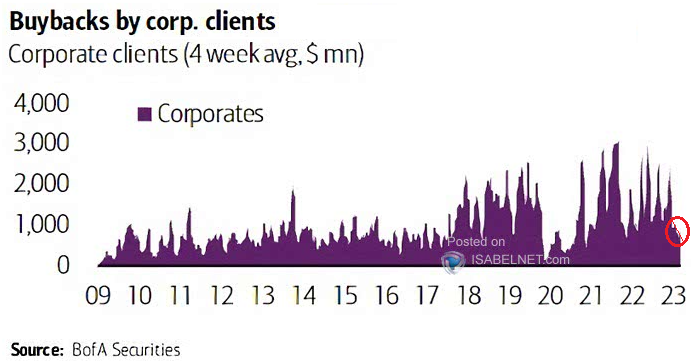
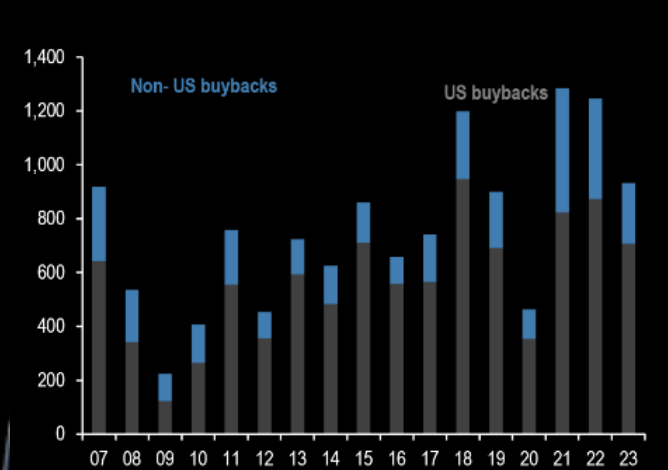
Buybacks are steadily weakening against authorization levels.
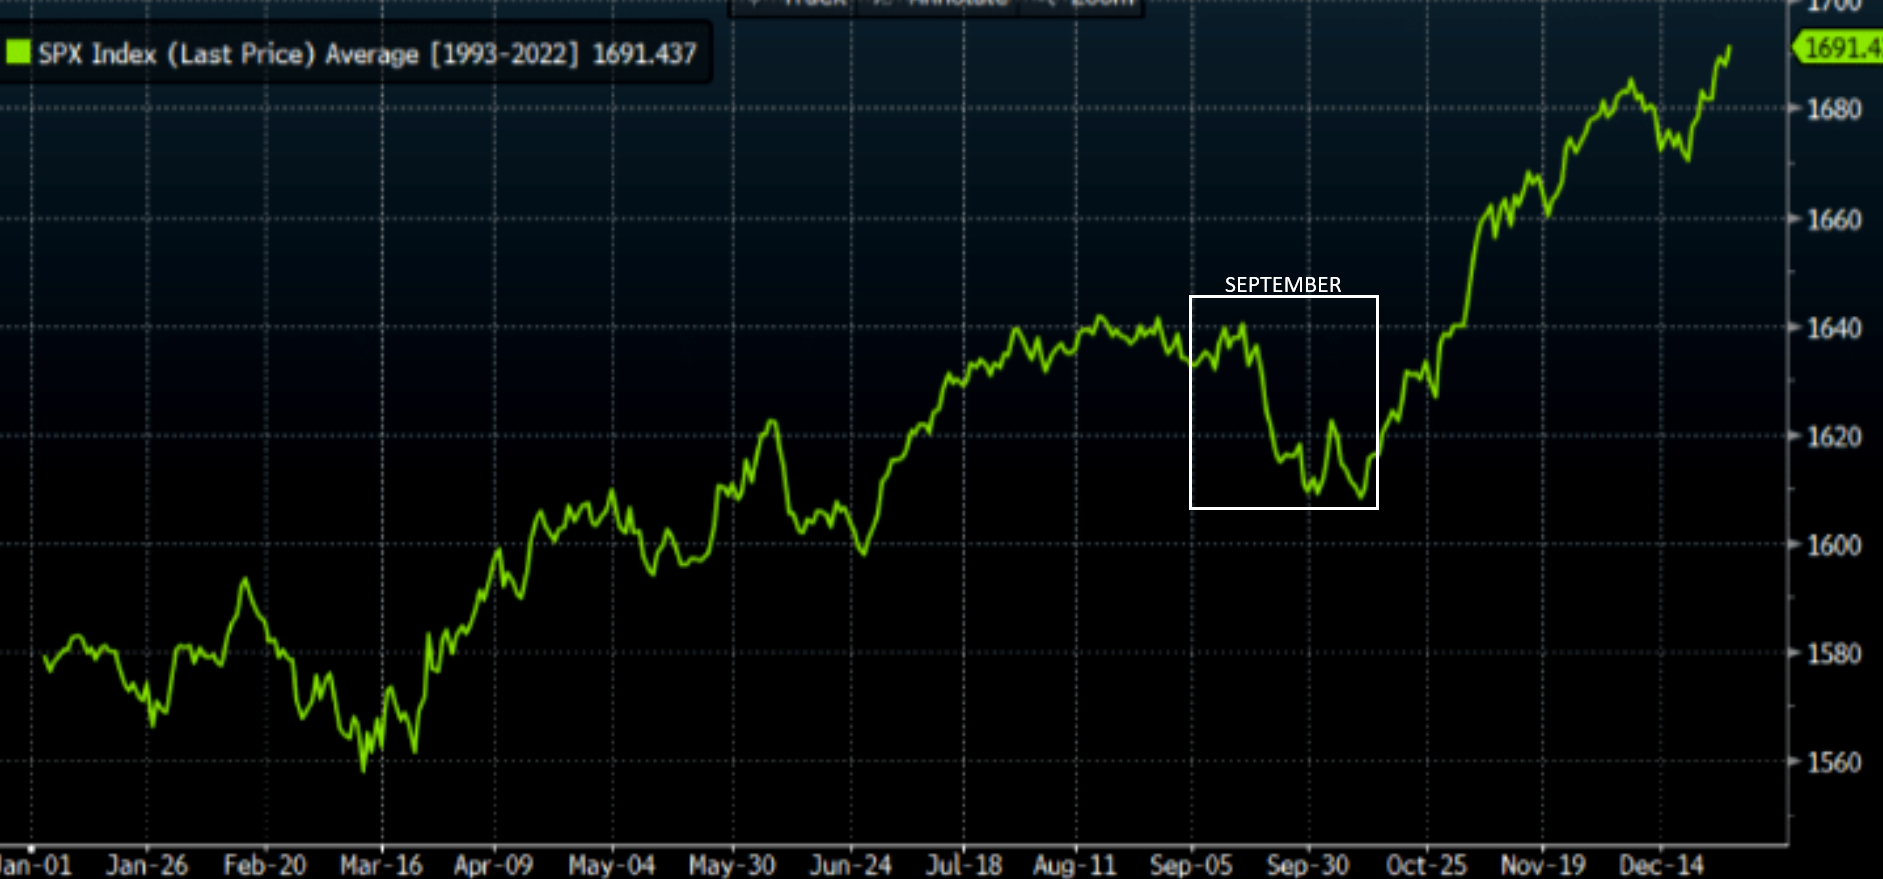
September is a Seasonally poor month for the equity markets. The chart shows the intra-year seasonality of S&P over the past 30 years. In this illiquid and news-slow August, this might be the most important chart to explain current price action and also zeitgeist. (Everyone agrees that we should trade down but very few think we have peaked for the year).
2 – FUNDAMENTAL ANALYSIS
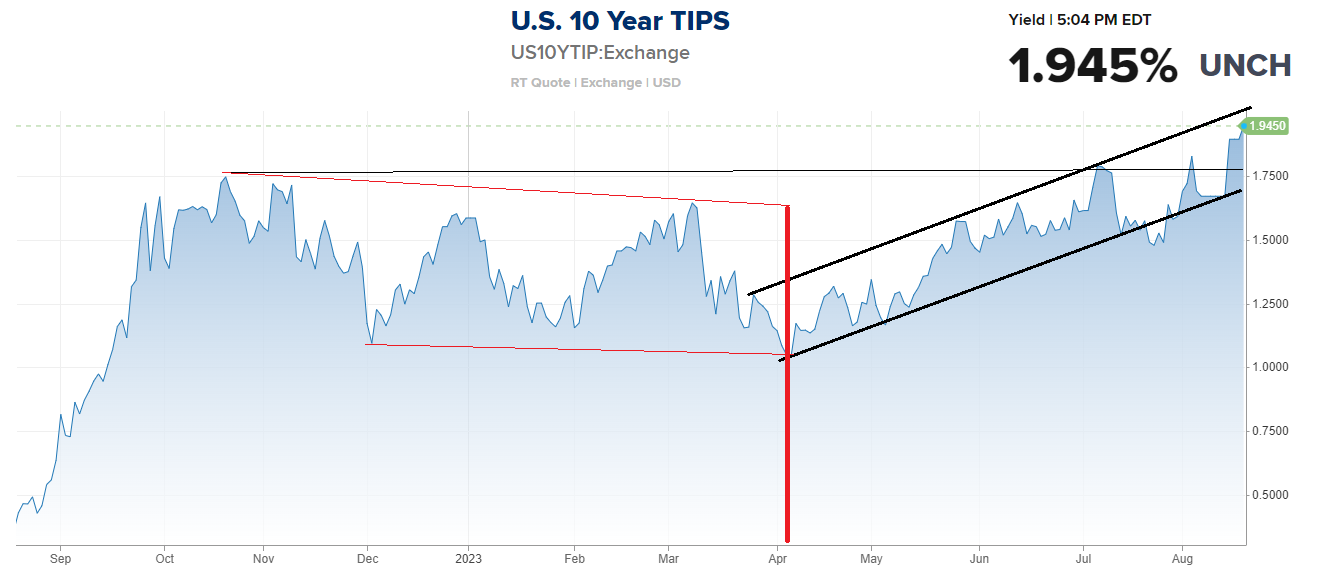
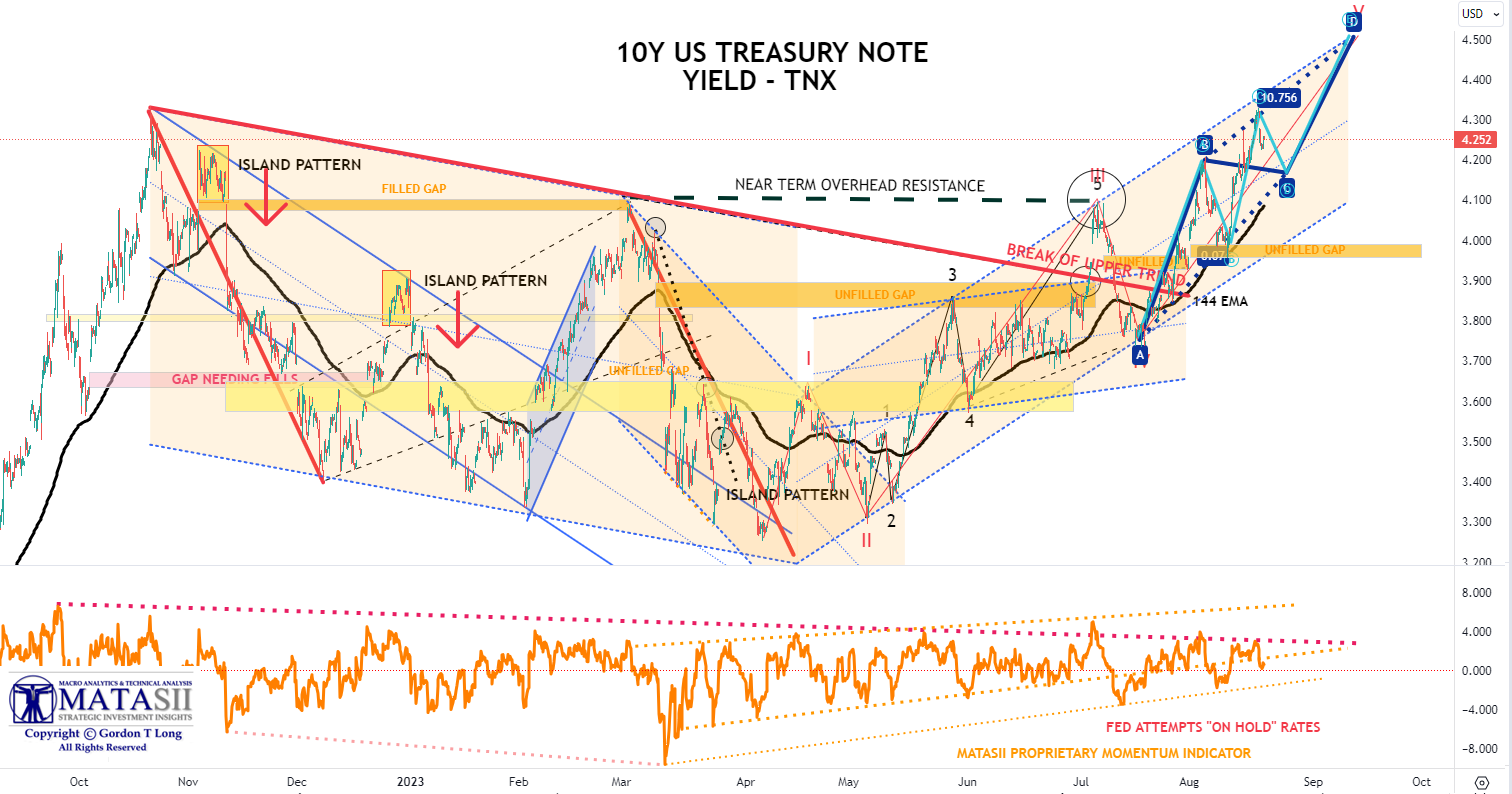
Markets don’t react well to rising interest rates. This week we saw a major spike in rates, as reflected below in the yeild for the 10Y US Treasury Note.
It has tracked our prediction very closely. One of the reasons for our accuracy is in predicting a rise in Real Rates (see chart right).
THIS IS AN IMPORTANT MARKET LEVEL
Though we feel Real Rates are going higher and will take interest rates with them, we see a consolidation pull-back close at hand.
YOUR DESK TOP / TABLET / PHONE ANNOTATED CHART
Macro Analytics Chart Above: SUBSCRIBER LINK
3 – TECHNICAL ANALYSIS
S&P 500 COUNT
YOUR DESK TOP / TABLET / PHONE ANNOTATED CHART
Macro Analytics Chart Above: SUBSCRIBER LINK
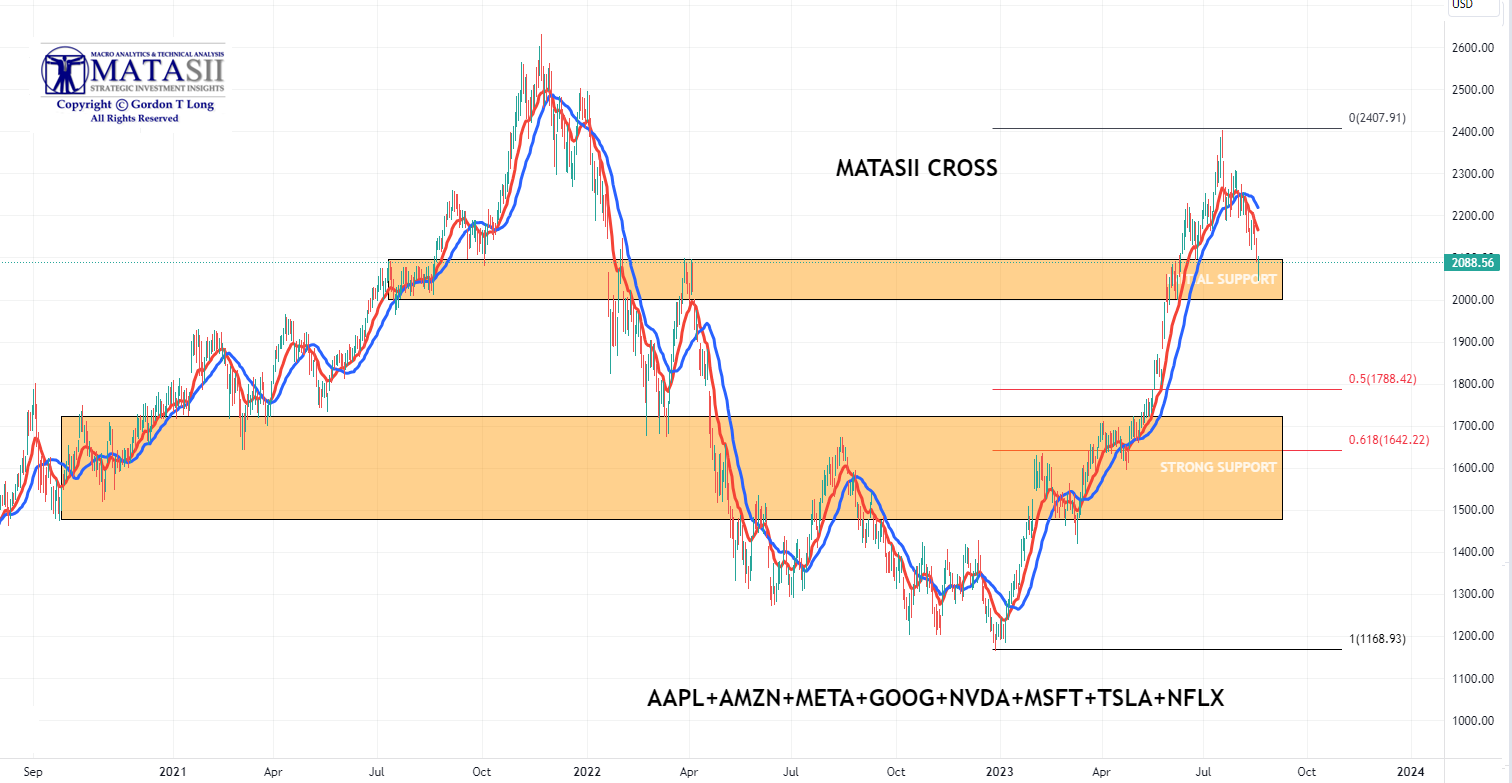
MAGNIFICANT SEVEN – MATASII CROSS – DAILY
The Daily proprietary MATASII CROSS is now signaling a SELL for the “MAGNIFICANT SEVEN”. The weekly (NOT SHOWN) is still a BUY, so we need to see how well the lower support area holds to determine whether the Weekly signal confirms further lower prices. Prices are now within the initial support band for the “Magnificant Seven”.
MATASII’S “REPRESENTATIVE” INDEXES
The following charts have been updated since we highlighted them during the height of the Q2 earnings. They feature the charts for the representative companies’ earnings of two sectors and the overall S&P 500.
The importance of these charts is in assisting with:
i) The further identification of the intial support level for the equity markets &
ii) If Initial support levels are violated.
WHAT WE LAST WROTE:
The three takeaways from the chart are:
-
- All stocks have headed lower since their earnings were announced, even though their earnings were all “beats” or inline with “expectations”. It was a classic “Buy the Rumor, Sell the News” in earnings season we haven’t seen for awhile.
- Once the dotted vertical lines were broken the downward momentum only accelerated.
- Though the EW counts are different for all three, they all point to lower consolidation levels (or worse).
WHAT HAS OCCURRED
-
- We have had the drop we expected, but all areas are near their individual initial support levels. Watch each closely for violations.
YOUR DESK TOP / TABLET / PHONE ANNOTATED CHART
Macro Analytics Chart Above: SUBSCRIBER LINK
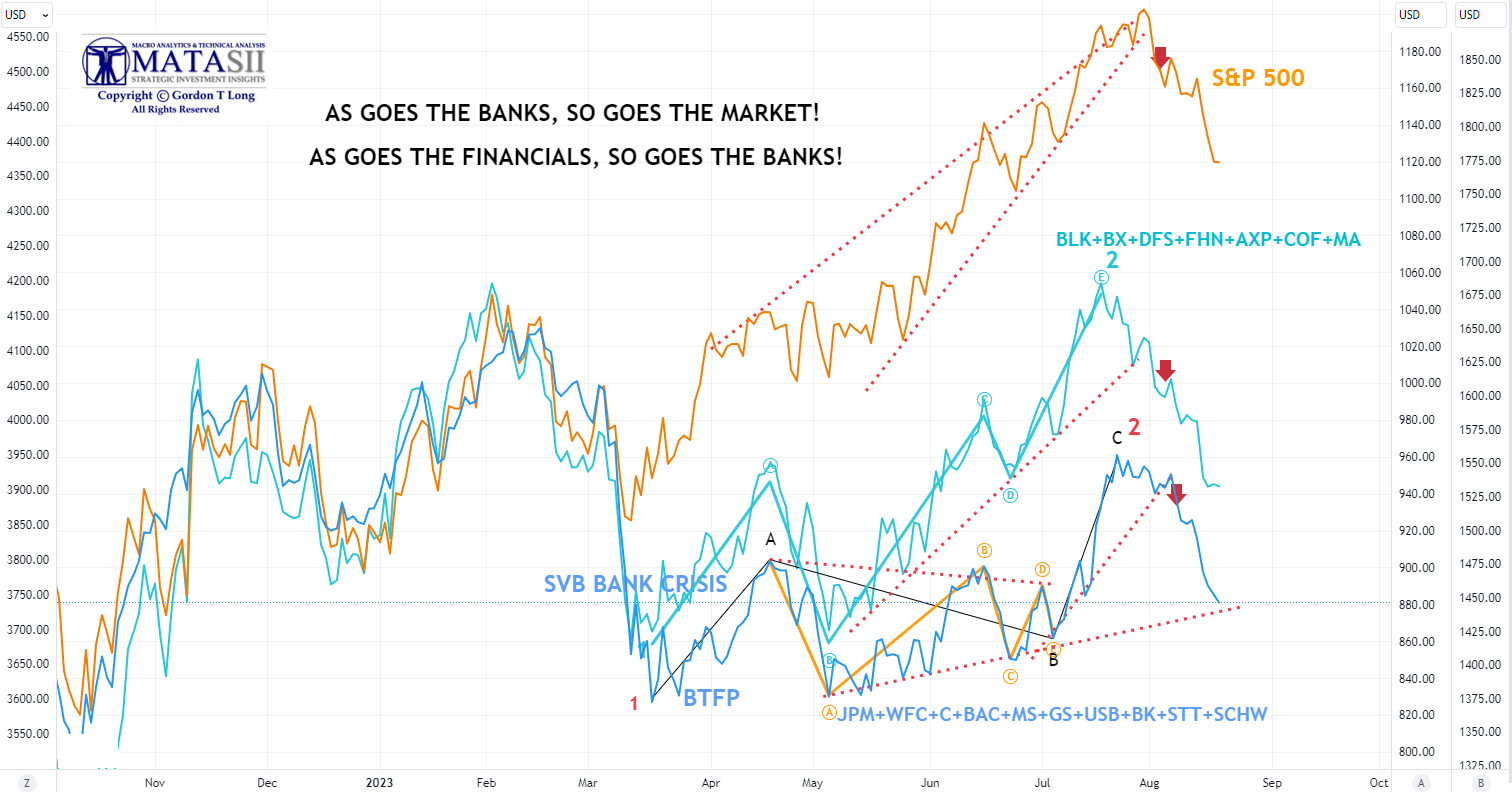
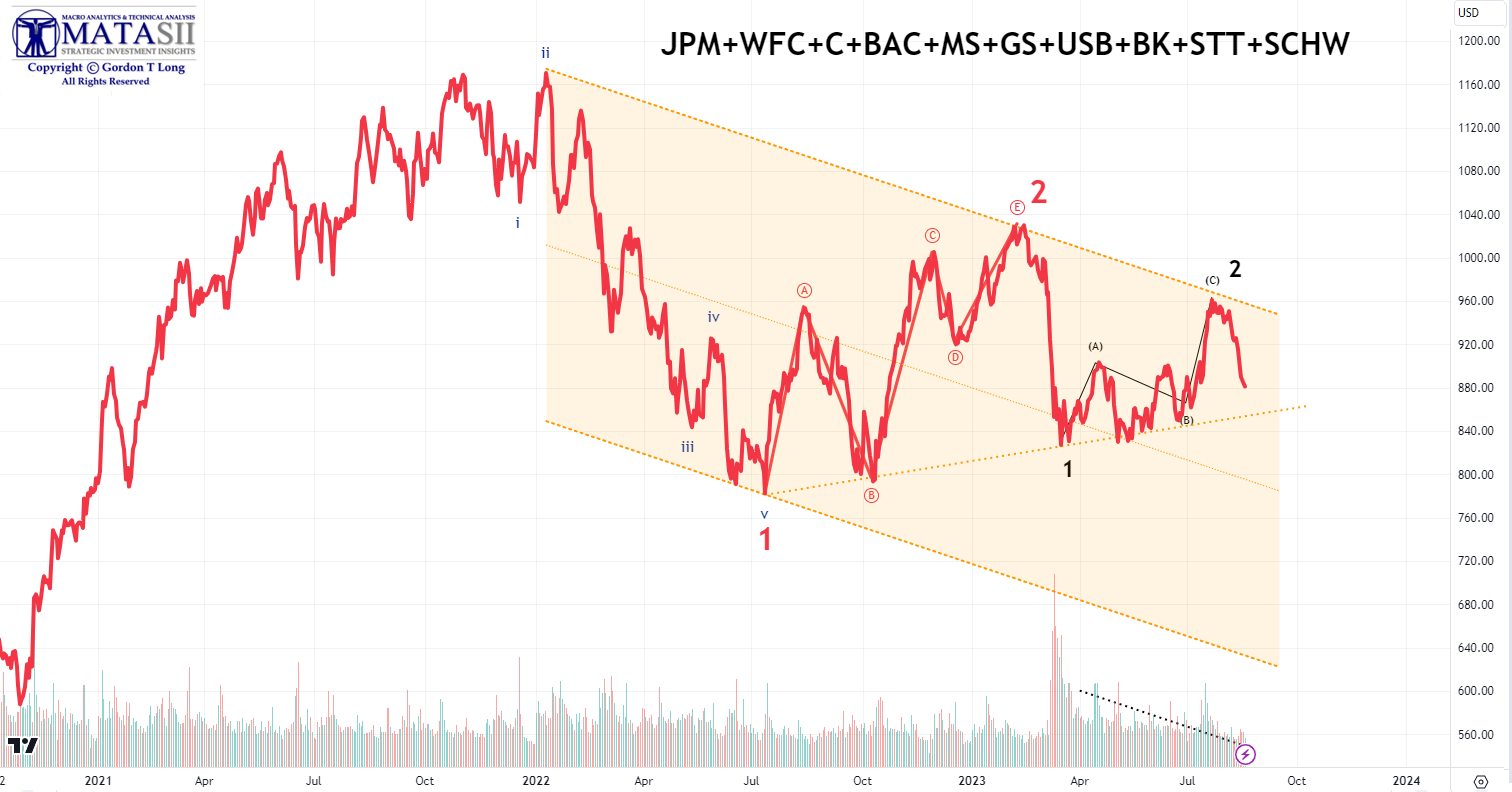
BANK STOCKS
WHAT WE LAST WROTE:
We expanded the time frames for the above set of Banking Stocks to place the current activity into a larger perspective. The earnings season activity fits within a downward trend channel. The channel suggested that it was going to be a “Sell on the News” event unless the earnings were shockingly major “beats”. The market appears to have been waiting for the earnings season to take out the highs and inflict maximum pain to over exuberant market participants.
WHAT HAS OCCURRED:
-
- Price action is very close to a rising support line (the rising dotted line connecting price lows), which is an importnat test.
OUR DESK TOP / TABLET / PHONE ANNOTATED CHART
Macro Analytics Chart Above: SUBSCRIBER LINK
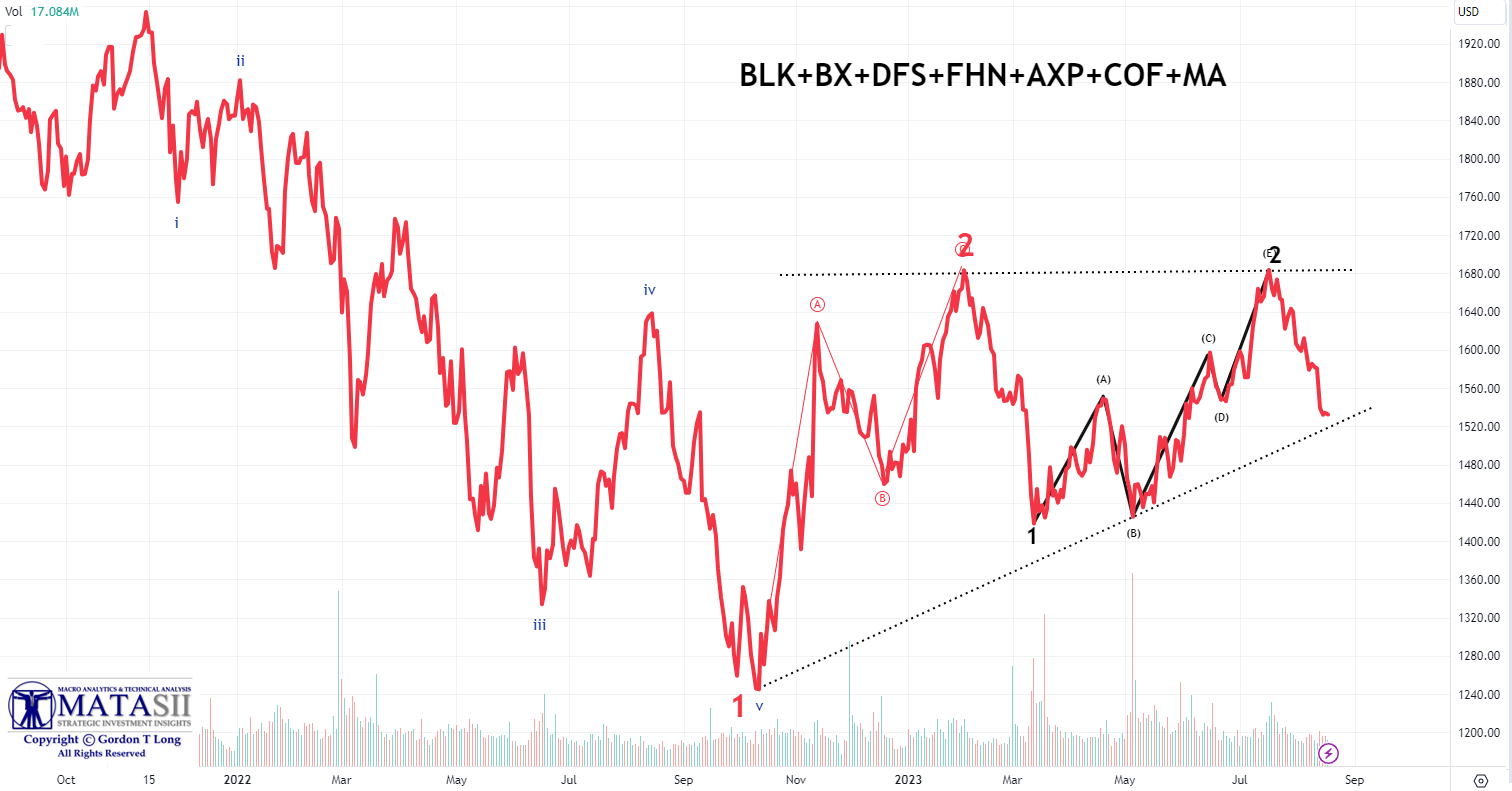
FINANCIAL STOCKS
WHAT WE LAST WROTE:
We also expanded the time frames for the set of financial stocks highlighted during earnings season to place the current activity into a larger perspective. We see that the larger degree also shows a 1-2 EW count. The Financial Stocks appear to be “coiling”, which normally leads to lower prices.
Watch this chart closely for a break of the lower dotted trend line. It will be a tell for the overall markets.
WHAT HAS OCCURRED:
-
- We at the rising initial support trend line (rising black dotted line). A solid break of this line and prices are headed lower — likely fast!
YOUR DESK TOP / TABLET / PHONE ANNOTATED CHART
Macro Analytics Chart Above: SUBSCRIBER LINK
FAIR USE NOTICE This site contains copyrighted material the use of which has not always been specifically authorized by the copyright owner. We are making such material available in our efforts to advance understanding of environmental, political, human rights, economic, democracy, scientific, and social justice issues, etc. We believe this constitutes a ‘fair use’ of any such copyrighted material as provided for in section 107 of the US Copyright Law. In accordance with Title 17 U.S.C. Section 107, the material on this site is distributed without profit to those who have expressed a prior interest in receiving the included information for research and educational purposes. If you wish to use copyrighted material from this site for purposes of your own that go beyond ‘fair use’, you must obtain permission from the copyright owner.
NOTICE Information on these pages contains forward-looking statements that involve risks and uncertainties. Markets and instruments profiled on this page are for informational purposes only and should not in any way come across as a recommendation to buy or sell in these assets. You should do your own thorough research before making any investment decisions. MATASII.com does not in any way guarantee that this information is free from mistakes, errors, or material misstatements. It also does not guarantee that this information is of a timely nature. Investing in Open Markets involves a great deal of risk, including the loss of all or a portion of your investment, as well as emotional distress. All risks, losses and costs associated with investing, including total loss of principal, are your responsibility.