Gordon T Long
Global Macro Research | Macro-Technical Analysis
GLOBAL MACRO
US ECONOMICS
THE BIDENOMIC LIQUIDITY PUMP IS EASING FINANCIAL CONDITIONS
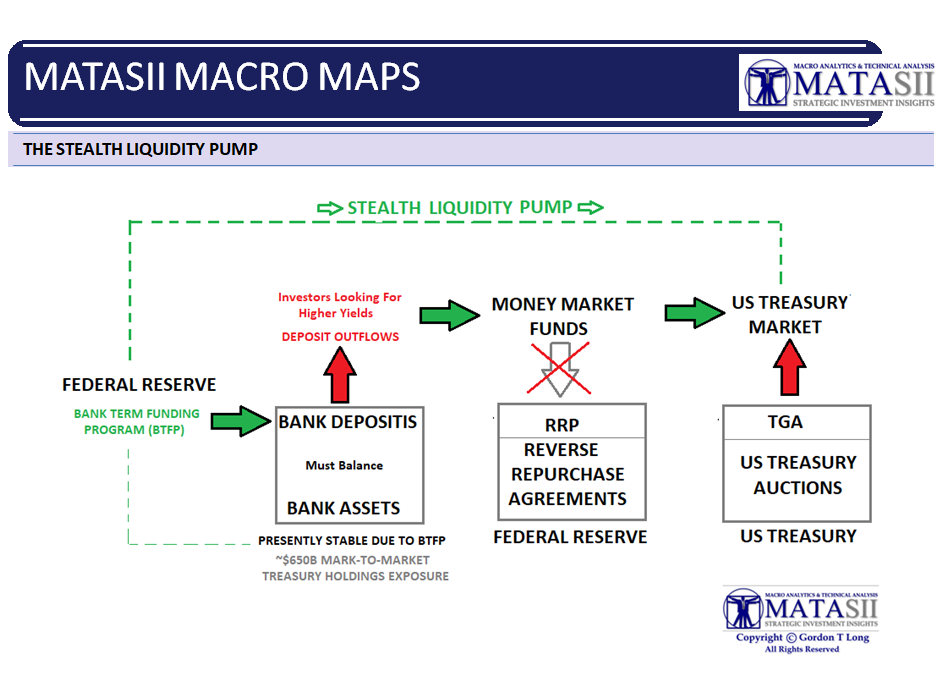
Last week we outlined how the stealth Bidenomics Liquidity Pump is presently working. The proof of its effectiveness is the Goldman Sachs Financial Conditions Index, which is now at its ‘easiest’ since the Fed started on its 50bps rate-hikes in May 2022. While the Fed continued to hike rates for the last 9 months, Financial Conditions have done nothing but ease while traders continue to ‘fight The Fed’ with loosening financial conditions (charts below).
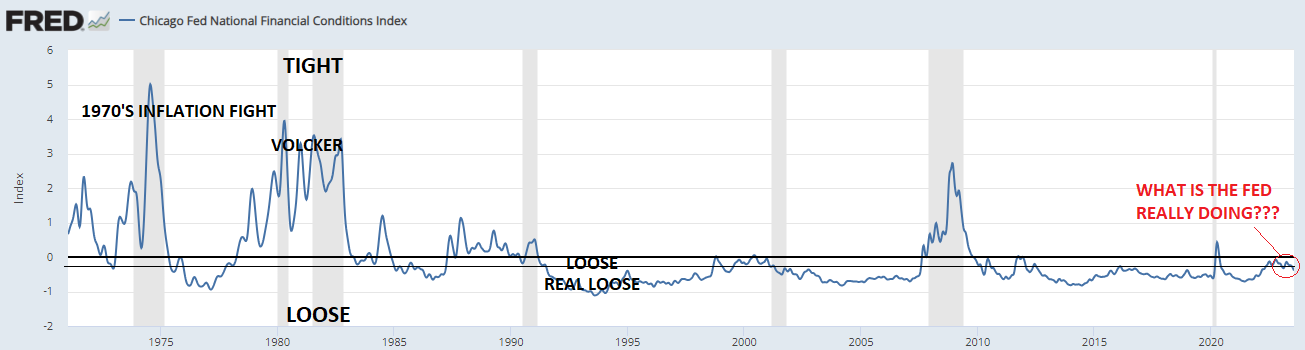
We have been long time followers of Grant’s Interest Rate Observer for their keen observations. Recently Jim Grant noted that the alternative Chicago Fed Financial Conditions Index indicates that “the current financial environment is still “easy” even after all of the talk and rate lifting. There’s a difference between tightening and tight. And by the standards of the Volker era, monetary policy is not yet tight”!
We find it interesting on what might have prompted recent research from the Federal Reserve to produce a new index named the Financial Conditions Impulse on Growth (FCI-G). It points out the obvious trap the Federal Reserve is in. The rapid and dramatic increase in rates has created an impulse only now beginning to be felt that suggests that, without the Fed soon significantly reducing rates, the economy will face a seriously harder landing than many can yet imagine! (See the latest MATASII Macro Map below). Clearly the institutions are well aware of this and are “front running” the clear actions the Fed must soon take, even if Inflation is still a long ways from actually being under control (see our latest video release).
Another perceptive analyst we follow is John Hussman, who outlines why we shouldn’t count on the Fed to be able to rescue the market. He feels “a decade of quantitative easing has led investors to imagine that Fed easing reliably supports the stock market, and that it is Fed easing that ends market collapses. The fact is that the Fed eased persistently and aggressively through both the 2000-2002 and 2007-2009 collapses. Historically, the worst market outcomes have typically occurred when the Fed is easing in an environment that combines economic weakness with risk-aversion among investors. If one believes that a Fed ‘pivot’ is something that investors should hope for, one is not paying attention.” That’s not to say the Fed won’t pivot. Hussman is simply pointing out that it will be too little too late to re-inflate this bubble.
WHAT YOU NEED TO KNOW
 Q2 EARNINGS: Selling The Earnings Beats!
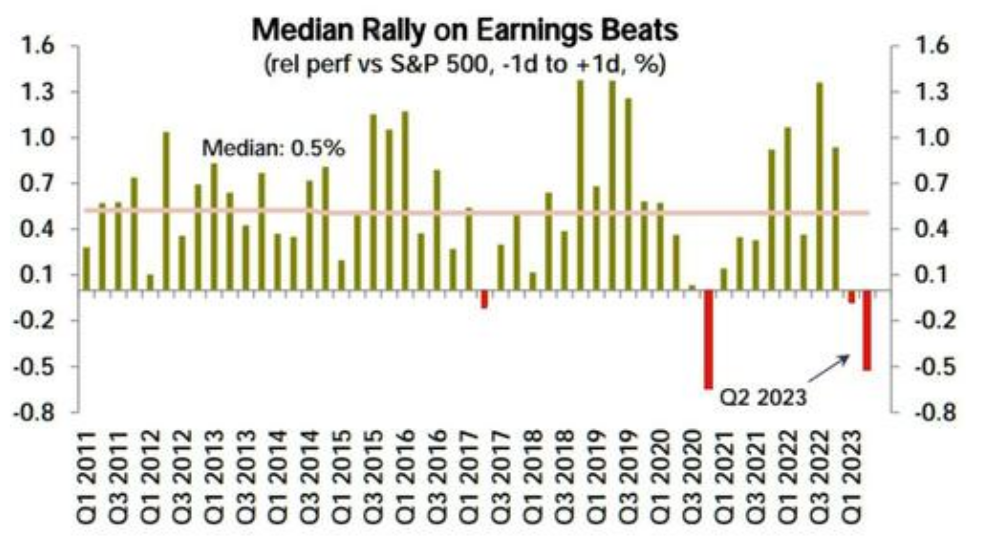
“Selling the News”! It is not a good sign when a stock is sold off after an EPS “Beats” estimates! So far the Q2 earnings season is experiencing a median sell-off of 5% on stocks beating their consensus estimates. The real news is in the conference calls which are ladened with surprises, warnings and concerns for those actually listening to them!
THE FED’S NEW FCI-G – Further Proof of The Fed’s Self Inflicted Trap Of Waiting Too Long To Fight Inflation
-
- Goldman’s Financial Conditions Index is at its ‘easiest’ since The Fed started on its 50bps rate-hikes in May 2022, and while they have continued to hike rates for the last 9 months, financial conditions have done nothing but ease.
- The Fed has created a major lagging shock to the economy from its rapid 500 bps increase in rates in such a short time frame. The lag effect of this shock has yet to fully hit.
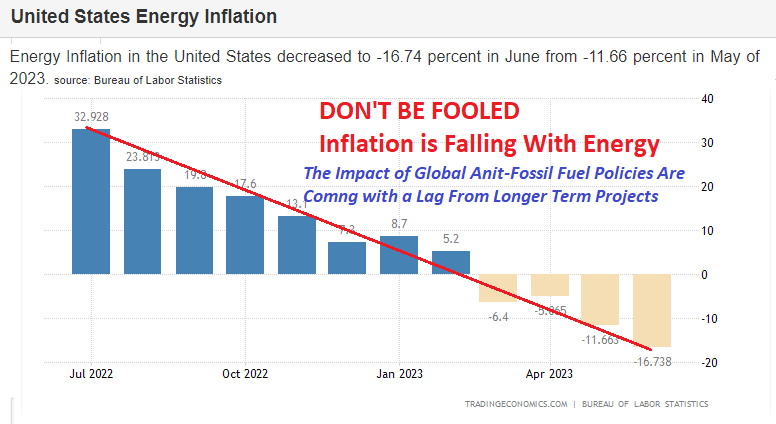
- The Fed should be reducing rates to minimize the shock, but is trapped because Inflation is not coming down as fast as it should. Inflation has primarily been dropping due to falling energy costs overwhemlingly from falling gasoline prices. In the US this is due primarily to the reduction in the Strategic Petroleum Reserves (SPR). Now, energy prices are again rising with Brent Crude closing Friday at nearly $85, having been recently below $70,
- The Fed trapped itself by being too slow to raise the Fed Fund Rates, mistakenly believing Inflation was primarily a “transitory” Supply Chain problem.
EARNINGS SEASON – Take Out “Beat” & “Expectations” and You Get the Real Results! – Selling the News
-
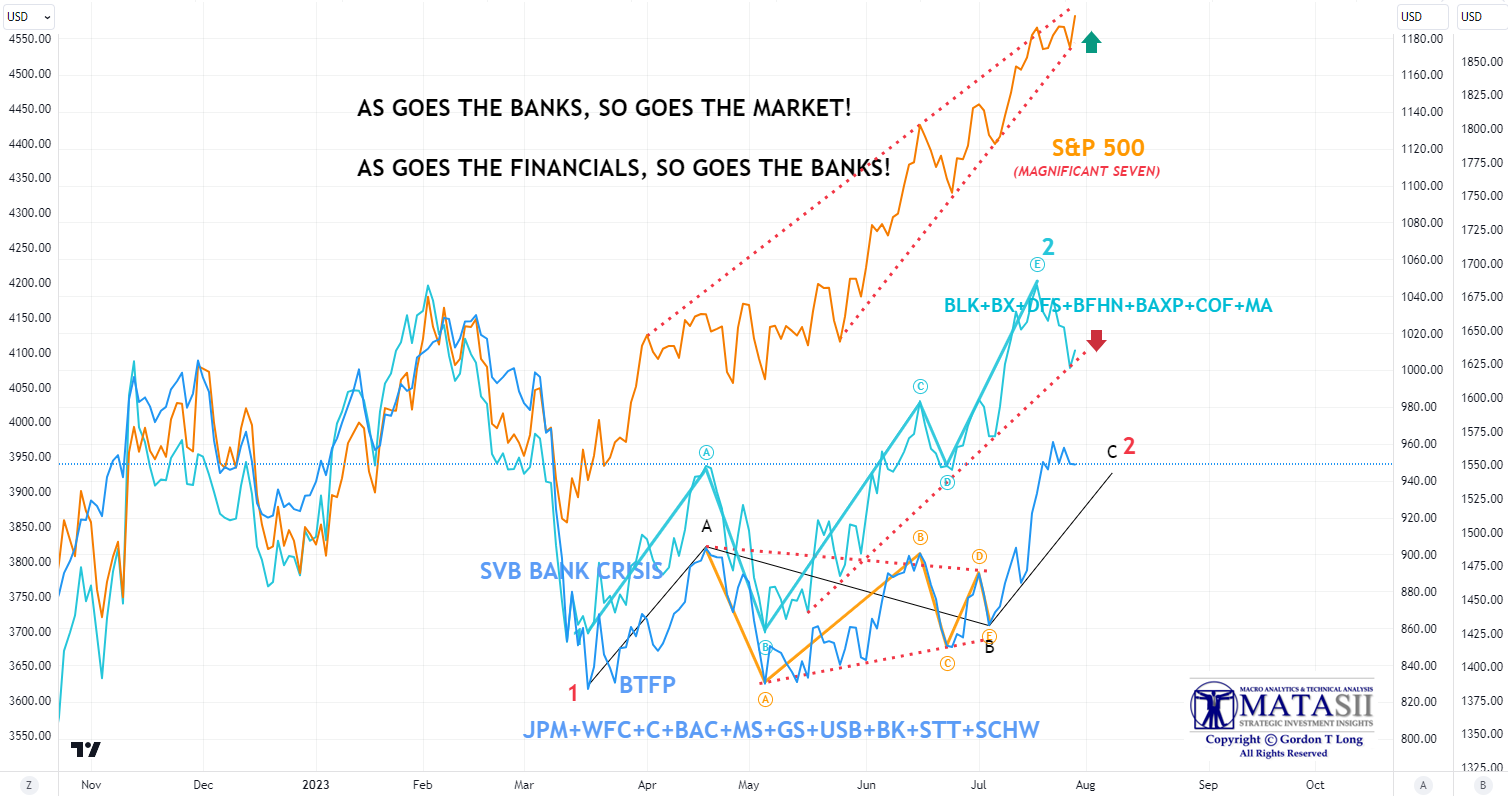
- Financials are being impacted by the repricing of collateral and risk. This is most evident in the Commercial Real Estate Market (CRE).
- Banks, already in trouble due to shrinking bank reserves, are feeling the changes underway in many of the effected Financial Institutions.
- Both Financial Institutions and Banks exhibit differing technical Wave 2 counts, but both suggest 5 wave downward impulse structures.
- As goes the Financial Institutions so goes the banks and ….. so goes the market!!!
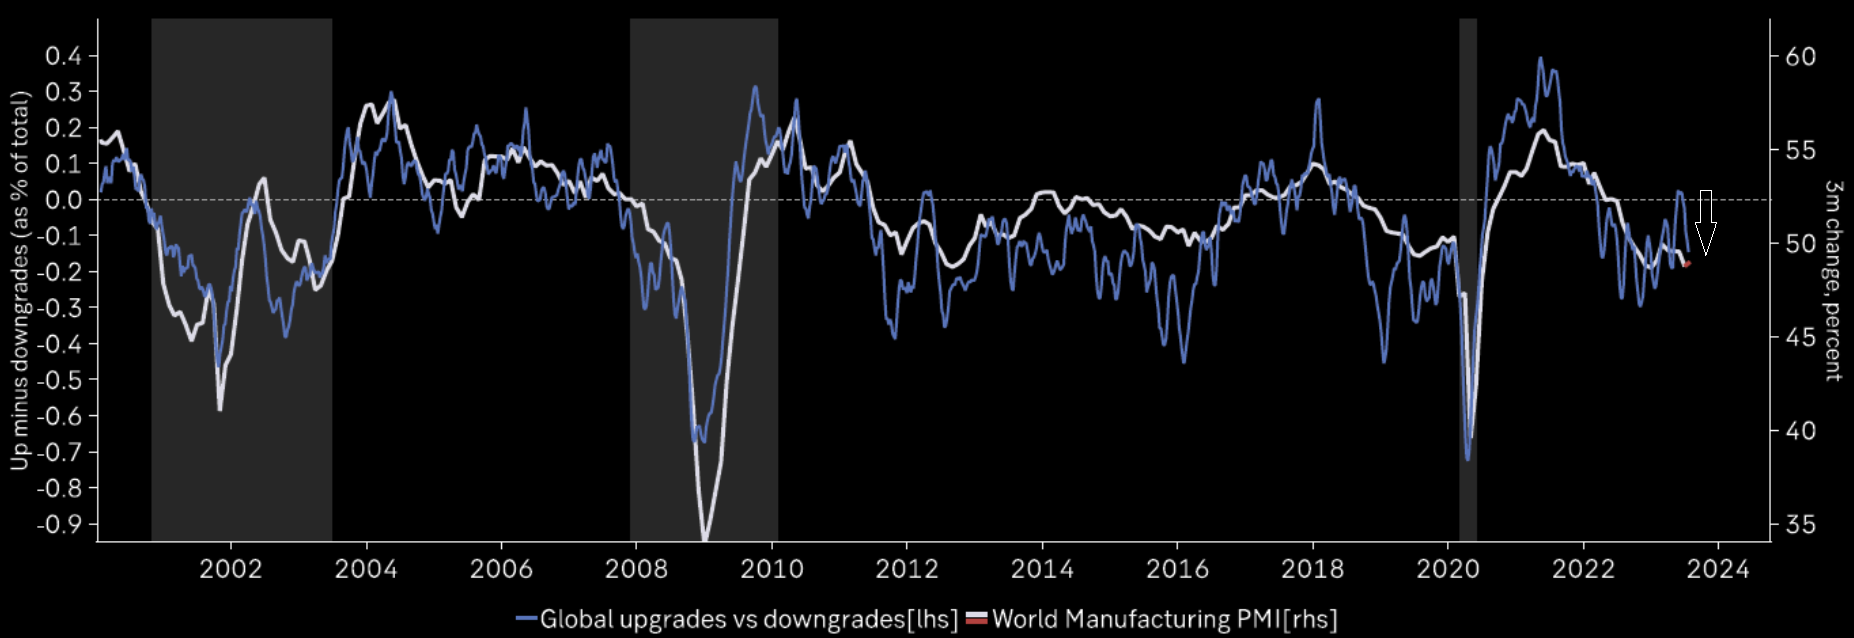
- Global Revisions remain strongly negative after briefly turning positive mid-June.
FOMC/ ECB / BOJ / BOE – Understanding the Narrative
-
- FOMC: Fed hiked the FFR by 25bps to 5.25-5.50%; “want to see core inflation coming down, which is still pretty elevated”; “getting back to 2% inflation has a long way to go.”
- ECB: Hiked another 25bps hike, taking the deposit rate to 3.75%; Lagarde offered a more downbeat assessment of the Euro zone economy; Markets priced a 25bps hike in September at around 40%; “inflation will drop further over the remainder of the year”, it “will stay above target for an extended period”.
- BOJ: Kept its policy settings unchanged, as expected with the Bank Rate held at -0.10% and YCC parameters maintained to target 10yr JGB yields around 0%. OF NOTE IS THAT the BOJ will guide yield curve control more flexibly with its daily fixed-rate purchases of 10yr JGBs at a rate of 1.0% (prev. 0.5%). This essentially means the +/- 50bps band for the 10yr JGB target will now be used as a reference point in market operations, allowing for greater flexibility. Economic uncertainty remains high.
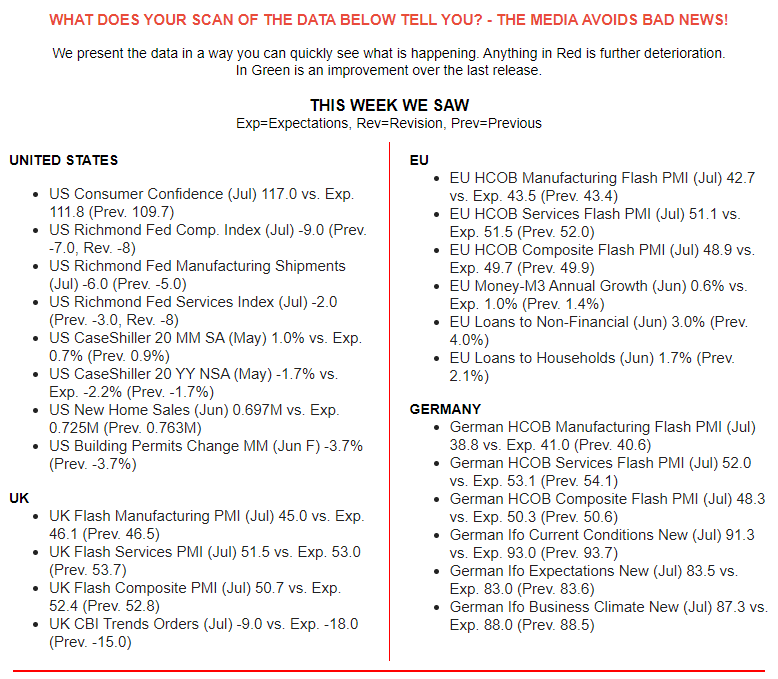
GLOBAL ECONOMIC REPORTING: What This Week’s Key Global Economic Reports Tell Us?
-
- The June Core PCE data was dovish overall, in fitting with what was seen in the CPI report, and supports the narrative about easing inflation. Core PCE printed 0.2%, in line with expectations, and cooling from 0.3%, while the annual measure eased to 4.1% from 4.6%, beneath expectations of 4.2%.
- Headline PCE rose 0.2% M/M (exp. 0.2%, prev. 0.1%) with the Y/Y rising 3.0% (exp. 3.0%, prev. 3.8%).
- We strongly caution in accepting these results, as Inflation has been coming down primarily because of falling energy prices. In the US specifically, due to falling gasoline as a direct result of the politically motivated sale of the SPR. Anti-Fossil Fuel, Policies have yet to be felt because of the lag associated with longer term project lead times.
CONCLUSION
In our last newsletter we outlined how the Stealth Bidenomics Liquidity Pump was working.
This has accounted for approximately $700-$800B in unexpected available liquidity. However, this is only the offsetting element against expectations.
What Bidenomics is implementing, its version of MMT (Modern Monetary Theory) where the central idea (other than deficits and debt don’t matter), is to place money directly in the hands of spenders (consumers or corporations) without having to be “lent into existence” through bank lending and incurred debt.
There are two other stealth elements to Bidenomics Stealth Liquidity Pump, but these two actually effectively inject liquidity directly into the hands of spenders. They are:
1- THE STUDENT LOAN FORBEARANCE SHELL GAME – The Money not being paid is being Spent! ~ $950
2- TAX DEFERRAL RECEIPTS BEING PUMPED INTO THE ECONOMY – Versus Direct Transfer Payments ~442B
Quick arithmetic gives us ($800B + $950B + 442B) = ~$2,192B.
That should create a pretty nice rally?
It Did!!!
THE FED’S NEW FCI-G – Further Proof of the The Fed’s Self Inflicted Trap Of Waiting Too Long To Fight Inflation
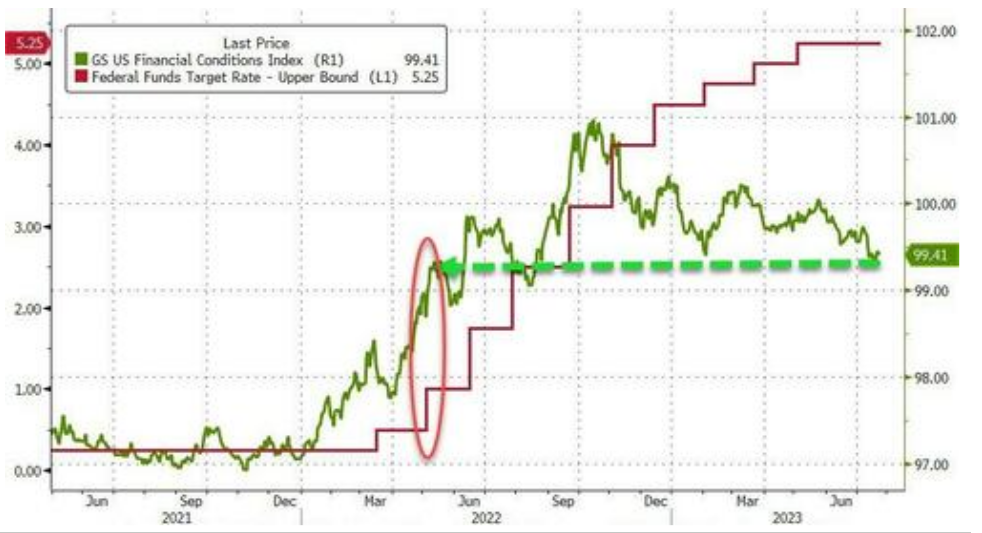 Goldman’s Financial Conditions Index is at its ‘easiest’ since The Fed started on its 50bps rate-hikes in May 2022, and while they have continued to hike rates for the last 9 months, financial conditions have done nothing but ease as traders continue to ‘fight The Fed’. (Chart Right)
Is this what the Fed wants to see after 500bps of hiking?
Is this what the Fed wants to see after 500bps of hiking?
CHART BELOW: The Chicago Fed National Financial Conditions Index
Negative values indicate financial conditions that are looser than average, while Positive values of the NFCI indicate financial conditions that are tighter than average.
WHAT IS THE FED REALLY ACHIEVING???
THE NEW FCI-G – A New Index to Measure U.S. Financial Conditions
The new index from the Federal Reserve can be used to gauge broad financial conditions and assess how these conditions are related to future economic growth. The index is broadly consistent with how the current FRB/US model generally relates key financial variables to economic activity. (Click here for an understanding and details).
The difference in the new FCI-G (Financial Condition Index of Growth) is shown by comparing the range of financial conditions implied by the indexes developed by Bloomberg, Goldman Sachs, and the Federal Reserve Banks of Chicago, St. Louis, and Kansas City.
NOTE: To facilitate the comparison, each index has been normalized over a common sample period starting in 1990. The vertical axis, therefore, measures the indexes in terms of standard deviations from their own historical averages.
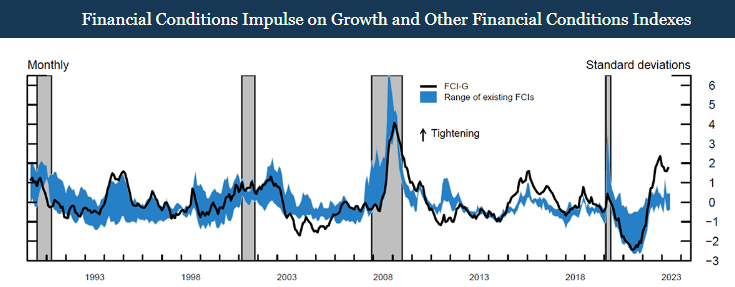
The FCI-G chart below plots two monthly versions of the FCI-G from January 1990 through May 2023, with higher values of the index denoting tighter financial conditions.
-
- The black line is the baseline index, computed by cumulating the effects on one-year-ahead GDP growth of the three-month changes in financial conditions during the preceding three years.
- The red line displays the version of the index cumulating the effects on GDP growth of changes in financial conditions that occurred only up to one year earlier.
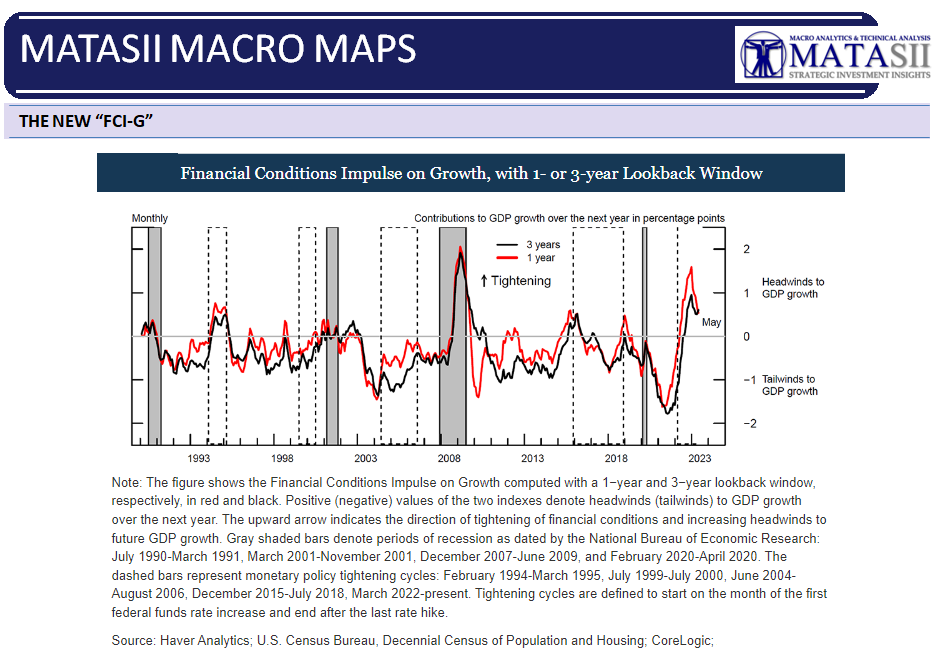
WHAT THIS TELLS US!
-
- The Fed has created a major lagging shock to the economy from its rapid 500 bps rate increase in such a short time frame.
- The lag effect of this shock has yet to fully hit.
- The Fed should be reducing rates to minimize the shock, but is trapped because Inflation is not coming down as fast as it should. Inflation has primarily been dropping due to falling energy costs overwhemlingly from falling gasoline prices. In the US this is due primarily to the reduction in the Strategic Petroleum Reserves (SPR). Now, energy prices are again rising with Brent Crude closing Friday at nearly $85, having been recently below $70,,
- The Fed trapped itself by being too slow to raise the Fed Fund Rates, mistakenly believing Inflation was primarily a “transitory” Supply Chain problem.
BEHIND FRIDAY’S OPTIONS EXPIRATION – Coinciding With Nasadaq 100 Rebalancing
We received monthly stock options expiry on Friday, the same day as the Nasdaq 100 rebalanced, with fingers also being pointed at the 0DTE option crowd.
NASDAQ 100 REBALANCING (NOTES BELOW AS OF MID-DAY FRIDAY NEWSLETTER WRITING)
The heavy weighting of mega-cap tech stocks in NDX (and thereby QQQ) has gotten so extreme that the index can no longer be considered well-diversified. That is causing Nasdaq to reduce the weights of Nvidia (NVDA), Microsoft (MSFT), Amazon (AMZN), Tesla (TSLA), Alphabet (GOOG/GOOGL), Meta Platforms (META) and Apple (AAPL) within the index. Since the index change is effective on Monday, funds that track the index need to adjust their positions as of today’s (Friday) close.
In theory, we should expect to see relatively heavy selling in those names on the close and buying in the 92 other names that will be going up in weight. We also might expect to see some pressure on SPY, because those stocks are all heavily weighted in the S&P 500 as well. That said, on that basis, QQQ should underperform today. But nothing is a given here.
-
- As a result, we see a preponderance put buying in QQQ and the affected stocks at this point.
- We also see some marginal net call buying in some of the smaller names in NDX. But with markets relatively unchanged at midday, it is hard to separate the causes.
- Earlier today we saw some aggressive pre-market buying of ES futures. The aggressive run-up seemed to have the hallmarks of a 0DTE move. And it very well might have been that type of rally.
- That is thanks to an overlooked feature of monthly expirations. On most days, we have but one set of 0DTE options, but on monthly expirations we have two. A key feature of monthly expirations is that we have index options that expire on the open. As with all options on expiration day, those become 0DTE. Remember, every option becomes 0DTE on expiration, thus every options class has 0DTE options on major expiration days.
- Thus, we have the potential for a fascinating afternoon on what otherwise might have shaped up to be a sleepy mid-summer Friday.
THURSDAY- PRE-OPTIONS EXPIRATION
-
- Stocks tumbled on Thursday with the NDX posting its 2nd worst day of the year (-2.28%) behind February 21st’s (-2.41%), as poor earnings receptions for NFLX and TSLA catalysed a sharp pullback.The factors of options expiration and rebalancing may have been giving weight to Thursday’s sell-off.The SPX and RUT held up slightly better.
- Treasuries saw heavy selling ahead of next week’s auctions (10yr +10bps at 3.85%), accentuated by initial jobless claims, (which chime with the July NFP survey week) hitting an early May low, with the lacklustre Philly fed mfg. survey and rise in continuing claims an afterthought, while the miss in existing home sales also had little sway.
- The DXY was firmer, just failing to clip 101 at its best, as it benefitted from the spike higher in US yields.
- Oil prices were just about firmer in what was another choppy session amid the mixed economic data and firmer Dollar; Chinese imports of crude oil surged in the latest monthly release. Nat Gas futures surged to their highest since early July with particularly low storage builds as hot weather, particularly in Texas, makes its mark.
FRIDAY OPTION EXPIRATION
-
- Stocks gave up moderate gains on Friday as stocks traded in a choppy fashion. The Utilities sector was the outperformer, while Tech stocks lagged. Further choppiness was seen towards the end of the session, which traders attributed to the Nasdaq 100’s special rebalancing.
- Despite the equity market jitters on Thursday, indices (SPX, DJIA) end the week with gains. Treasury yields saw modest declines on Friday, though the 2s sector lagged ahead of next week’s 2s, 5s, 7s supply, as well as the FOMC confab, where the central bank is expected to lift rates by 25bps – traders will be looking for clues as to whether this is the final hike of the cycle.
- On the week, Treasuries are lower amid some mixed data and Fed terminal rate uncertainty.
- The most notable development in FX was the JPY’s slide against the Buck after dovish BoJ sources report ahead of next week’s confab, which sent USD/JPY to the highest level since July 10th.
- In addition to the FOMC and BoJ meetings next week, the ECB will also make a policy announcement, while the corporate earnings docket is heavy.
LOOK FOR MORE “CHOPPINESS” MONDAY & TUESDAY.
EARNINGS SEASON – Take Out “Beat” & “Met” Expectations” and You Get The Real Results!
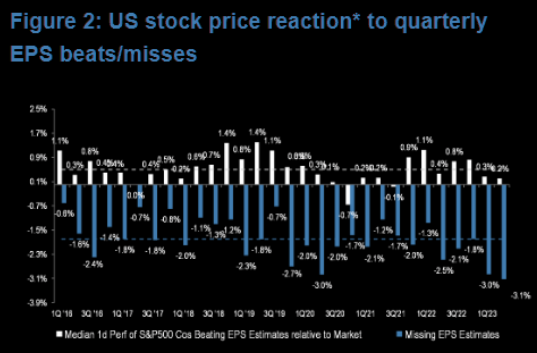 MARKET SELLING THE NEWS
Last week I cautioned that:
Consensus Estimates for 2Q growth since the beginning of April have been cut (STAGED) from -6% to -9%.
Reporting firms should be able to meet or exceed the low bar set for 2Q, which it is hoped by Wall Street could spark some renewed volatility to push markets even higher. Many suggest the bar for earnings season is already set so low that even Biden could step over it without falling?
Wall Street is presently geared for 2Q 2023 to mark the trough in EPS growth, if the staged consensus expectations are realized.
The ability to base along Price in the form of price increases has been a main factor that in many cases has held sales growth above zero for many companies this year. It will be a major headwind when that pricing power hits the roadblock of a “tapped out” US consumer.
-
- This is precisely what we think is starting to happen for many businesses, particularly those focused on the goods economy, which is a large revenue and market cap weight in the S&P 500.
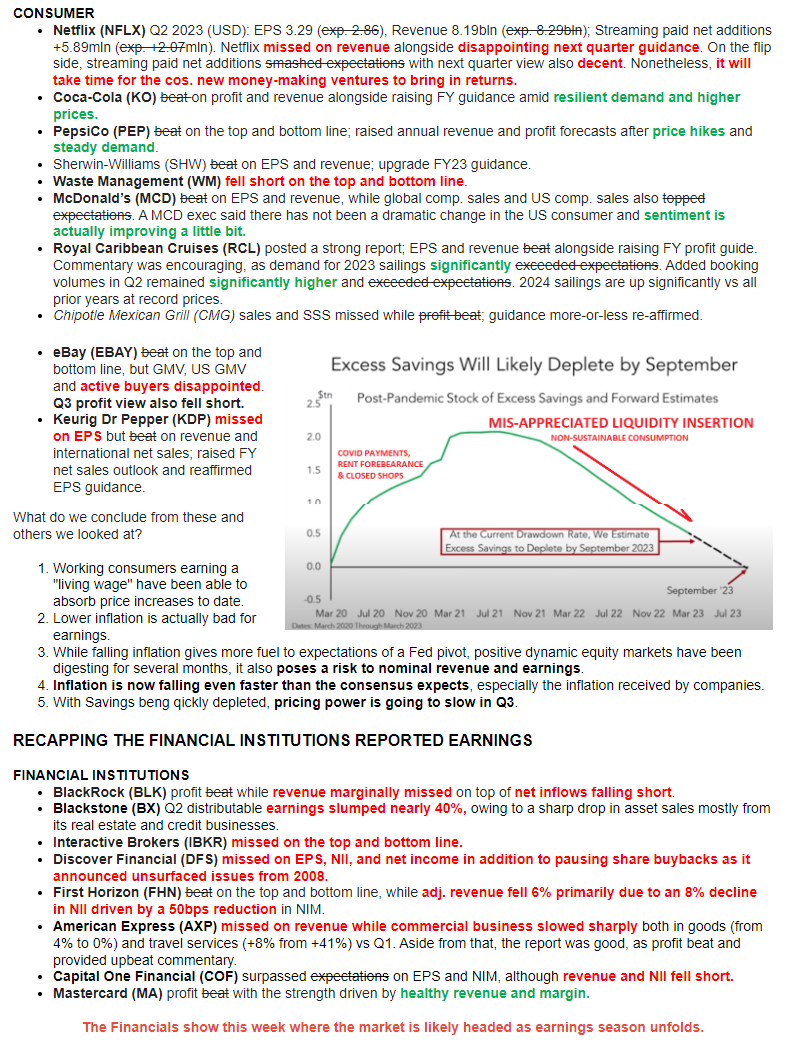
Let’s look at a random sampling of “goods” players reporting earnings this week. These are players that likely had the temporary luxury of consumer pricing power. First, some notes on how we viewed their reported earnings (as do other long time earnings watchers):
-
- We cross out any mention of the word “Beat” or “Expectations”, since they have been messaged (last week’s warnng above).
- We highlight in Green any noted good news and in Red any documented concerns (likely forced by SEC compliance guidelines and litigation concerns).
YOUR DESK TOP / TABLET / PHONE ANNOTATED CHART
Macro Analytics Chart Above: SUBSCRIBER LINK
WHAT THIS TELLS US!
-
- Financials are being impacted by the repricing of collateral and risk. This is most evident in the Commercial Real Estate Market (CRE).
- Banks, already in trouble due to shrinking bank reserves, are feeling the changes underway in many of the effected Financial Institutions.
- Both Financial Institutions and Banks exhibit differing technical Wave 2 counts, but both suggest 5 wave downward impulse structures.
- As goes the Financial Institutions so goes the banks and ….. so goes the market!!!
GLOBAL REVISIONS SHOWS THE TREND: Global Revisions remain negative after briefly turning positive mid-June.
MID YEAR FOMC/ ECB / BOJ / MEETINGS – Understanding the Narrative
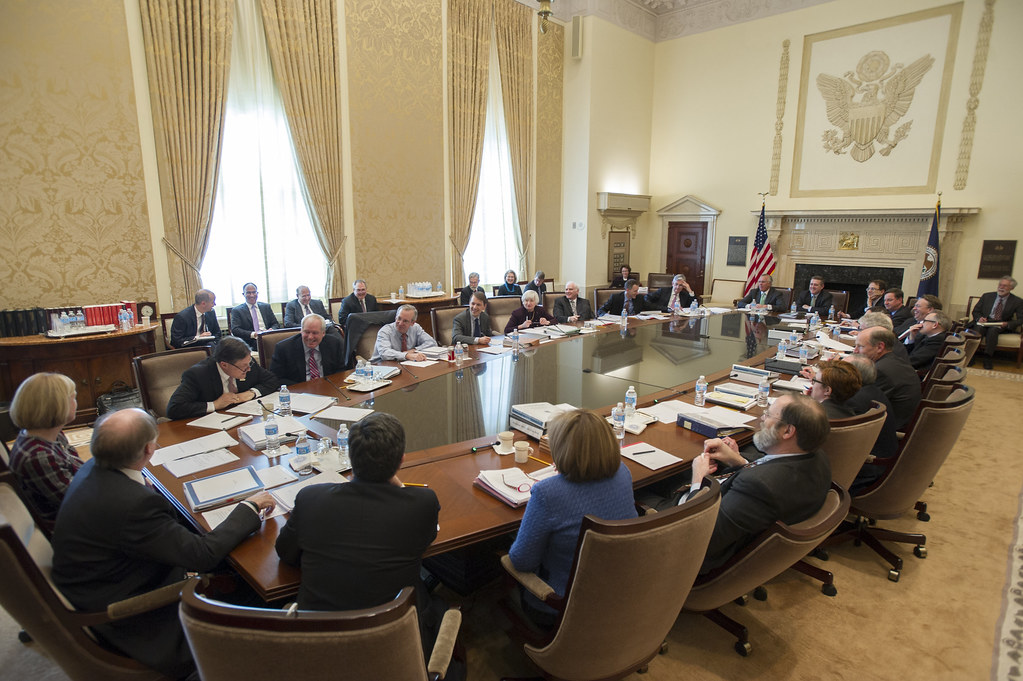 FEDERAL RESERVE FOMC MEETING
-
- Fed hiked the FFR by 25bps to 5.25-5.50%.
- While there were no major changes to July FOMC statement compared with the June FOMC, in which it retained the language that in determining the extent of additional policy firming that may be appropriate to return inflation to 2% over time, the Committee will take into account the cumulative tightening of monetary policy, the lags with which monetary policy affects economic activity and inflation, and economic and financial developments.
- However, one slight adjustment was the description of economic activity, which it stated has been expanding at a “moderate” pace vs a “modest” pace in the June statement.
- Furthermore, it reiterated job gains have been robust and the unemployment rate remains low, while it also retained the language that inflation remains elevated and the Committee remains highly attentive to inflation risks.
- Fed Chair Powell said at the press conference that growth in consumer spending has slowed from earlier in the year, but there is still a strong pace of job growth and the labor market remains very tight.
- Powell also stated that the FOMC is to take a data-dependent approach on future hikes and getting back to 2% inflation has a long way to go.
- Fed Chair Powell said during the Q&A that they haven’t made a decision to go every other meeting and haven’t made any decisions about future meetings, while June CPI was welcomed, but was only one month’s report.
- He also stated it is possible the Fed could hike again in September if data warrants it and that stronger growth over time could add to inflation and may require a policy response. Powell said they need to see inflation “durably down” and want to see core inflation coming down, which is still pretty elevated, while he noted it is a good thing that headline inflation has come down so much, which will strengthen public perception of inflation coming down.
- Furthermore, Fed Chair Powell said a more gradual pace does not automatically go to every other meeting which they do not want to do and said hiking until they get to 2% is a formula for going past the target and if they see inflation coming down credibly, they can move down to a neutral level and then below neutral at some point.
 ECB MEETING
-
- As expected, the ECB pulled the trigger on another 25bps hike, taking the deposit rate to 3.75%.
- The decision to move on rates again was based on the view that, although “inflation will drop further over the remainder of the year”, it “will stay above target for an extended period”.
- Aside from the decision itself, focus for the statement was on the modest adjustment to the Bank’s language on future decisions, whereby the key ECB interest rates will be “set at” sufficiently restrictive levels for as long as necessary vs. the previous wording of “brought to”.
- Elsewhere, the GC also opted to set the remuneration of minimum reserves at 0% (vs. prev. matching the deposit rate), in order to “preserve the effectiveness of monetary policy”.
- In the follow-up press conference, Lagarde offered a more downbeat assessment of the Eurozone economy, noting that the near term outlook is deteriorating and momentum in the services sector is slowing.
- With regards to the decision, Lagarde stated that policymakers were unanimous in their stance. When initially questioned over whether she thinks the Bank has more ground to cover, she said the decision will be based on the data and the GC is “open-minded”. When pressed on the matter later during the press conference, Lagarde stated that at this moment in time she “would not say so” with regards to there being more ground to cover.
- On the balance sheet, Lagarde remarked that a reduction has not been discussed and there will be no trade-offs between rates and QT.
- Overall, the main takeaway ahead of the September meeting is that the ECB is happy to either pause on rate hikes or carry out further tightening, however, any decision to do so will be based on how the data plays out between now and then. (Note – there are two more inflation reports due before the September decision).
- As it stands, markets price a 25bps hike in September at around 40%.
- Analysts at Nordea are of the view that “the move was the last hike in the cycle, though risks are tilted towards a further hike in the autumn”. Another ECB source reports via Reuters saw that some ECB policymakers do currently favour a September rate hike, but others are eyeing a pause, expecting a recession.
- Meanwhile on reserves, the sources noted the ECB debated raising banks mandatory reserves to 2% from 1%.
 BOJ MEETING
-
- BoJ kept its policy settings unchanged, as expected with the Bank Rate held at -0.10% and YCC parameters maintained to target 10yr JGB yields around 0%.
- OF NOTE IS THAT the BoJ will guide yield curve control more flexibly with its daily fixed-rate purchases of 10yr JGBs at a rate of 1.0% (prev. 0.5%). This essentially means the +/- 50bps band for the 10yr JGB target will now be used as a reference point in market operations, allowing for greater flexibility.
- This means that the actual yield could occasionally move outside of this range.
- The BoJ also increased the amount of purchases to JPY 900bln from JPY 875bln.
- Meanwhile, the Outlook Report saw an upgrade to the FY23 Core CPI forecast to above the BoJ’s 2% inflation target.
- Delving a bit deeper into the core CPI forecasts, the fiscal 2023 median forecast was raised to 2.5% from 1.8%, but the 2024 median forecast was trimmed to 1.9% from 2.0%, and the 2025 median forecast was maintained at 1.6%.
- The announcement resulted in plenty of confusion, although the JPY ultimately weakened with the move less hawkish than a recent Nikkei report suggested.
- At the post-meeting presser, Governor Ueda emphasized the need for continued monetary easing, stating that the Bank is prepared to further ease policy if required.
- The focus is on enhancing the sustainability of Yield Curve Control, with the BoJ ready to conduct fixed-rate purchases if long-term yields exceed 1.0%.
- The Bank has created a 0.5-1.0% frame to respond to future risks, with 1.0% defined as a ‘just-incase cap’.
- Despite some progress towards inflation goals, Ueda expressed uncertainty about future price rebounds, citing risks from a weaker global economy. Ueda said the BoJ is not targeting FX levels, but is including currency market volatility in its measures.
- Economic uncertainty remains high, and the Bank is prepared to respond flexibly to any materialised risks. Ueda denied any bias towards policy tightening, stating that the aim is to make YCC more sustainable, not to normalise policy.
- Analysts at Oxford Economics say “Despite today’s surprise tweak to YCC policy, we continue to believe that Governor Ueda is determined to avoid premature tightening and will spend another year or so to carefully assess whether the economy is on track to achieve 2% inflation within his five-year term”, although the desk does highlight that “It is not clear at this stage how the 10-year yield will move under the new ceiling of 1.0% and how actively the BoJ will intervene in the market to enhance appropriate yield formation based on economic fundamentals.”
GLOBAL ECONOMIC REPORTING: What This Week’s Key Global Economic Reports Tell Us
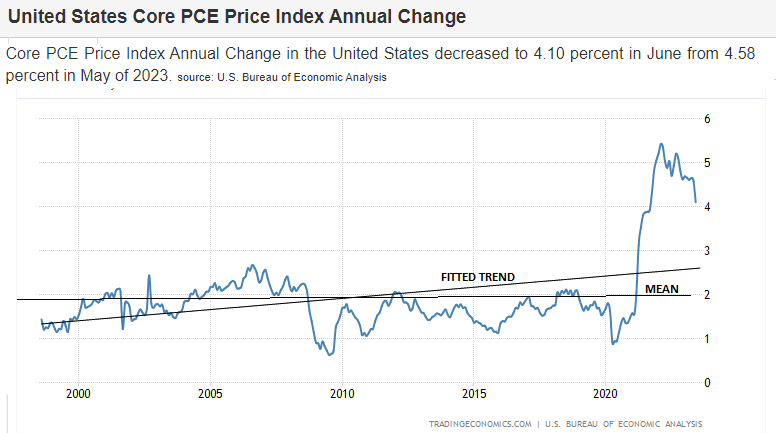 CORE PCE: WHAT THE FED IS WATCHING
-
- The June Core PCE data was dovish overall, in fitting with what was seen in the CPI report, and supports the narrative about easing inflation.
- Core PCE printed 0.2%, in line with expectations, and cooling from 0.3%, while the annul measure eased to 4.1% from 4.6%, beneath expectations of 4.2%.
- Headline PCE rose 0.2% M/M (exp. 0.2%, prev. 0.1%) with the Y/Y rising 3.0% (exp. 3.0%, prev. 3.8%).
- Analysts at Pantheon Macroeconomics highlighted that the PCE core services ex-housing rose by 0.2%, matching the prior month’s pace.
- Overall, this is the latest report that shows evidence that inflation is falling and supports the soft landing narrative.
- With the Fed in data dependent mode, this report is unlikely to change the views of the FOMC and Fed Chair Powell; the Chair this week said there were still several data points between now and the next Fed meeting that would feature in their decision making, and he emphasised that the Fed was not on a pre-set path.
- Markets, however, are largely pricing in the Fed now at terminal, with only a 20% implied probability of another hike on September 20th.
- Between now and then we will see July CPI (Aug 10th), August CPI (Sept 13th), as well as two jobs reports on August 4th and September 1st. We will also see one more PCE report on August 31st. Therefore there is still a lot of data to digest when assessing how the Fed will react.
- Personal Income rose 0.3%, cooler than the 0.5% expected and 0.4% prior while consumption rose 0.5% from 0.1%, above the 0.4% expected. Real consumption rose 0.4%.
CONCLUSION
 In our last newsletter we outlined how the Stealth Bidenomics Liquidity Pump worked.
It was using the new Bank Term Funding Program to stop falling bank reserves from draining liqudity and have them instead be used by Money Market funds, along with the reduction of the Reverse Repo (RRP) Program to buy the new Treasury Bond issuances to fund the Treasury General Account. This was accounting for approximately $700-$800B in unexpected available liquidity.
However, this is only the offsetting element against expectations. There are two other stealth elements actually injecting liquidity. They are:
1- THE STUDENT LOAN FORBEARANCE SHELL GAME – The Money not Being Paid Is being Spent!
The FY23 deficit is tracking about $1.5 trillion, but only thanks to the odd accounting of student debt forgiveness. Excluding student debt, the deficit would be closer to $1.8tn, and almost $1tn larger than in FY22. If one simply looked at the deficit figures from CBO (generally considered the best in class), then it looks as though the fiscal situation should be little-changed between fiscal years 2022 and 2024. However, that artificial stability is mostly an artifact of the peculiar way CBO accounts for the White House’s student debt forgiveness plan and the subsequent reversal of that plan — neither of which affected current taxes or spending. Excluding the largely meaningless swings imparted by student debt forgiveness, the deficit looks like it is set to almost double from $950 billion in FY22 to $1.839 trillion in the current fiscal year ending September 30! You can be sure the student debt loans are not being set aside, but rather are being spent with expectations that Bidenomics will fully discharge their debt.
2- TAX DEFERRAL RECEIPTS ARE BEING PUMPED INTO THE ECONOMY – Versus Direct Transfer Payments
US Federal/State Income Tax Receipts are tracking at an unprecedented $442bn below a year ago (three quarters into the fiscal year). Part of the missing tax revenue is due to disaster relief efforts in several states, which have extended the April 15 tax deadline for areas in several states to between July 31 and October 16. This means that instead of remitting money that was due in mid-April, American consumers are likely spending it to offset inflation. This is boosting the economy and contributing to GDP in Q2 sharply higher than expected. The most notable FEMA-declared disaster areas were in California as severe winter storms, flooding and mud slides impacted large swaths of the state earlier this year. Given that California accounts for a little less than 14% of US nominal income, this matters with respect to federal government tax receipts.
Quick arithmetic gives us ($800B + $950B + 442B) = ~$2,192B. That should create a pretty nice rally? It Did!!!
GENERAL NOTES
-
- Federal Reserve unveiled proposed technical changes to the global systemically important bank surcharge and Fed staff estimate proposed GSIB surcharge changes would result in a USD 13bln aggregate increase in capital requirements. Fed Chair Powell said regulators must consider benefits as well as costs of higher capital, while he added that the proposal exceeds what is required of the Basel agreement and must ensure the proposed approach outweighs costs. It was later reported that the Fed approved the proposals to raise bank capital requirements and modify the global bank surcharge.
ASIA-PAC
-
- BoJ will reportedly discuss tweaking its YCC policy to let long-term interest rates rise beyond its cap of 0.5% by a certain degree in what would be a shift towards a more flexible policy approach, according to Nikkei. Furthermore, the report noted that the central bank is likely to keep current the cap while taking a flexible approach and that under the more flexible policy being considered, the BoJ would permit gradual increases above the 0.5% threshold, but still clamp down on any sudden spikes.
- China reportedly urges improved mortgage rules to support the housing market, according to Bloomberg.
- China’s National Financial Regulatory Administration said people’s consumption ability is not sufficient and the willingness for consumption is not strong.
- PBoC official said China is to build a high-yield bond market in order to meet the financing needs of smaller tech firms, according to Reuters.
WE DON’T CALL TOPS! – BUT…
WE ARE GETTING SOME IMPORTANT SIGNALS!
Click All Charts to Enlarge
SITUATIONAL ANALYSIS
 IS THIS THE TOP??
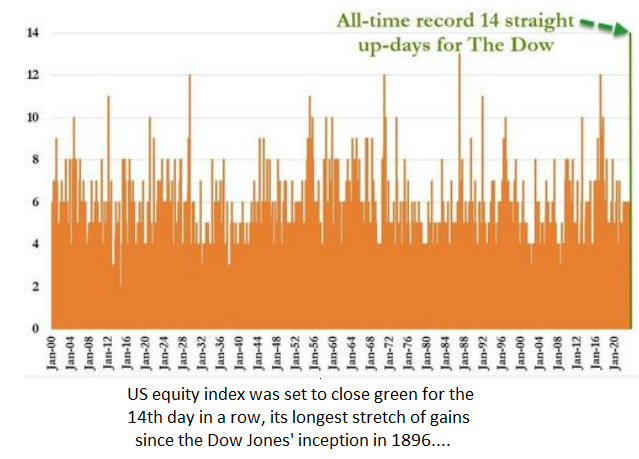
This week we received an array of strong indications we may have put in a major top in the S&P 500.
The indicators range from an all-time historic record mumber of straight up-days in the long established market index like the DOW (right),
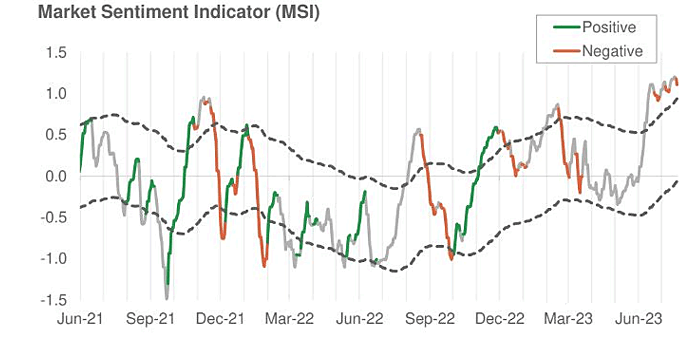
… to Risk measures such as the Morgan Stanley Market Sentiment Indicator which turned Rsk-Negative (below).
Is this enough to say the top is in?
FIRST WE NEED TO SEE CERTAIN CONFIRMATIONS
Our process requires further confirmation before placing a wager on this possibility.
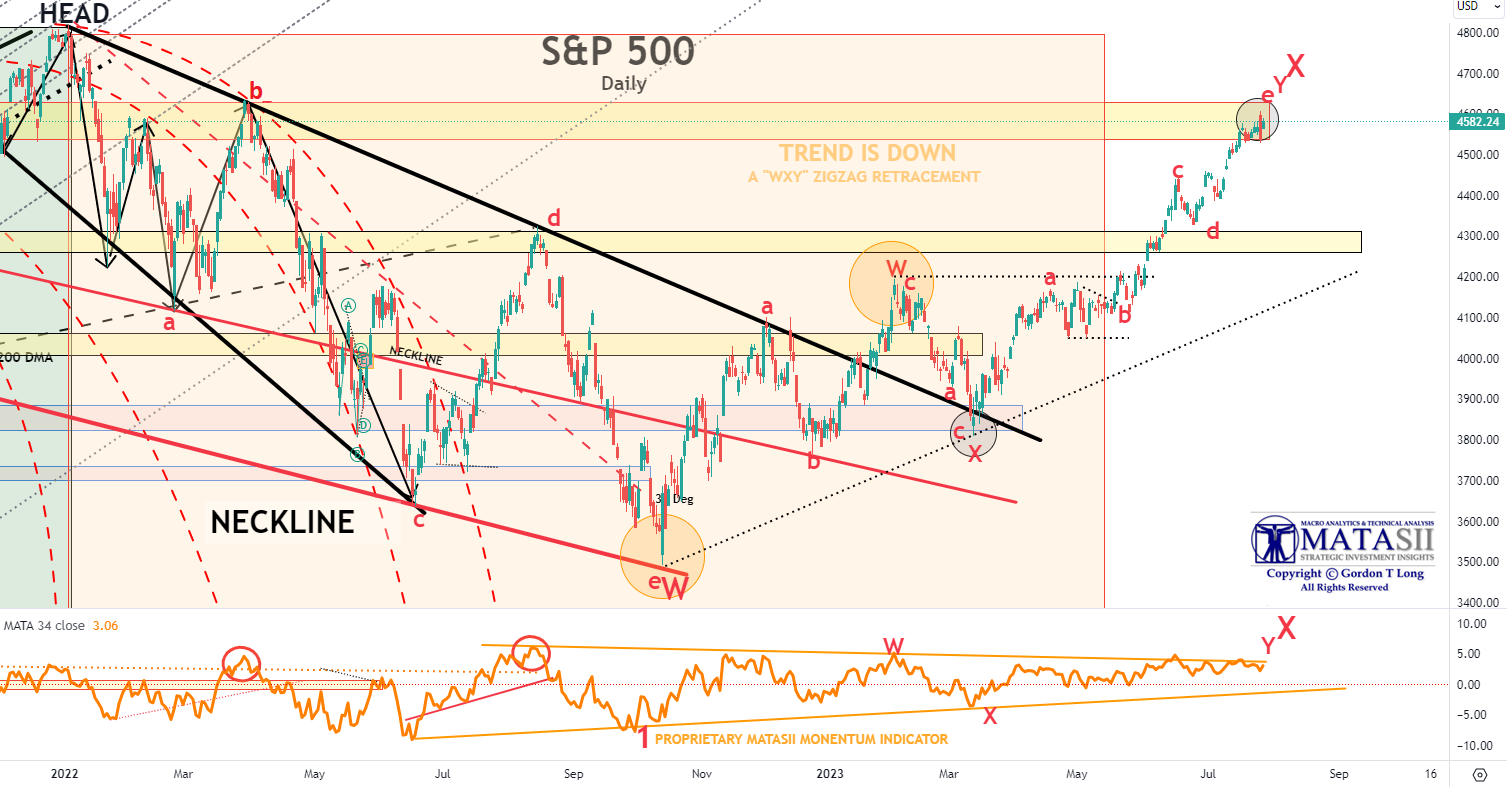
THE S&P 500
The Head & Shoulders chart of the S&P 500, which we have shown many times has reached our upside target range.
YOUR DESK TOP / TABLET / PHONE ANNOTATED CHART
Macro Analytics Chart Above: SUBSCRIBER LINK
What we need to see and which usually occurs at important equity market reversals is the following.
-
- A Coincident Macro Event which shows clearly in the Credit, Currency & Bond markets,
- A Reversal Engulfing Candlestick or alternatively a 1) Hammer.2) Shooting Star or 3)The Doji candlestick pattern.
- The MATASII Cross must give a SELL signal confirmed with the MATASII proprietary Momentum Indicator.
So how do we stack up in this regard?
1- A COINCIDENT MACRO EVENT
 CREDIT / CURRENCY / BOND MARKETS
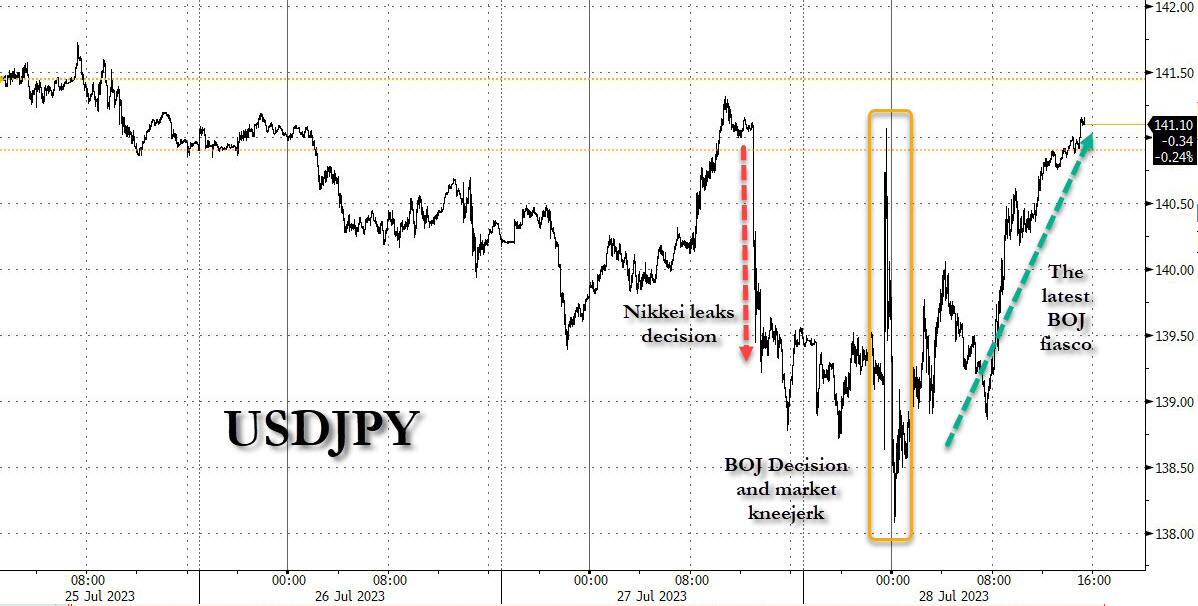
The Japanese Carry Trade has long been a major influnce in global markets. Markets react to important developments in this area. We had such an event on Thursday & Friday, as the BOJ sent signals it was “Tweaking” its Yield Curve Control (YCC) Monetary Policy.
Immediate reactions were seen in the IMPORTANT USDJPY currency pair (chart right).
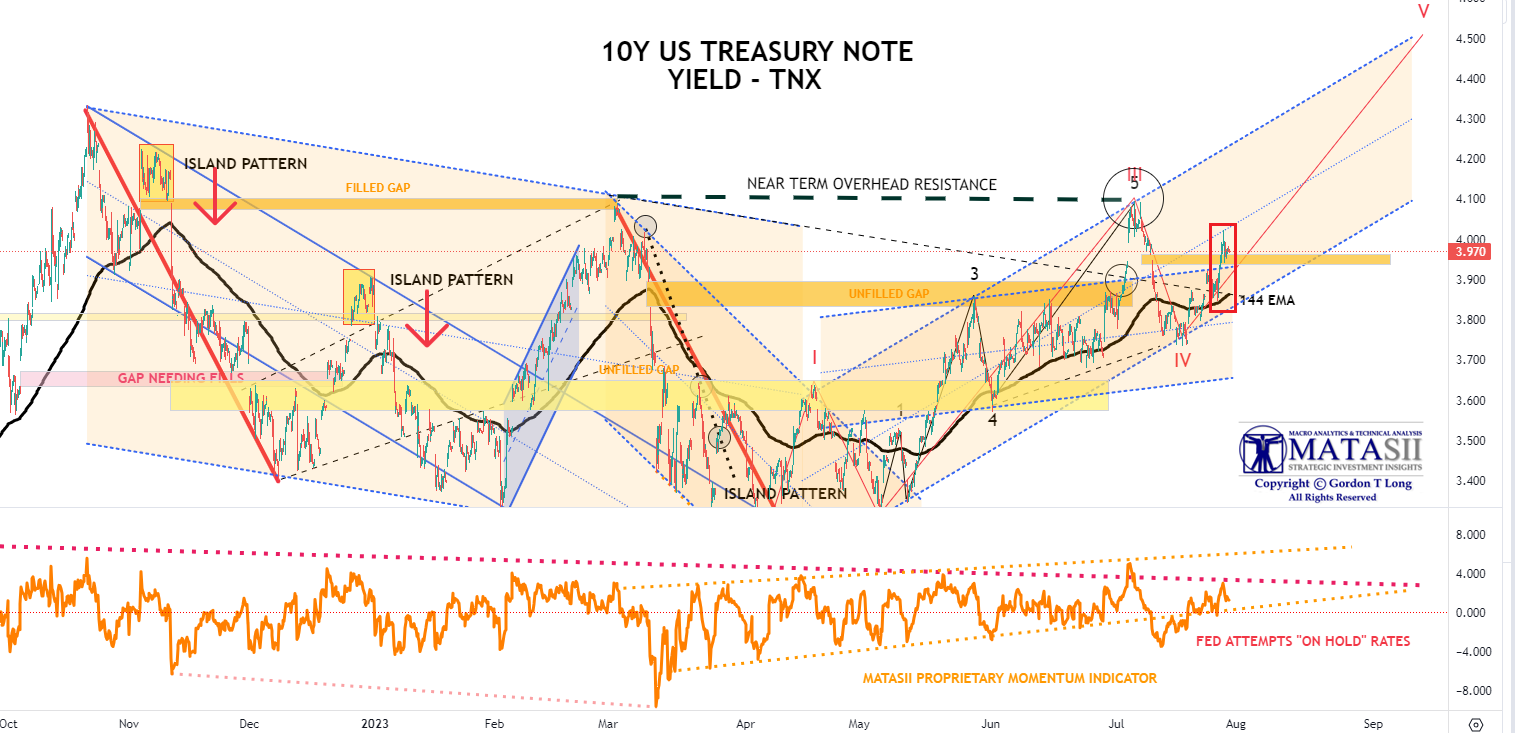
Reaction was evident in the Credit Markets (JNK), the US Dollar (DXY) and in the US Treasury Market. The all important US 10Y Treasury Note surged from ~ 3.8% through the initial overhead resistance level of 4.0%.
YOUR DESK TOP / TABLET / PHONE ANNOTATED CHART
Macro Analytics Chart Above: SUBSCRIBERS
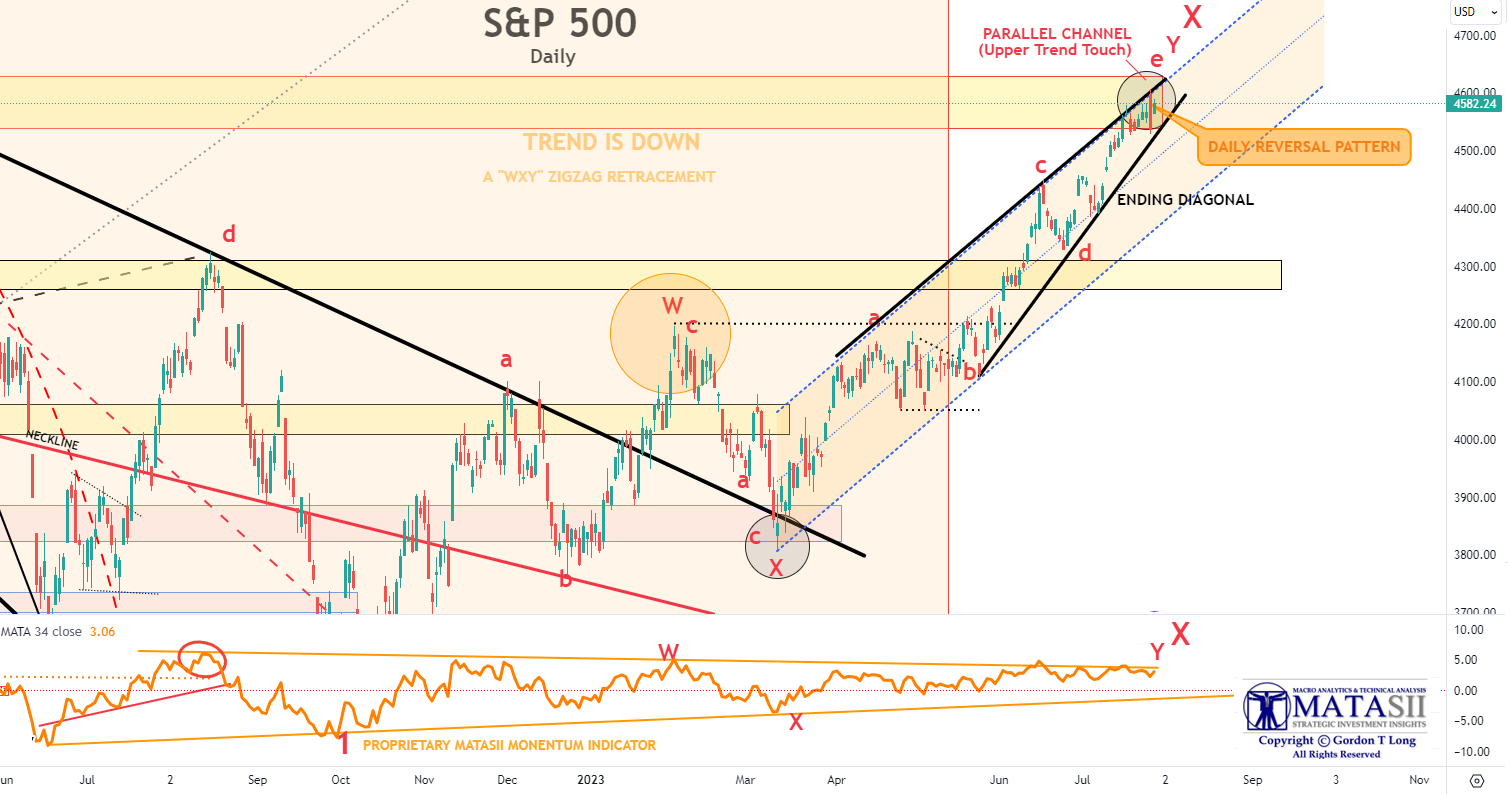
2- A REVERSAL ENGULFING PATTERN
On Thursday we received a Daily Reversal Engulfing Pattern within an Ending Diagonal and the top trend line of the S&P 500 recent trend channel. This along with the MATASII Momentum Indicator (bottom pane) unable to break its longer term overhead trend resistance line.
YOUR DESK TOP / TABLET / PHONE ANNOTATED CHART
Macro Analytics Chart Above: SUBSCRIBER LINK
It is important to note that we did not get a Weekly Reversal Engulfing Pattern on the S&P 500, suggesting that this may only be shorter term duration consolidation signal.
3- MATASII PROPRIETARY INDICATORS
Neither the MATASII CROSS nor the MATASII MOMENTUM INDICATORS have yet registered a reversal on a Daily basis!
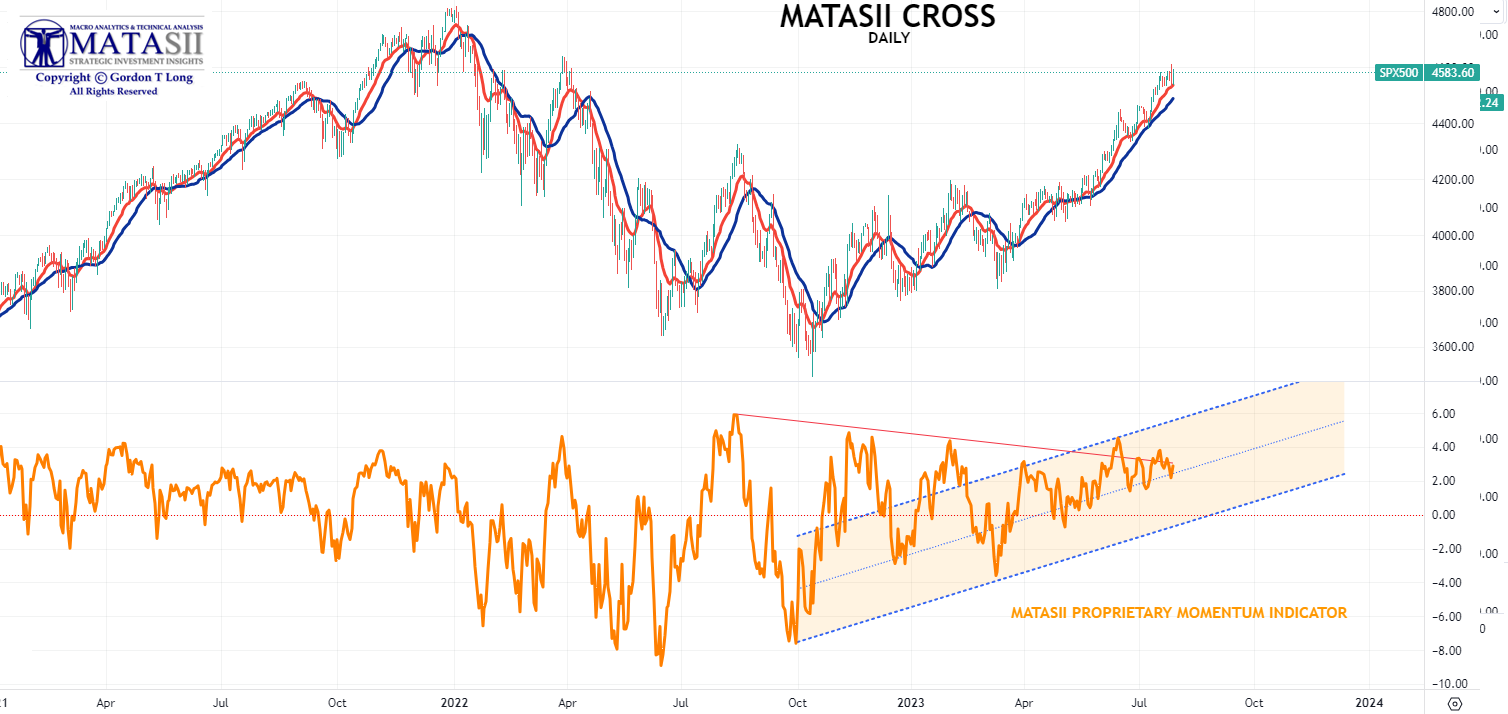
At best we can conclude that we may have short term weakness ahead,
but not yet a confirmed major reversal!
FAIR USE NOTICE This site contains copyrighted material the use of which has not always been specifically authorized by the copyright owner. We are making such material available in our efforts to advance understanding of environmental, political, human rights, economic, democracy, scientific, and social justice issues, etc. We believe this constitutes a ‘fair use’ of any such copyrighted material as provided for in section 107 of the US Copyright Law. In accordance with Title 17 U.S.C. Section 107, the material on this site is distributed without profit to those who have expressed a prior interest in receiving the included information for research and educational purposes. If you wish to use copyrighted material from this site for purposes of your own that go beyond ‘fair use’, you must obtain permission from the copyright owner.
NOTICE Information on these pages contains forward-looking statements that involve risks and uncertainties. Markets and instruments profiled on this page are for informational purposes only and should not in any way come across as a recommendation to buy or sell in these assets. You should do your own thorough research before making any investment decisions. MATASII.com does not in any way guarantee that this information is free from mistakes, errors, or material misstatements. It also does not guarantee that this information is of a timely nature. Investing in Open Markets involves a great deal of risk, including the loss of all or a portion of your investment, as well as emotional distress. All risks, losses and costs associated with investing, including total loss of principal, are your responsibility.