Gordon T Long
Global Macro Research | Macro-Technical Analysis
GLOBAL MACRO
US ECONOMICS
THE STEALTH BIDENOMIC LIQUIDITY PUMP
The tightening of credit and lending has been underway since the beginning of 2023, yet there seems to be plenty of credit and spending? Shouldn’t we have seen more impact by now?
The answer is yes – if these were normal times, but they’re not!
There is a simple reason for this and that is the Stealth Liquidity Pump currently being employed as part of Bidenomics. The schematic of how it works, supporting charts and discussion are shown below.
My colleague Richard Duncan has documented extensively that unless real US credit grows by 2% or more, historically the economy will slow and fall into a recession. Credit & Debt are the mechanisms by which money is created and when this transmission mechanism fails to expand, the Federal Reserve is left “pushing on a string”! The only way around this is to bypass this mechanism and place the money created by the Fed directly in the hands of the private sector. That is precisely what the Biden Regime is currently doing through its stealth liquidity pump and massive deficit, pending in the form of extended forbearance mandates, extensive green energy and climate change subsidies and exploding regulatory state spending. Bidenomics is pumping trillions of dollars directly into the economy and not doing it through the banking system. It is fundamentally their implementation of MMT or Modern Monetary Theory.
We all knew it was inevitable, but it seems that few yet recognize what is happening as they try to understand a still rising stock market, tight labor markets and an apparent vibrant private sector.
This will soon end as the: i) Rate of Fiscal Deficit Spending slows, ii) Mispricing (VIX) and Repricing (Credit and Bonds) of Risk increases, iii) Revaluation of Collateral (CRE) accelerates and
iv) the lag of Monetary policy “kicks-in”. We fully anticipate this to begin to be evident during the Q2 earnings conference call guidance details, though not yet in the earnings.
Earnings will beat the already reduced by -6% to -9% estimates; outlooks will be taken down; margins will be seen to be compressing and cash hungry investments will be pulled in. We start this week with our newsletters having a heightened focus on anticipated changes in corporate earning guidance.
WHAT YOU NEED TO KNOW
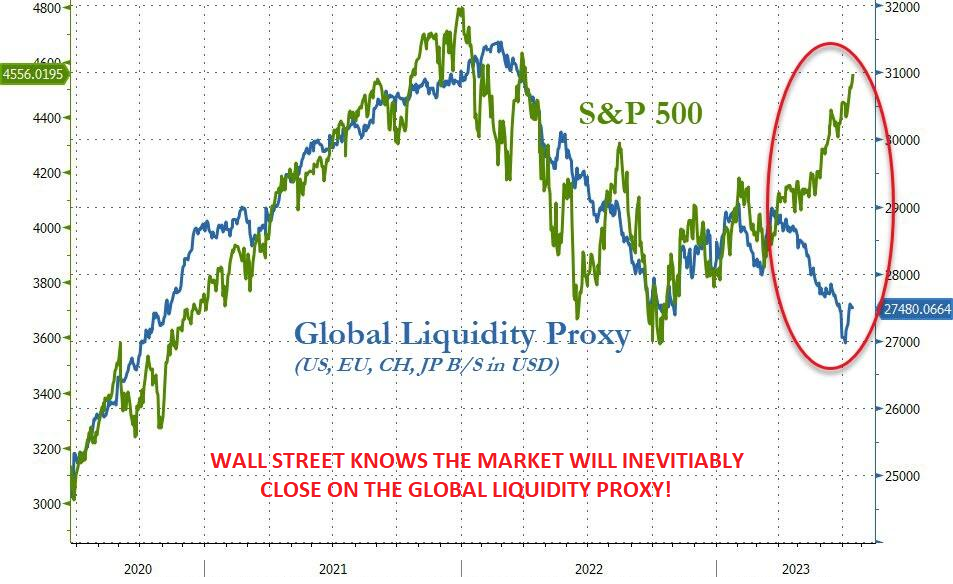
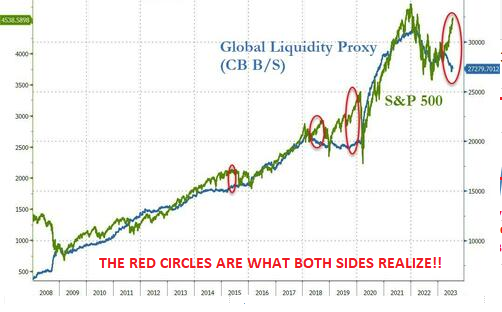
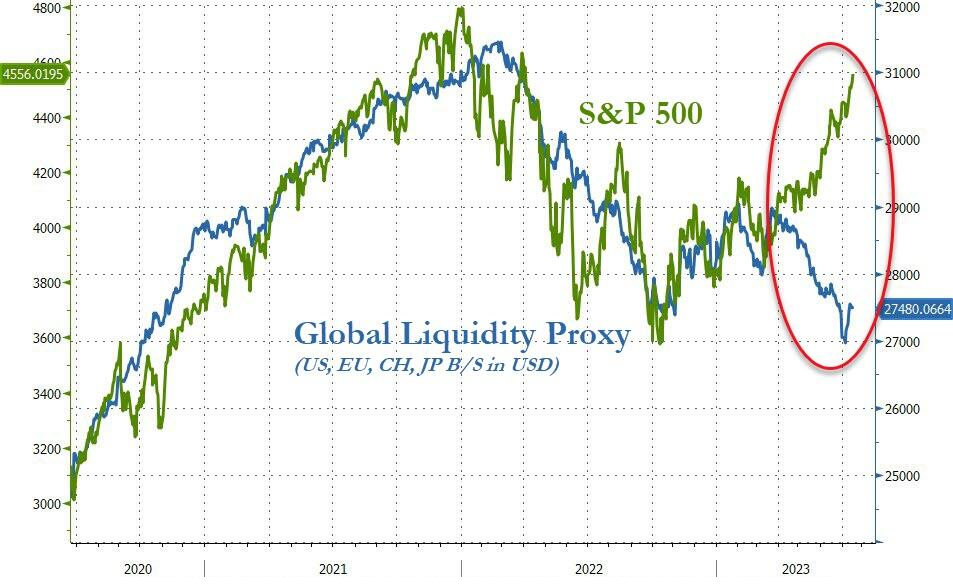 GLOBAL LIQUIDITY PROXY: Massive Decoupling!
US equity markets have decoupled from the global liquidity proxy for the first time in over a decade!
-
- Is the market pricing in a massive global re-liquification of asset markets?…OR
- Is this just signals of an over-hyped, over-extended, FOMO ‘Bear-Market rally’?
ANSWER: #2
THE BTFP LIQUIDITY PUMP – RRP & Bank Deposits Fall While BTFP Rises!
-
- The Fed’s RRP is effectively now being used to facilitate pumping Money into new US Treasury Issuances.
- This is aiding market liquidity by not allowing new issuances to reduce liquidity, but allow the depleting Covid Savings and Government deficit spending (MMT) to underpin the equity markets.
- This is an unintended consequence of a debt-ceiling deal expectantly getting done such that Money-Market Funds, (that previously invested $2.4T via the Fed’s overnight reverse repo facility) instead, have been allocating more of their cash to the deluge of new Treasury Bill issuances, taking the RRP down to ~$1.7T or $800B (current growth of the TGA).
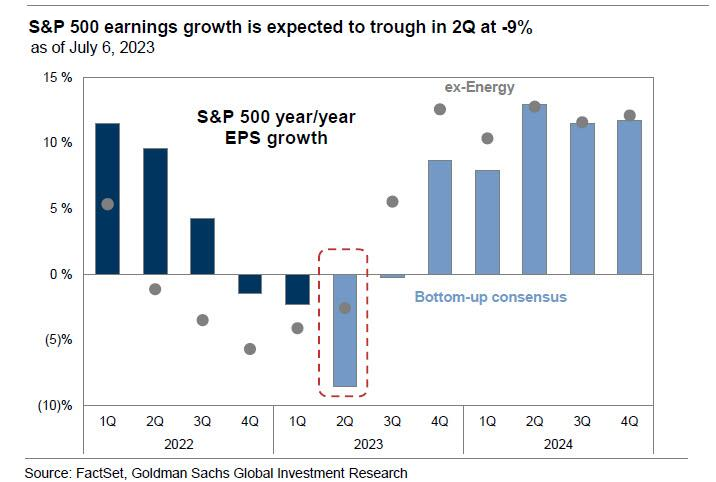
EARNINGS SEASON – How You Make The Worst Earning Season Since Covid-19 a Positive Market Mover?
-
- Consensus Estimates for 2Q growth since the beginning of April have been cut from -6% to -9%.
- There is a major difference of opinion beween what Wall Street believes and what MainStreet expects. To understand this you need to examine the Sell Side versus the Buy Side.
BEHIND FRIDAY’S OPTIONS EXPIRATION – Coincided With Nasdaq 100 Rebalancing
-
- The monthly stock options expiry was Friday, the same day as the MAJOR Nasdaq 100 rebalancing. Additionally eyes were on the 0DTE option crowd – Monday & Tuesday will see the results? Expect volatility.
GLOBAL ECONOMIC REPORTING: What This Week’s Key Global Economic Reports Tell Us
-
- The all important Chinese Credit Impusle continues to deteriorate significantly.
- When the Credit Impulse is weighed against deteriorating Chinese Imports and Exports, it doesn’t paint a positive picture for the global manufacturing engine nor the Global economy!
-
- Citi cut China’s FY23 GDP growth forecast to 5.0% from 5.5%.
- Barclays cut China’s FY23 GDP growth forecast to 4.9% from 5.4%.
- JPMorgan cut China’s FY23 GDP growth forecast to 5.0% from 5.5%.
- Morgan Stanley cut China’s FY23 GDP growth forecast to 5.0% from 5.7%.
CONCLUSION
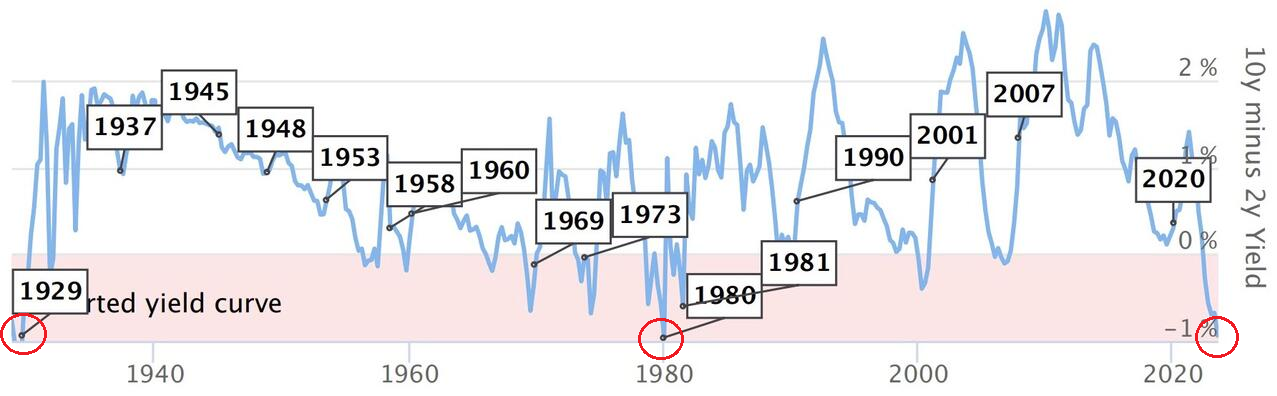 EVERYTIME THIS HAS HAPPENED
BofA: “Every Single Time” This Happened In The Last 40 Years, A Crisis Hits Markets! It is rare to have an indicator that works every single time; this is one of those rare instances…
The Yield Curve Is Now In The Deepest Inversion Since Volckers 1980 Inflation Crsis & 1929
This degree of inversion gives good reason to expect a serious economic event, whether a recession or even a full-blown economic crisis to occur!
“If the yield curve is so inverted, where is the mass unemployment and recession?” ANSWER: A SIZABLE LAG – There is historically a sizeable lag between the yield curve inverting and the onset of recession which we are nearing completion.
CREDIT
-
- NY Fed June SCE credit access survey overall rejection rate for credit applicants increased to 21.8%, which is the highest since June 2018 with the increase broad-based across age groups and the highest among those with credit scores below 680.
THE BTFP LIQUIDITY PUMP – RRP & Bank Deposits Fall While BTFP Rises!
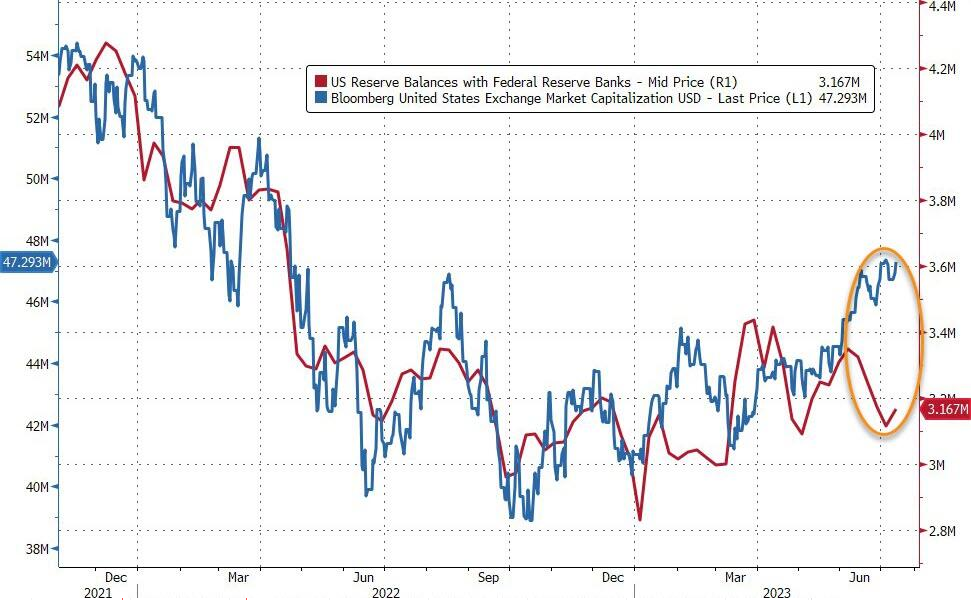 The Fed’s RRP is effectively being used to facilitate pumping Money into new US Treasury Issuances.
This is aiding market liquidity by not allowing new Treasury issuances to reduce liquidity but allowing the depleting Covid Savings and Government deficit spending (MMT) to underpin the equity markets.
This is an unintended consequence of a debt-ceiling deal expectantly getting done that Money-Market Funds (that once were part of $2.4 trillion invested via the Fed’s overnight reverse repo facility) instead have been allocating more of their cash (~$800B) to the deluge of new Treasury bill issuances.
CHART ABOVE RIGHT: The US equity market capitalization has completely decoupled from the declining trend in bank reserves at The Fed.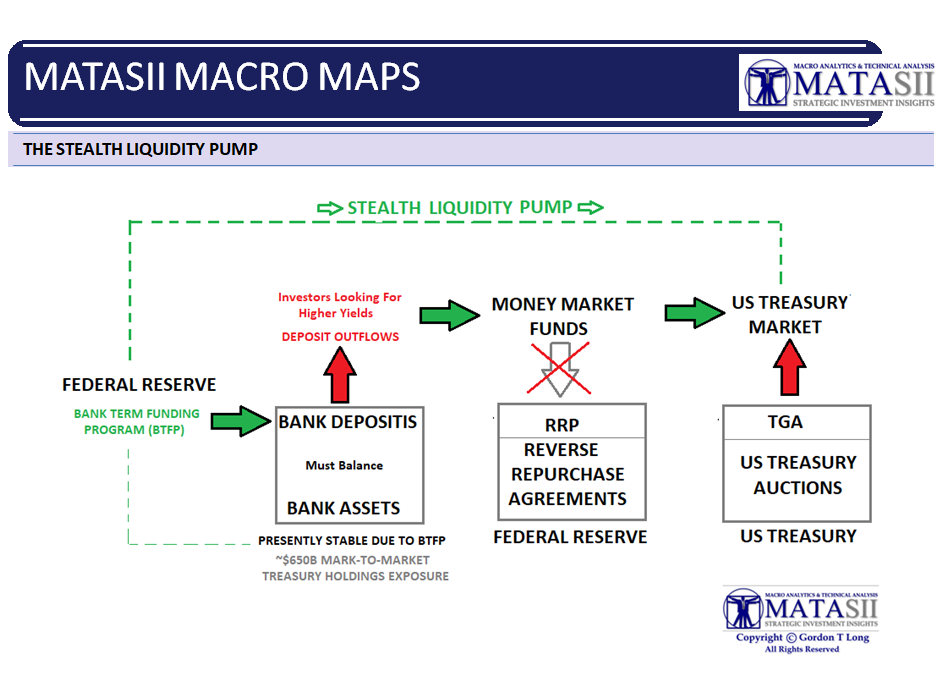
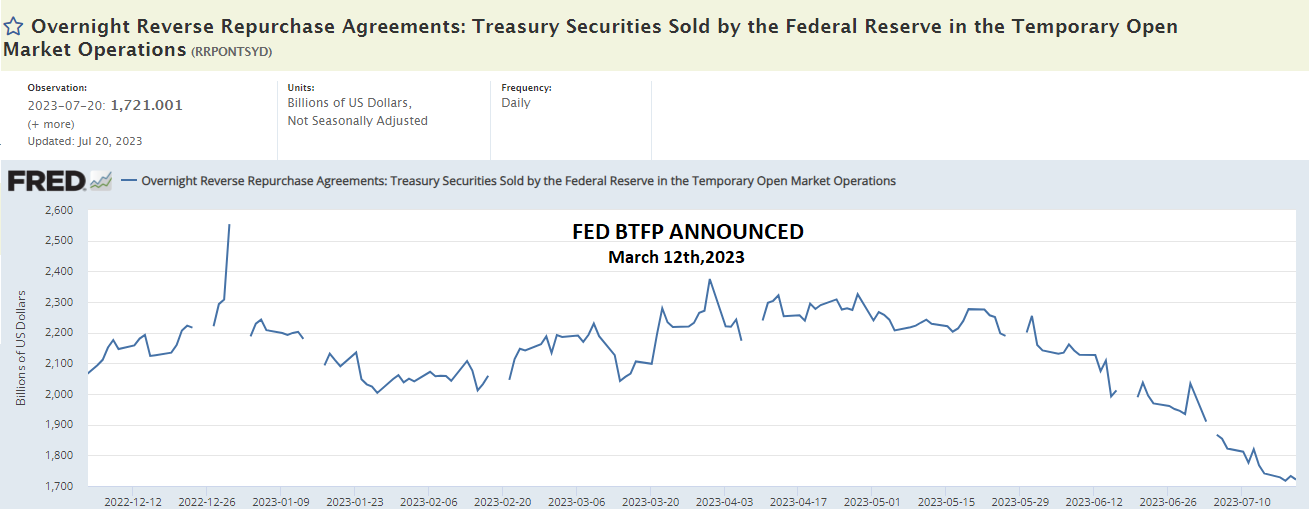
RRP – REVERSE REPURCHASE AGREEMENTS
Money-market funds have been the main reason why approximately $2.4 trillion has consistently sat overnight at the Federal Reserve’s reverse repo facility. The program was last offering a roughly 5% rate, New Treasury bills were felt to need to exceed this by about 10-20 basis points to draw it out. 1Y US Bills (and lower in duration) are currently yielding 5.36% and higher. The Fed’s RRP has fallen to ~$1.7T since the introduction of its’ BTFP.
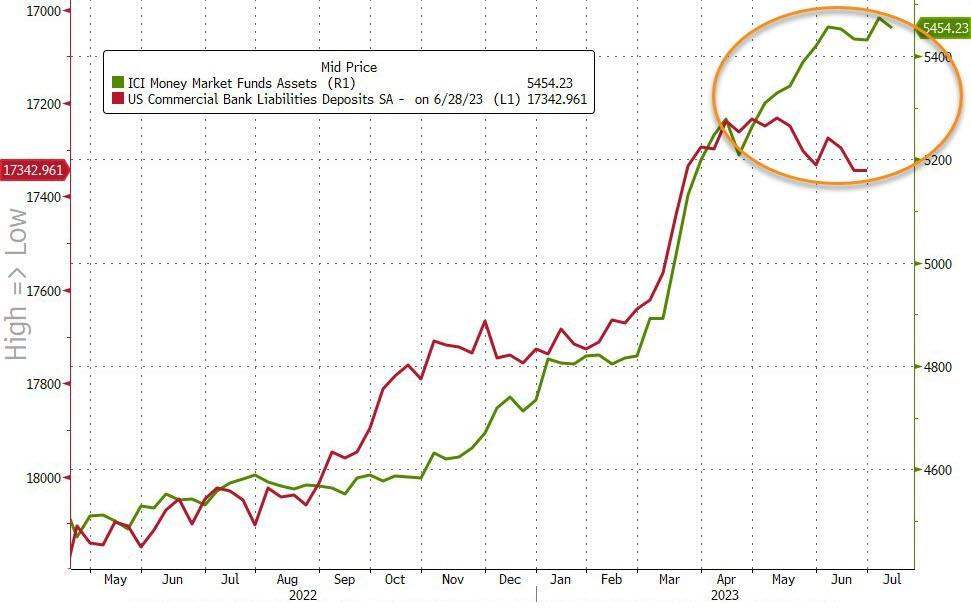
MONEY MARKET FUNDS
Money-Market assets and Bank Deposits decoupled when the Fed’s BTFP was introduced, and the Fed Fund Rate and short term UST bills began yielding competitive alternatives to the Fed’s RRP.
EARNINGS SEASON – How You Make The Worst Earning Season Since Covid-19 a Positive Market Mover?
 In the 9 quarters since the start of 2021 actual S&P Y-o-Y EPS growth has beat consensus expectations in 8 of the last 9 quarters. What is shocking about that is that estimates were not met in one of those quarters? Since the “Earnings Game” is so well “staged”, I can only conclude the analysts and corporate CFO’s didn’t have a handle on Covid as it hit. Many suggest the bar for earnings season is already set so low that even Biden could step over it without falling.
Consensus Estimates for 2Q growth since the beginning of April have been cut (STAGED) from -6% to -9%.
Reporting firms should be able to meet or exceed the low bar set for 2Q, which it is hoped by Wall Street could spark some renewed volatility to push markets even higher.
Wall Street is presently geared for 2Q 2023 to mark the trough in EPS growth if the staged consensus expectations are realized.
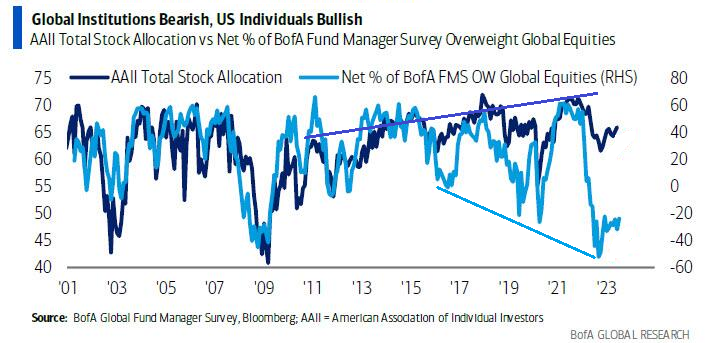
HOW DOES WALL STREET REALLY FEEL?
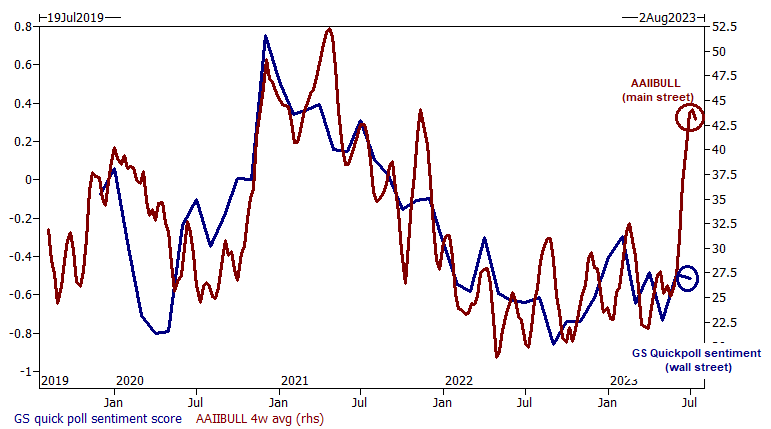 If you examine the chart to the right and the one below, there appears to be a major difference of option beween what Wall Street beliieves and what MainStreet expects.
Why is that?
One of the reasons is best explained by understanding the difference between the “BUY Side” and the “SELL Side”.
 BUY SIDE v SELL SIDE
-
- SELL SIDE: Market the selling of bank brokerage products retail and institutional buyers.
- BUY SIDE: Make the internal investment decisions for the banks’ Profit and Loss.
There is a regulatory “Fire Wall’ between these operations so banks cannot be accused of any devious strategies that “pump and dump” assets.
Below we first show the actual reported earnings of the money center banks as reported this week that the BUY side is responsible for. Then we show what the banks SELL side is telling the markets. I leave it to you to draw your own conclusions on what might be ahead for the market?
1- RECAPPING THE BANKS REPORTED EARNINGS
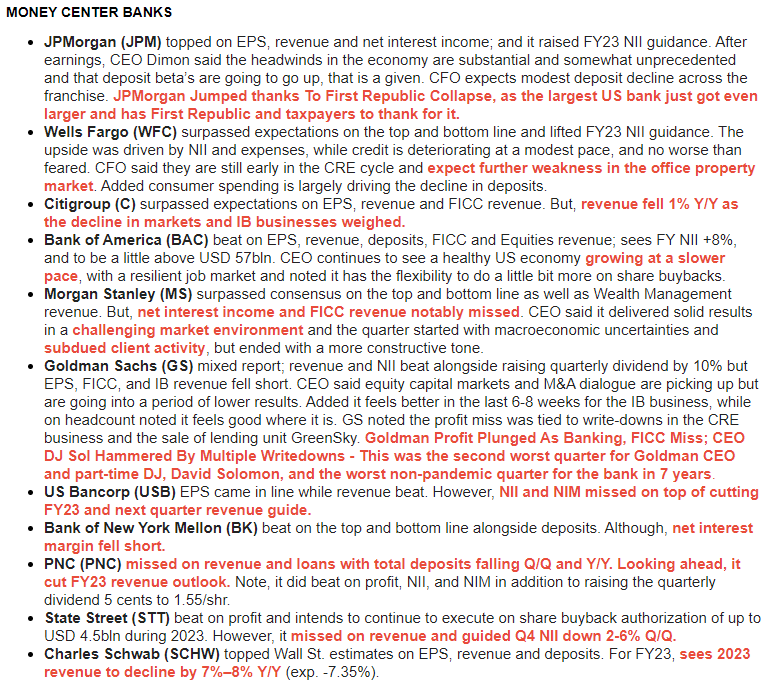
We have taken the US Money Center Banks listed above that have reported their Q2 earnings and plotted them against the S&P 500 below. The Banks’ stocks appear to be in a Corrective structure, suggesting more downside to soon follow. Meanwhile the S&P 500 has been greatly distorted by the Nasdaq 100 “Magnificent Seven”, which in turn has been distorted by Nvidia (NVDA).
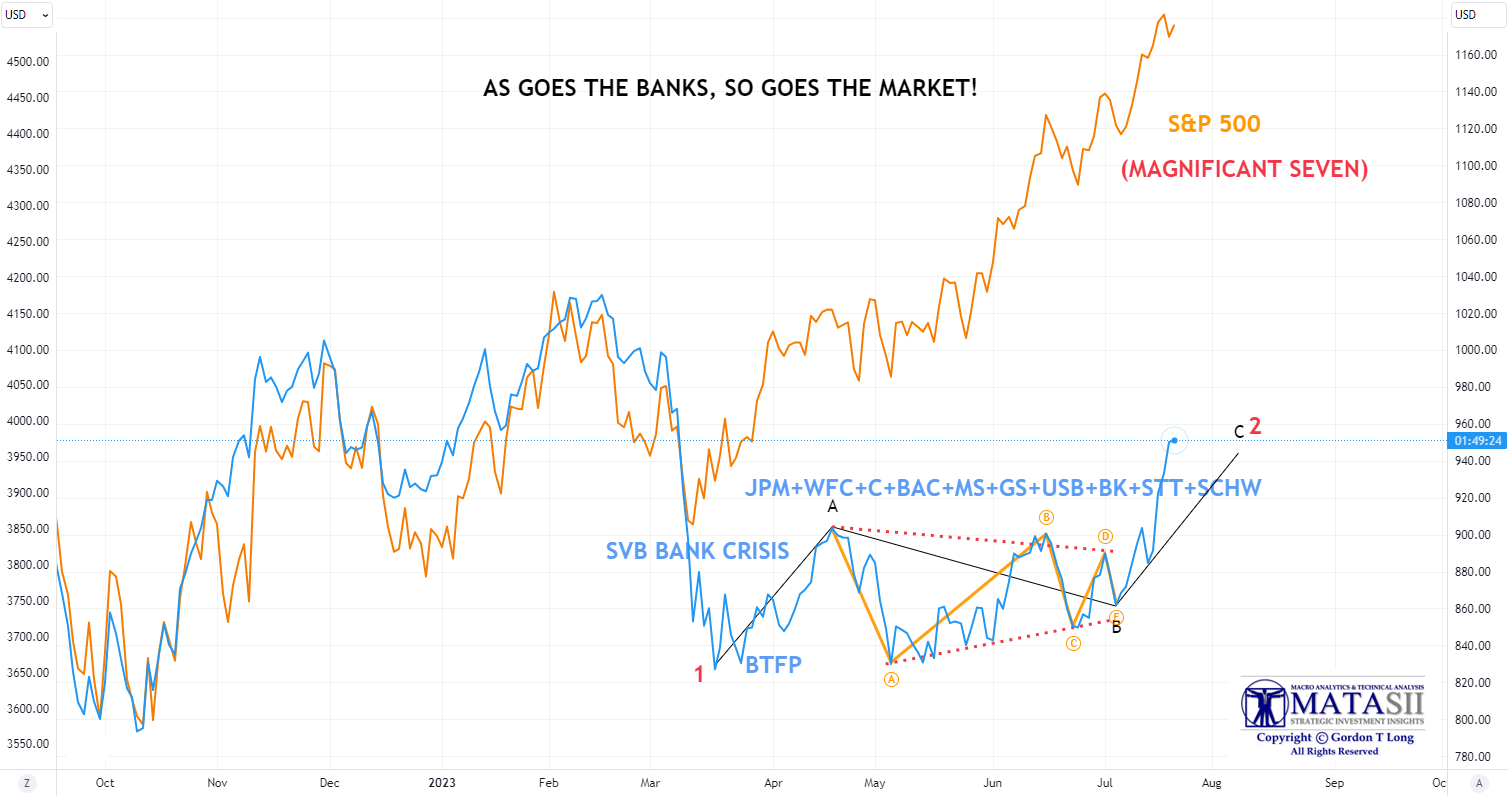
YOUR DESK TOP / TABLET / PHONE ANNOTATED CHART
Macro Analytics Chart Above: SUBSCRIBERS
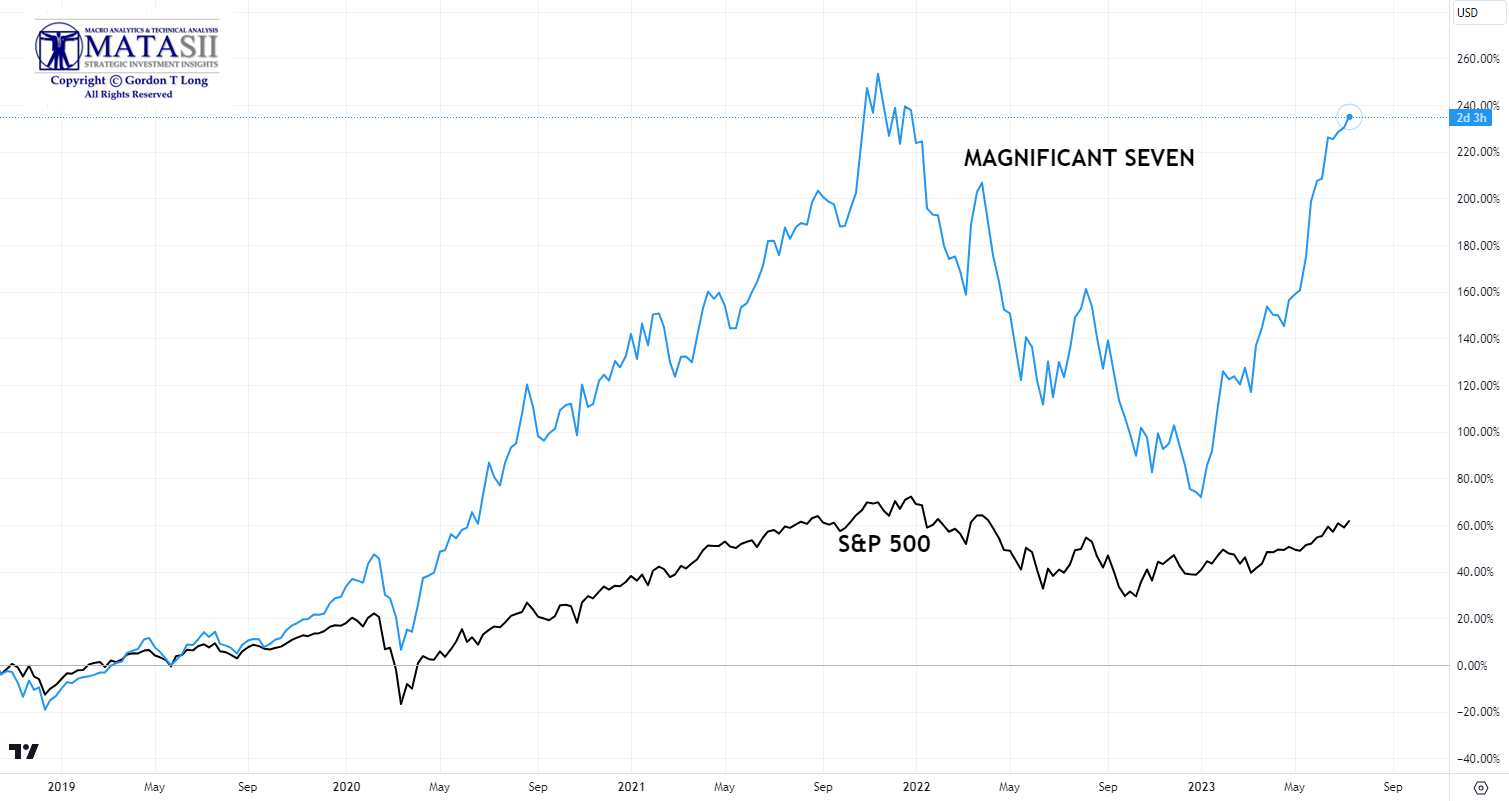
S&P 500 v MAGNIFICANT SEVEN
YOUR DESK TOP / TABLET / PHONE ANNOTATED CHART
Macro Analytics Chart Above: SUBSCRIBER LINK
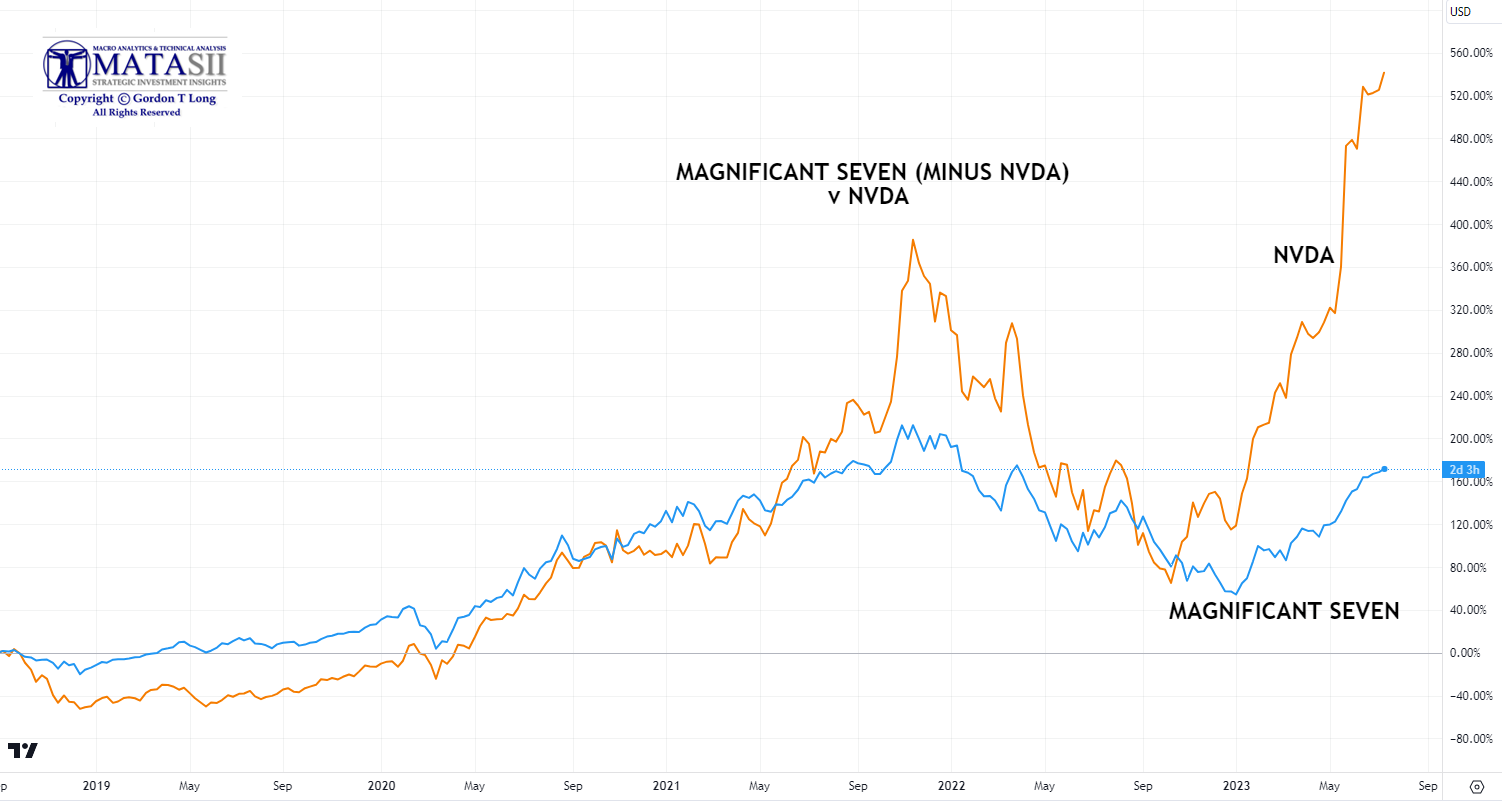
MAGNIFICANT SEVEN v NVIDIA
YOUR DESK TOP / TABLET / PHONE ANNOTATED CHART
Macro Analytics Chart Above: SUBSCRIBER LINK
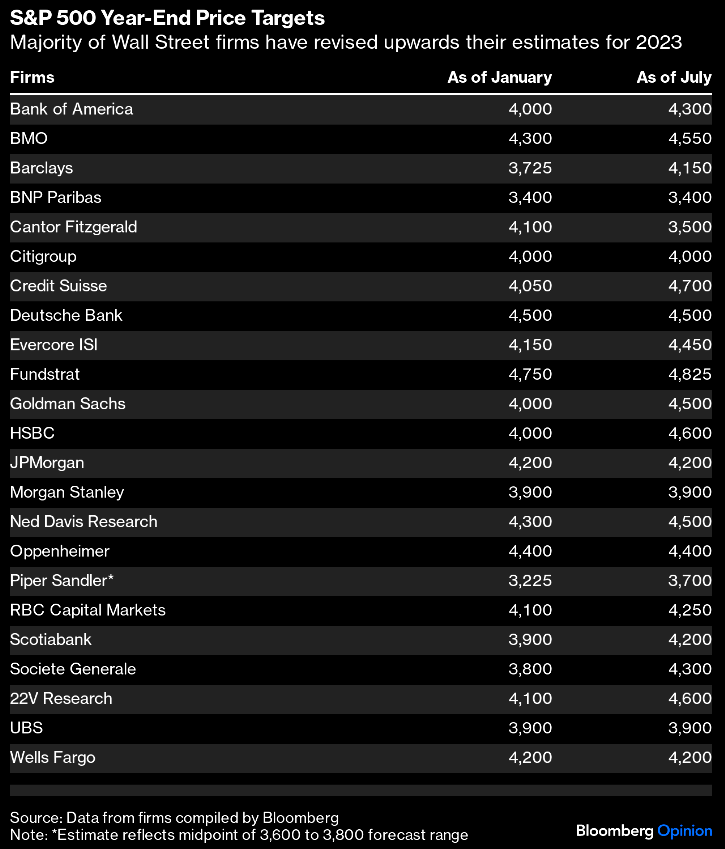
2- SELL SIDE MARKET OUTLOOKS
Though Wall Street Bank Analysts revised estimates up from those issued at the beginning of the year, they now more or less are flat against where the market is with some seeing slightly more upside. These analysts have tremendous pressure on them from “field operations” for strong estimates to attract new AUM (Assets Under Management).
BEHIND FRIDAY’S OPTIONS EXPIRATION – Coinciding With Nasadaq 100 Rebalancing
We received monthly stock options expiry on Friday, the same day as the Nasdaq 100 rebalanced, with fingers also being pointed at the 0DTE option crowd.
NASDAQ 100 REBALANCING (NOTES BELOW AS OF MID-DAY FRIDAY NEWSLETTER WRITING)
The heavy weighting of mega-cap tech stocks in NDX (and thereby QQQ) has gotten so extreme that the index can no longer be considered well-diversified. That is causing Nasdaq to reduce the weights of Nvidia (NVDA), Microsoft (MSFT), Amazon (AMZN), Tesla (TSLA), Alphabet (GOOG/GOOGL), Meta Platforms (META) and Apple (AAPL) within the index. Since the index change is effective on Monday, funds that track the index need to adjust their positions as of today’s (Friday) close.
In theory, we should expect to see relatively heavy selling in those names on the close and buying in the 92 other names that will be going up in weight. We also might expect to see some pressure on SPY, because those stocks are all heavily weighted in the S&P 500 as well. That said, on that basis, QQQ should underperform today. But nothing is a given here.
-
- As a result, we see a preponderance put buying in QQQ and the affected stocks at this point.
- We also see some marginal net call buying in some of the smaller names in NDX. But with markets relatively unchanged at midday, it is hard to separate the causes.
- Earlier today we saw some aggressive pre-market buying of ES futures. The aggressive run-up seemed to have the hallmarks of a 0DTE move. And it very well might have been that type of rally.
- That is thanks to an overlooked feature of monthly expirations. On most days, we have but one set of 0DTE options, but on monthly expirations we have two. A key feature of monthly expirations is that we have index options that expire on the open. As with all options on expiration day, those become 0DTE. Remember, every option becomes 0DTE on expiration, thus every options class has 0DTE options on major expiration days.
- Thus, we have the potential for a fascinating afternoon on what otherwise might have shaped up to be a sleepy mid-summer Friday.
THURSDAY- PRE-OPTIONS EXPIRATION
-
- Stocks tumbled on Thursday with the NDX posting its 2nd worst day of the year (-2.28%) behind February 21st’s (-2.41%), as poor earnings receptions for NFLX and TSLA catalysed a sharp pullback.The factors of options expiration and rebalancing may have been giving weight to Thursday’s sell-off.The SPX and RUT held up slightly better.
- Treasuries saw heavy selling ahead of next week’s auctions (10yr +10bps at 3.85%), accentuated by initial jobless claims, (which chime with the July NFP survey week) hitting an early May low, with the lacklustre Philly fed mfg. survey and rise in continuing claims an afterthought, while the miss in existing home sales also had little sway.
- The DXY was firmer, just failing to clip 101 at its best, as it benefitted from the spike higher in US yields.
- Oil prices were just about firmer in what was another choppy session amid the mixed economic data and firmer Dollar; Chinese imports of crude oil surged in the latest monthly release. Nat Gas futures surged to their highest since early July with particularly low storage builds as hot weather, particularly in Texas, makes its mark.
FRIDAY OPTION EXPIRATION
-
- Stocks gave up moderate gains on Friday as stocks traded in a choppy fashion. The Utilities sector was the outperformer, while Tech stocks lagged. Further choppiness was seen towards the end of the session, which traders attributed to the Nasdaq 100’s special rebalancing.
- Despite the equity market jitters on Thursday, indices (SPX, DJIA) end the week with gains. Treasury yields saw modest declines on Friday, though the 2s sector lagged ahead of next week’s 2s, 5s, 7s supply, as well as the FOMC confab, where the central bank is expected to lift rates by 25bps – traders will be looking for clues as to whether this is the final hike of the cycle.
- On the week, Treasuries are lower amid some mixed data and Fed terminal rate uncertainty.
- The most notable development in FX was the JPY’s slide against the Buck after dovish BoJ sources report ahead of next week’s confab, which sent USD/JPY to the highest level since July 10th.
- In addition to the FOMC and BoJ meetings next week, the ECB will also make a policy announcement, while the corporate earnings docket is heavy.
LOOK FOR MORE “CHOPPINESS” MONDAY & TUESDAY.
GLOBAL ECONOMIC REPORTING: What This Week’s Key Global Economic Reports Tell Us
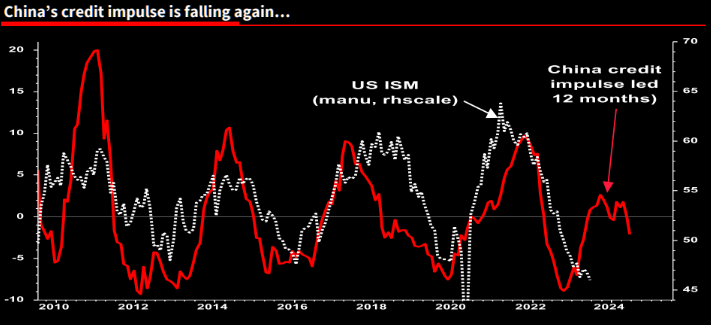 The all important Chinese Credit Impulse continues to deteriorate.
When compounded against Chinese Imports and Exports also deteriorating, it doesn’t paint a good picture for China nor the Global economy!
-
- Citi cut China’s FY23 GDP growth forecast to 5.0% from 5.5%.
- Barclays cut China’s FY23 GDP growth forecast to 4.9% from 5.4%.
- JPMorgan cut China’s FY23 GDP growth forecast to 5.0% from 5.5%.
- Morgan Stanley cut China’s FY23 GDP growth forecast to 5.0% from 5.7%.
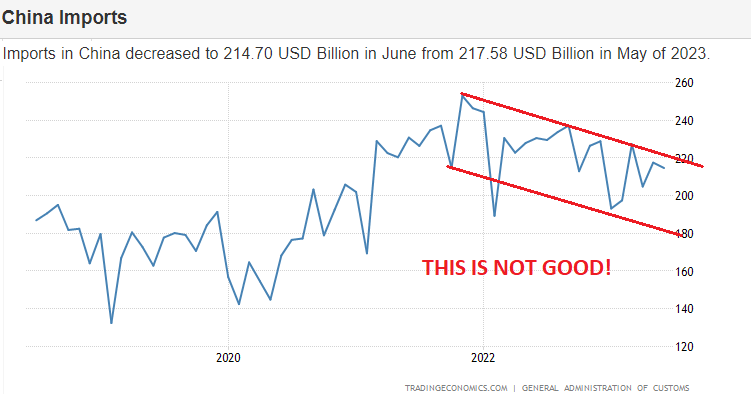
CHINA IMPORT
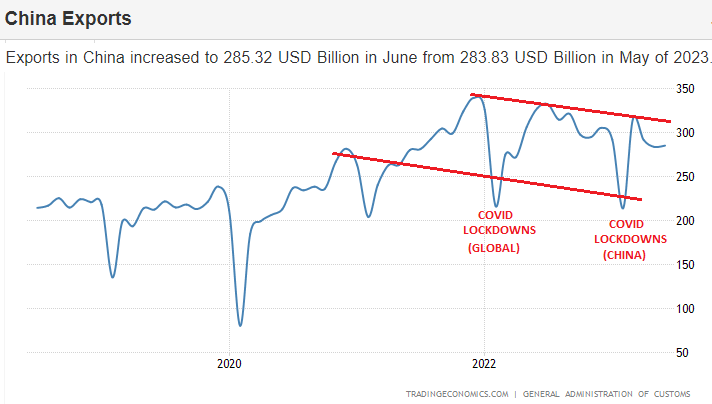
CHINA EXPORTS
US IMPORT & EXPORTS – Also A Problem Impacting The Twin Deficit to GDP Ratio
- On a Y/Y basis, import prices declined 6.1%- the largest 12mth drop since May 2020. while export prices fell 12%- the largest decline since the data’s inception in September 1984.
IMPORTS
-
- US import prices declined 0.2% in June, albeit not as much as the prior fall of 0.6%, but deeper than the expected 0.1% fall.
- Ex-fuel prices declined 0.4% following an unchanged read previously, while foods, feeds and beverages fell 0.3% (prev. -1.3%).
- Meanwhile, prices for each of the major finished goods import categories were down in June.
EXPORTS
- On the other side, export prices declined 0.9% from the prior drop of 1.9%, but deeper than the expected -0.2%.
-
- Agricultural exports fell 1.6% (prev. -2.4%), while ex-ags fell 0.9% after a -1.9% drop in May.
- Meanwhile, prices for each of the major finished goods export categories were up in June.
- The drop in import prices helps support the disinflation narrative of consumer goods, particularly after the cool CPI and PPI reports this week.
- However, this release will do little to alter Fed thinking with a July hike almost fully baked in.
-
- Attention in coming months will turn to whether the Fed commits to their June dot plots of two more hikes in 2023, with great attention on inflation and labour market metrics ahead of the September meeting. Note, Fed Governor Waller labelled the September meeting as a “live” one.
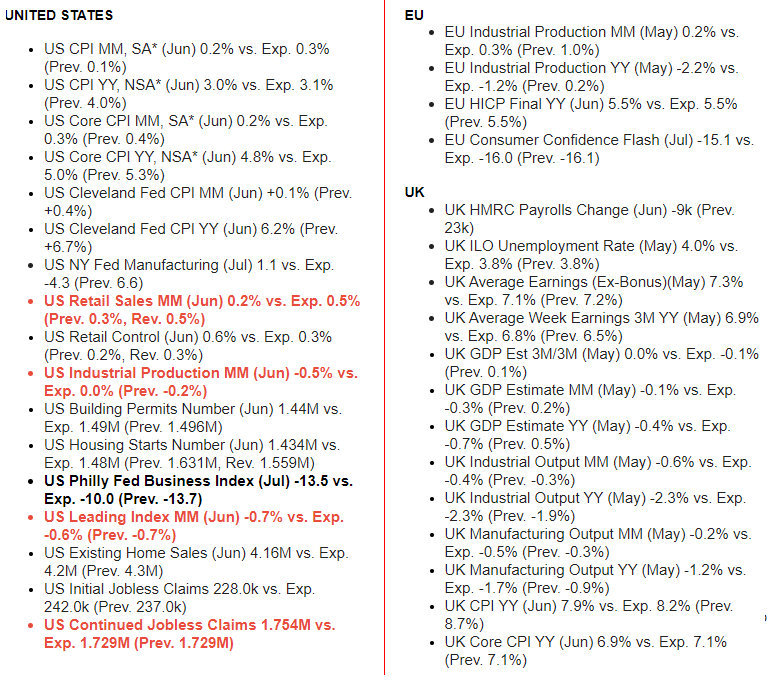
WHAT DOES YOUR SCAN OF THE DATA BELOW TELL YOU? – THE MEDIA AVOIDS BAD NEWS!
We present the data in a way you can quickly see what is happening. Anything in Red is further deterioration.
In Green is an improvement over the last release.
THIS WEEK WE SAW
Exp=Expectations, Rev=Revision, Prev=Previous
WHERE HIGHLIGHTED: RED = Deterioration, Green = Improvement
CONCLUSION
The Yield Curve Is Now In The Deepest Inversion Since 1981
This degree of inversion gives good reason to expect a serious economic event, whether a recession or even a full-blown economic crisis!
“if the yield curve is so inverted, where is the mass unemployment and recession?”
A SIZABLE LAG – There is historically a sizeable lag between the yield curve inverting and the onset of recession.
-
- The yield curve inverted in 1989, but the 1990 recession did not begin until 13 months later.
- The yield curve inverted in August 2006, but the Great Recession did not begin until December 2007, 16 months later.
- The yield curve again inverted in May 2019, and it is extremely likely there would have been a recession in late 2020 had the Federal Reserve not engaged in massive amounts of monetary pumping throughout the year to blow a series of bubbles designed to cover up the economic effects of forced lockdowns on the economy.
- Now, the yield curve has been inverted since November 2022, but only seven months have passed since then. Experience suggests we could be looking at least another six months before the effects are clear.
CREDIT
-
- NY Fed June SCE credit access survey overall rejection rate for credit applicants increased to 21.8%, which is the highest since June 2018 with the increase broad-based across age groups and the highest among those with credit scores below 680.
SOMETHING IS GOING ON WITH THE US DOLLAR?
THERE IS A PRICE TO PAY WITH EXPANDED FISCAL DEFICITS
Click All Charts to Enlarge
1- SITUATIONAL ANALYSIS
THERE IS A PRICE TO PAY FOR FISCAL EXCESS!
 Sustained Fiscal excess always leads inevitably to:
-
- Rising Inflation
- Currency Devaluation
- Lowered Standards of Living
There is an old adage that “there is no free lunch!” Nowhere is this more evident than in the global currency markets. Poor country economic, fiscal and monetary policies are meted out through the devaluation of a country’s currency.
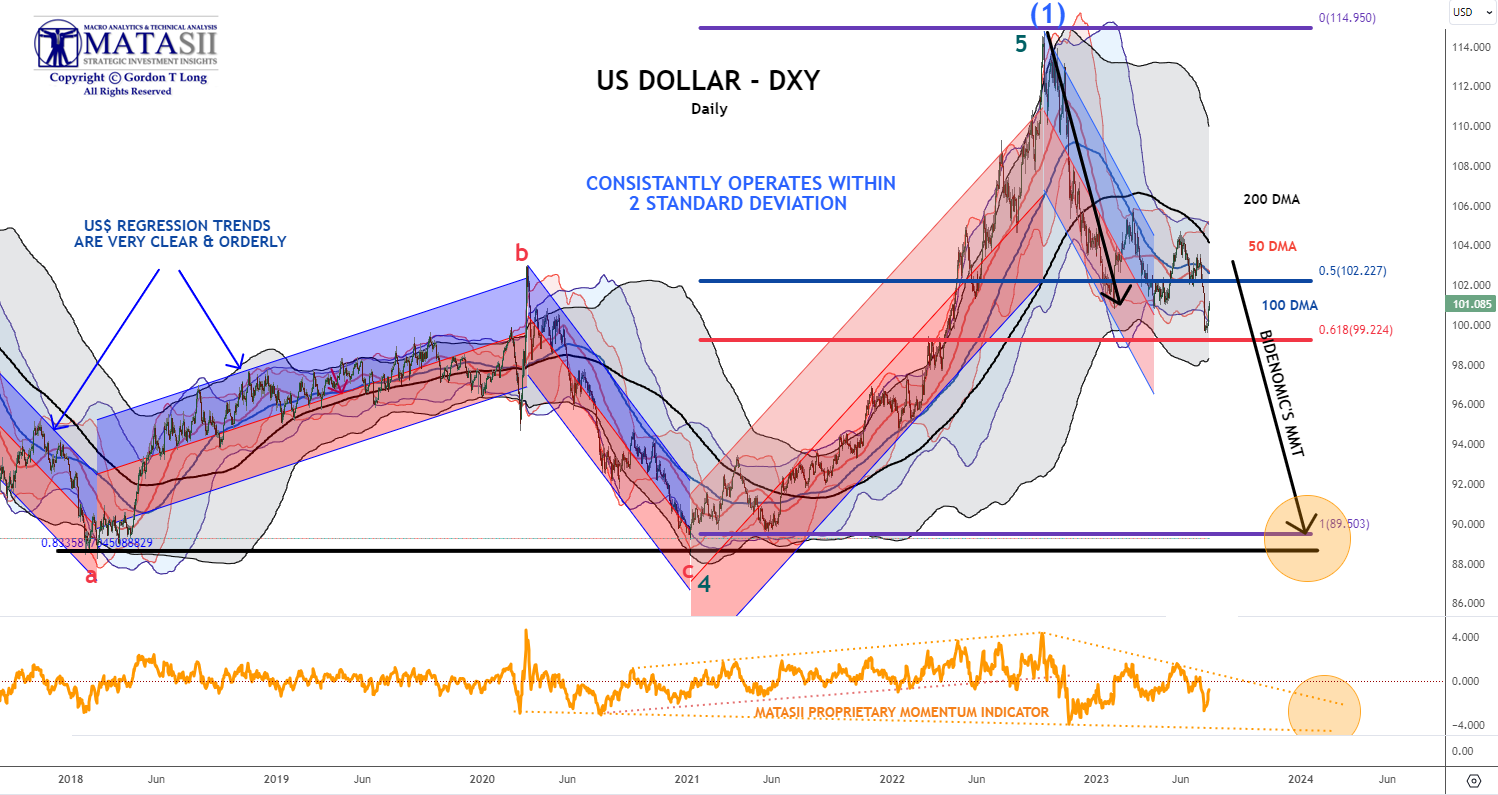
The US Dollar historically has followed longer term trends of 6-10 years. The last trend, which is an uptrend, began in 2011 after the Financial Crisis and lasted until the high in October 2022.
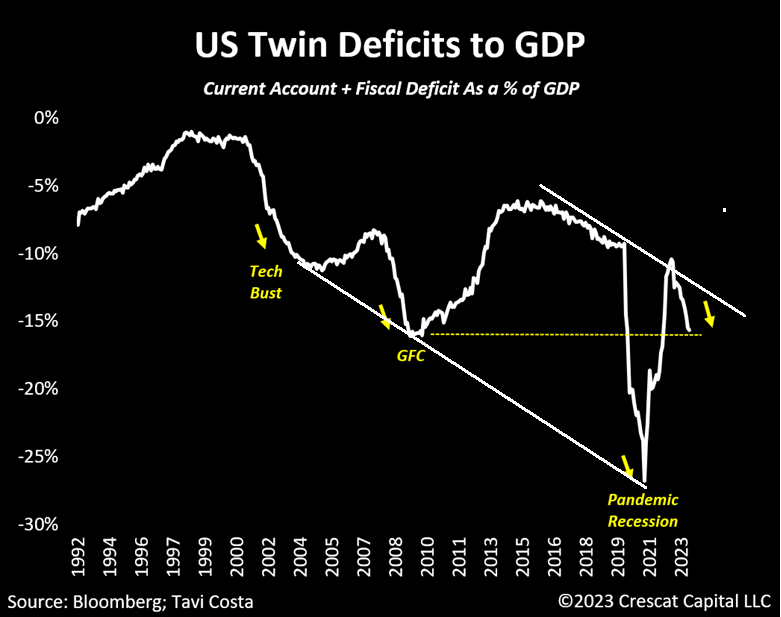
Additionally, a country’s currency over time tracks very closely to what is referred to as its Twin Deficits. This is the addition of Current Account and Fiscal Deficits measured as a percentage of GDP. (Chart Right)
The US fiscal excess has been nothing short of astounding and historic by almost any measure. (Chart Below)
 Meanwhile the US dollar has held up relatively well until recently because other fiat currency based countries have been equally as prolific in their Covid fiscal spending.
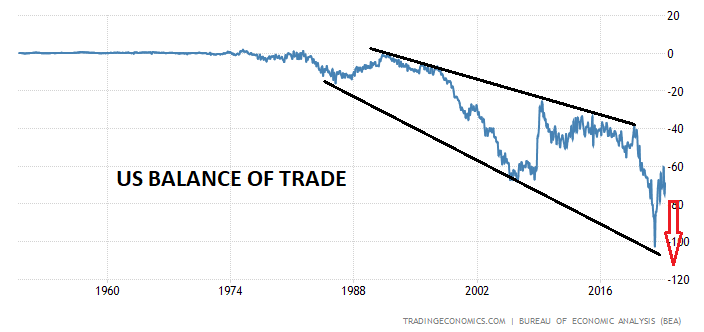
But that has been changing as Bidennomics pushes even more spending than others, while the US Balance of Trade begins falling once again (Chart Right). Additionally, the weaponization of the US dollar as a foreign policy tool has pushed many countries into finding an alternative to the US dollar as a reserve currency
All of the above augers as a recipe for a falling dollar!
2- TECHNICAL ANALYSIS
US DOLLAR
The US Dollar, though falling since October 2022, has been in a consolidation pattern since the beginning of 2023. We see the consolidation to be a “B” wave of an “ABC” corrective pattern, eventually taking us down towards support at ~88 with leg “A” equaling leg “C”.
YOUR DESK TOP / TABLET / PHONE ANNOTATED CHART
Macro Analytics Chart Above: SUBSCRIBERS
We have a fairly clear Head and Shoulders formation with a neckline yet to be confirmed as broken. The measured Head and Shoulders (dotted black lines) also project a drop to ~88.
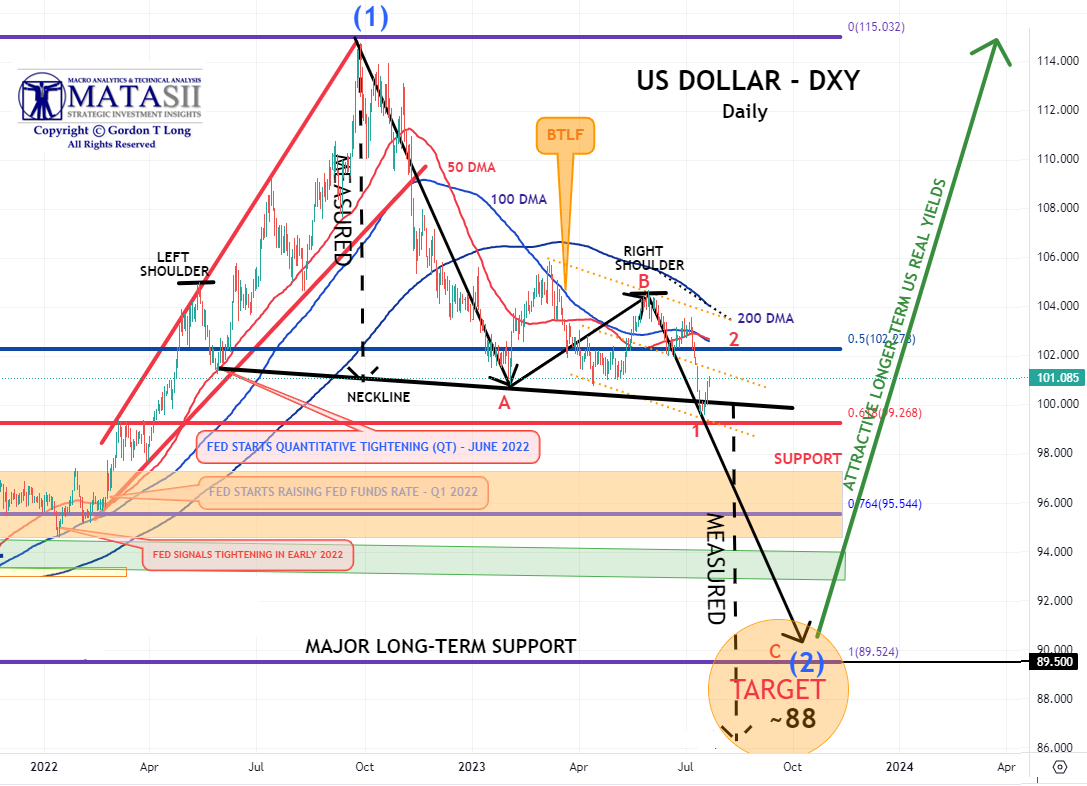
YOUR DESK TOP / TABLET / PHONE ANNOTATED CHART
Macro Analytics Chart Above: SUBSCRIBER LINK
COMMODITIES
When the US dollar falls, commodity prices historically rise in US dollars.
We therefore expect to see commodity strength to accompany the “C” leg of the US dollar.
However, it won’t be a broad based Commodity lift as we experienced in 2020-2022. This is because Imports and Exports volumes are falling in both China and the US. Industrial commodities will be balancing a falling dollar with weak product demand. Copper is likely to be a prime example of this. Expect Industrial commodities rise to be timid.
COPPER
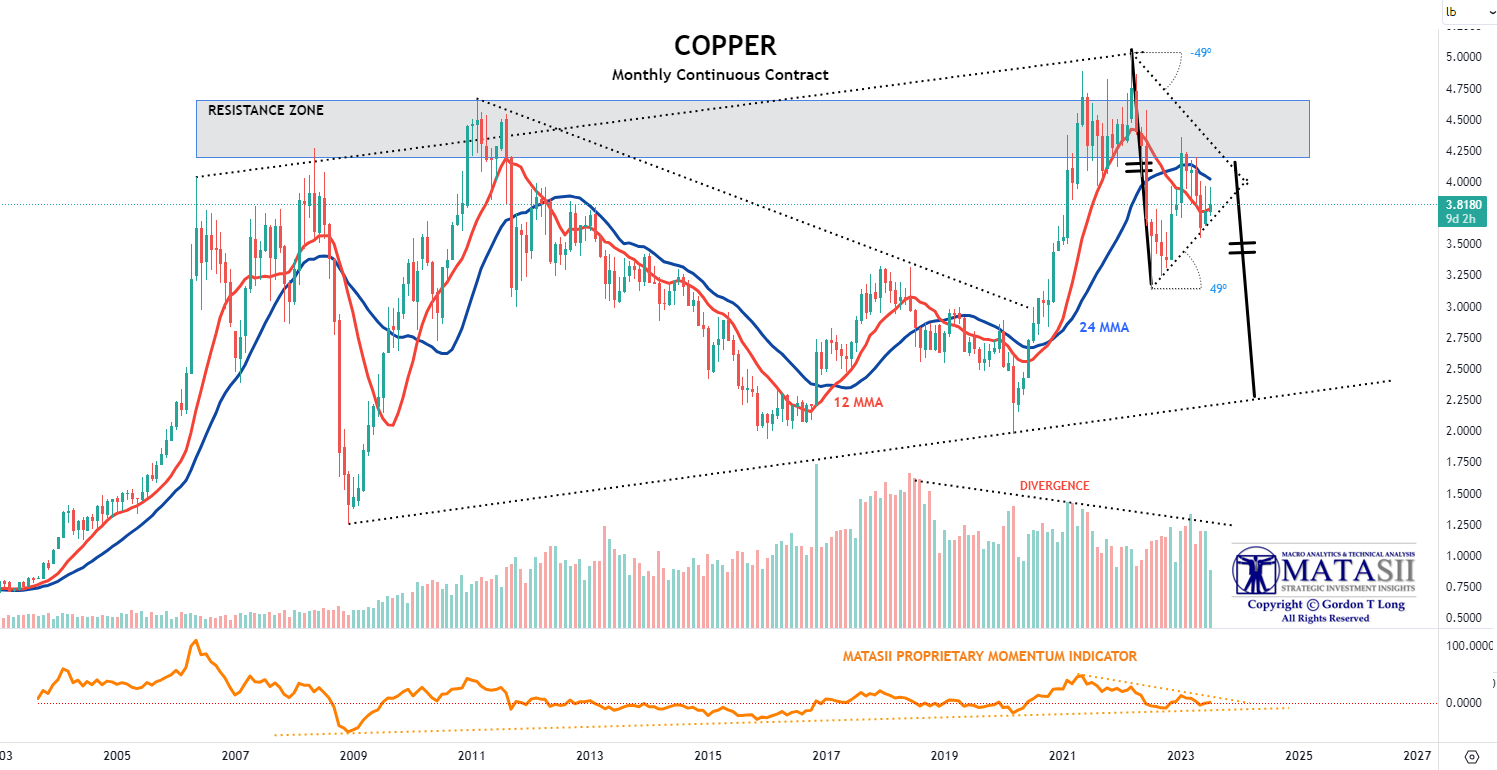
YOUR DESK TOP / TABLET / PHONE ANNOTATED CHART
Macro Analytics Chart Above: SUBSCRIBER LINK
GOLDMAN SACHS COMMODITY INDEX
However, Energy, Food and Grains we expect to outperform. The charts below of Goldman Sachs Commodity Index and the CRB Index may in fact do much better than the current charts reflect. Time and events will determine this.
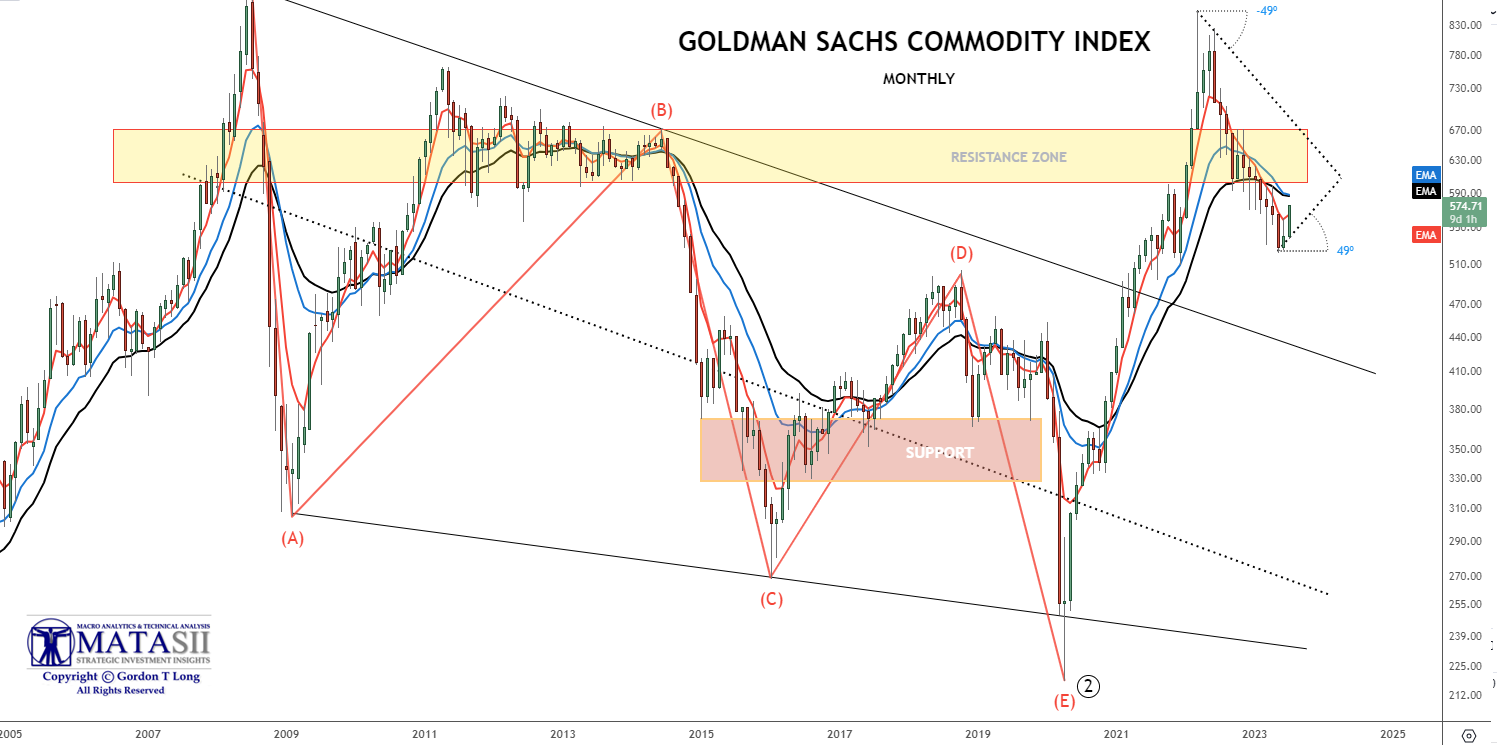
YOUR DESK TOP / TABLET / PHONE ANNOTATED CHART
Macro Analytics Chart Above: SUBSCRIBER LINK
CRB COMMODITY INDEX
We are still in the early stages of what we believe will be a Commodity Super Cycle. We laid this out in numerous prior MATASII videos since 2019 that can be found on our MATASII.com site and YouTube Channel. (Examples: here, here and here)
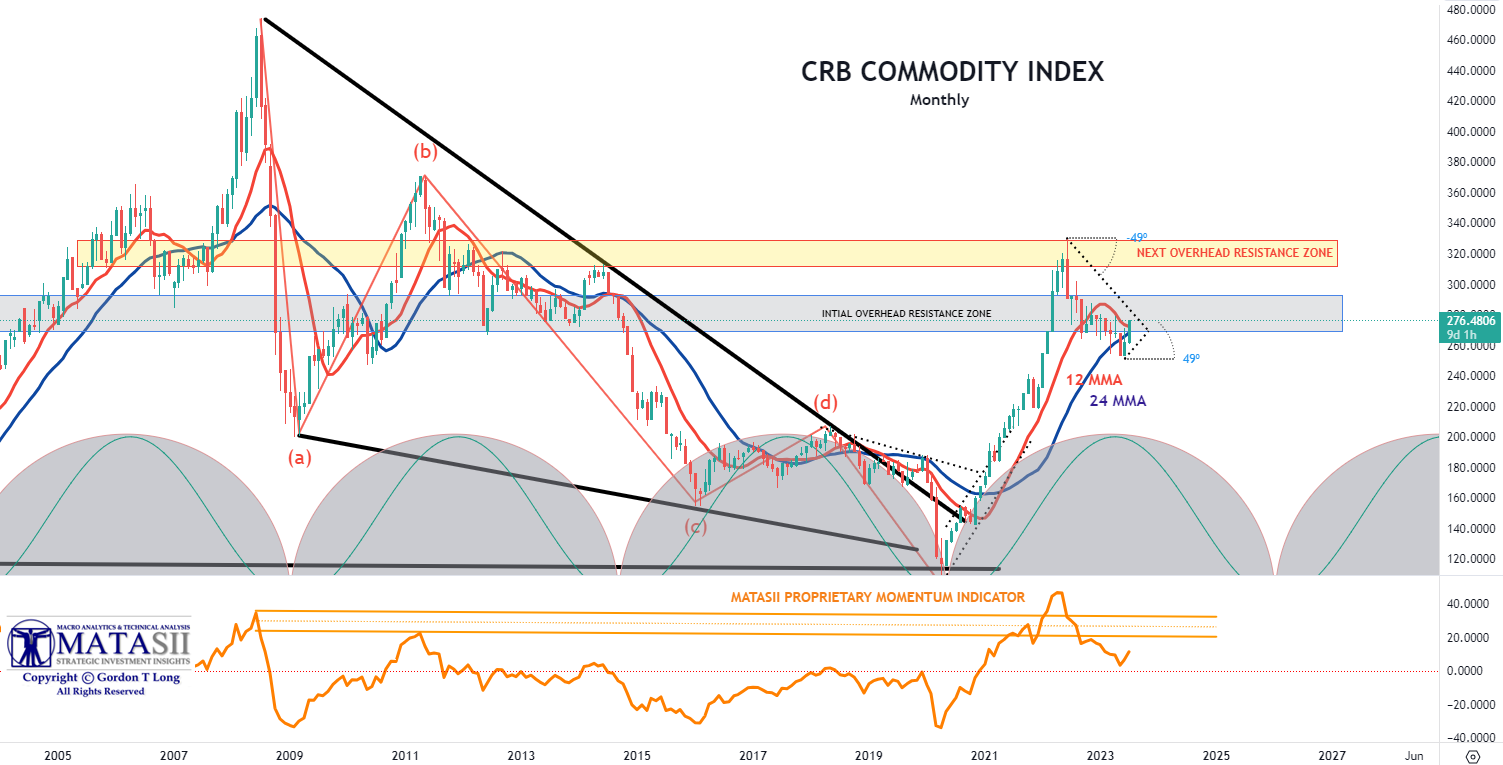
YOUR DESK TOP / TABLET / PHONE ANNOTATED CHART
Macro Analytics Chart Above: SUBSCRIBER LINK
FAIR USE NOTICE This site contains copyrighted material the use of which has not always been specifically authorized by the copyright owner. We are making such material available in our efforts to advance understanding of environmental, political, human rights, economic, democracy, scientific, and social justice issues, etc. We believe this constitutes a ‘fair use’ of any such copyrighted material as provided for in section 107 of the US Copyright Law. In accordance with Title 17 U.S.C. Section 107, the material on this site is distributed without profit to those who have expressed a prior interest in receiving the included information for research and educational purposes. If you wish to use copyrighted material from this site for purposes of your own that go beyond ‘fair use’, you must obtain permission from the copyright owner.
NOTICE Information on these pages contains forward-looking statements that involve risks and uncertainties. Markets and instruments profiled on this page are for informational purposes only and should not in any way come across as a recommendation to buy or sell in these assets. You should do your own thorough research before making any investment decisions. MATASII.com does not in any way guarantee that this information is free from mistakes, errors, or material misstatements. It also does not guarantee that this information is of a timely nature. Investing in Open Markets involves a great deal of risk, including the loss of all or a portion of your investment, as well as emotional distress. All risks, losses and costs associated with investing, including total loss of principal, are your responsibility.