Gordon T Long
Global Macro Research | Macro-Technical Analysis
GLOBAL MACRO
GLOBAL ECONOMICS
HIGHER TAXES AND LOWER REAL WAGES AHEAD!
The entire burden of central bank rate hikes and failed monetary poilcy has become a huge burden to primarily families and small businesses. Meanwhile, large corporations and governments are virtually unaffected. I increasingly hear this adjustment being identified and labeled as “Corporatocracy”.
Consuming entities like fiat based western governments have grown in size and often represent 40 to 60 percent of GDP. These effectively non-productive “parasites” consume wealth and spend what they take from the private workforce in the form of taxes or deficit borrowing to spend with the debt obligation payable by future taxpayers. Meanwhile Gross Domestic Product (GDP) will not show a recession even though consumption and private investment in real terms are declining.
A PRIVATE SECTOR RECESSION ALREADY UNDERWAY
Where this shows is in the Gross Domestic Income (GDI) which has registered a negative quarter for Q4 2022 and Q1 2023. You will recall from your first semester Econ 101 that GDP = GDI, or at least it used to!
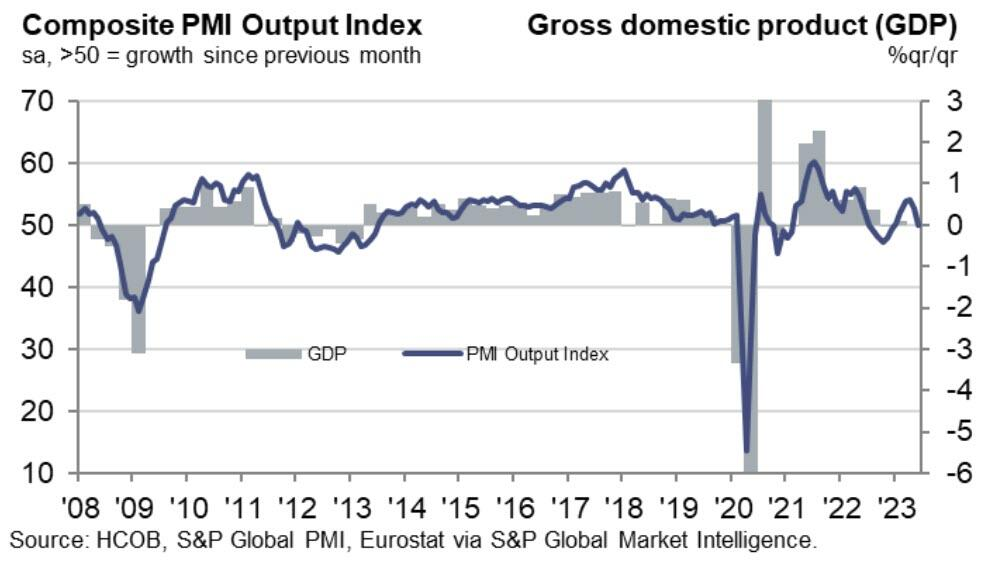
This is because bloated government spending is disguising a private sector recession and the decline in real disposable income, real wages and margins of small and medium enterprises. Furthermore, widespread weaker commodities are boosting the external contribution of gross domestic product. These are the main reasons why we are living in the middle of a recession and the destruction of private wealth and wages, but the official GDP data does not reflect it. (See the GDP and GDI charts in this month’s LONGWave video.)
As government weight in the economy rises faster, technical recessions may not appear in the official data, but citizens suffer it, nevertheless. Many think that this is good news because the spending of governments goes straight to the citizens via social spending. However, there is nothing that the state provides that it does not take away from the private sector now or in the future -deficit spending now means higher taxes and lower real wages afterward.
Therefore, the flip side of “no official recession yet” is “more public debt now and after”.
WHAT YOU NEED TO KNOW
 INVERTED YIELD CURVE: Cleary Historic!
The period we are currently in is unprecedented. Therefore we should expect the unexpected!
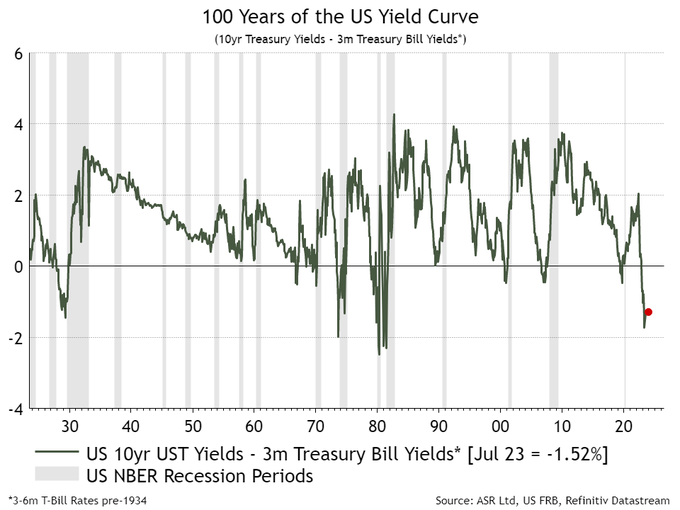
The chart to the right shows 100 years of Federal Reserve Chairman Powell’s preferred US yield curve (10yr-3m rates). The accuracy of the yield curve as a recession predictor is well established. The degree to which the curve has been inverted to this degree has only occurred on three previous occassions – 1929, 1973 and 1979-80.
NONE OF THOSE ENDED WELL & ALL WERE HISTORIC!
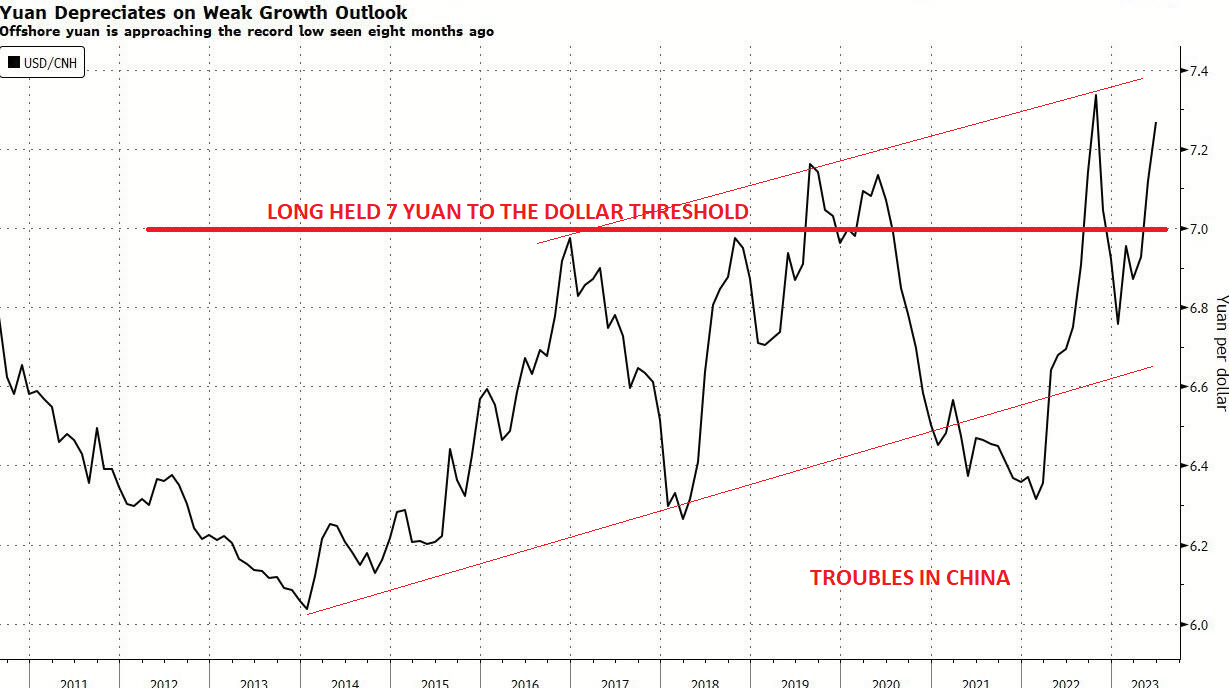
A WEAK CHINA – A Major Global Problem
-
- DEFALTION:
- China continues its slide into the world of deflation. China CPI came in at 0.0% Y-o-Y, while factory prices declined sharply by -5.4% Y-o-Y.
- The CPI has now fallen for a fifth consecutive month, indicating weak consumer demand and a clouded growth outlook.
- DEFALTION:
-
- STIMULUS:
- There is an increasing need for more economic stimulus. However, due to the current levels of debt and the ongoing real estate crisis, most China watchers do not anticipate any significant economic stimulus measures. Even a stimulus plan in the trillions of Yuan may only have a moderate impact on the economy. Beijing is holding back for fear that aggressive stimulus will over stimulate the economy and fuel a jump in leverage, like it did in the past. But authorities may be left with no choice, if no one else steps up to revive spending and growth.
- It is likely we will see more strategic sectors receiving tax breaks, and some stimulus may come in the form of additional investments in digital infrastructure such as data centers, cloud computing and the semiconductor sector.
- Demand-side stimulus is likely more effective given the disappointing revival of domestic consumption so far.
- STIMULUS:
-
- SLOWDOWN:
- “It’s too early to say how deep the recession that is to come will be, but clearly a slowdown is coming”.
- If Beijing insists on no bail-out and forces local authorities to resolve their own debt problems. It may have to grapple with not only mass defaults, but also banking crises in the years to come.
- SLOWDOWN:
-
- YUAN:
- The currency has also fallen to levels not seen since early 2021 against its peers.
- RATES:
- The yield on the one-year sovereign note, a barometer of liquidity in the financial system, capped the largest quarterly fall since the pandemic began, signaling credit demand is faltering.
- REAL ESTATE:
- Every time there’s a glimpse of hope for a narrow escape, Chinese real estate developers are pulled back into the abyss.
- YUAN:
MOUNTING PROBLEMS IN EU – As Goes Germany, So Goes Europe?
-
- FINANCIAL STRESS:
- “The EU Is On The Brink Of Bankruptcy” says Hungary’s Orbán At EU Summit.
- The EU’s climate deal is 13% funded. How’s that going to work?
- FINANCIAL STRESS:
-
- INFLATION WITH DEFLATION:
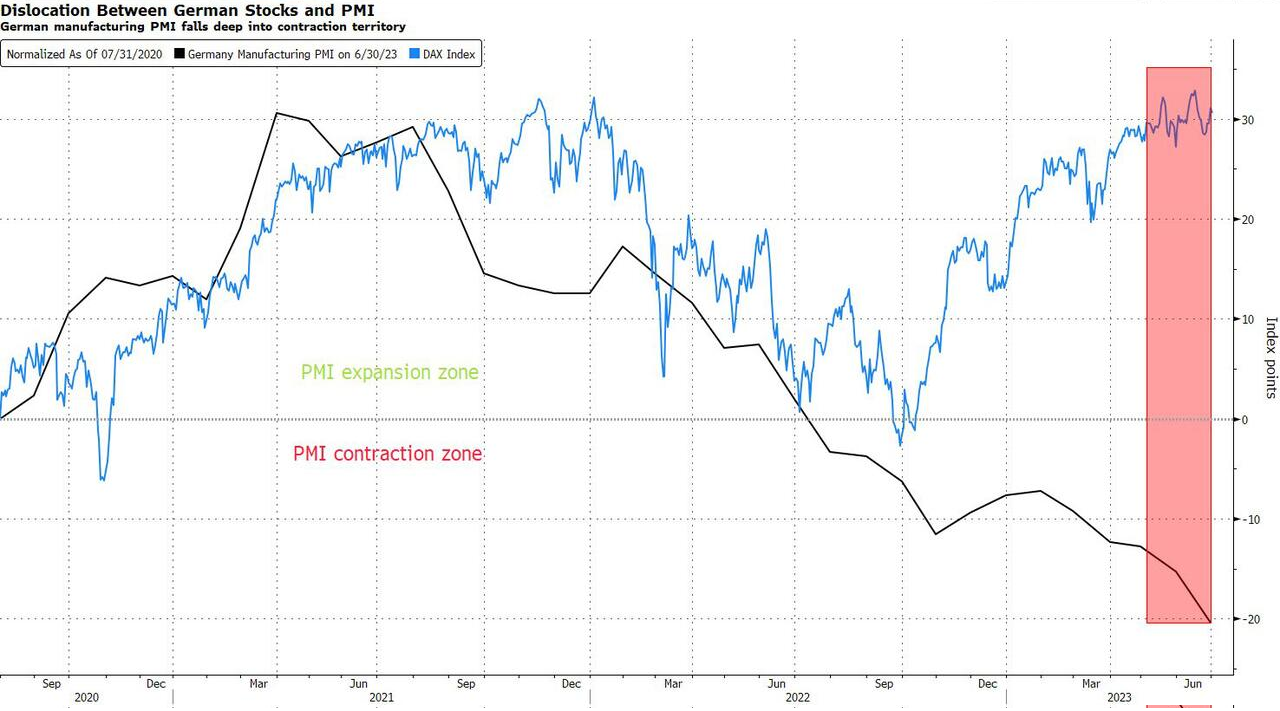
- Euro zone PPI has dumped Into Deflation with PMI’s plunging. All major euro countries have lost considerable momentum. We just saw a significant deflationary print for EU PPI along with contractionary print for EU PMI.
- INFLATION WITH DEFLATION:
-
- STIMULUS:
- The ECB could be forced to do more than they would otherwise have to do, with potentially more devastating effects on the economy as a result. Doesn’t that make mortgage relief a cure that is worse than the disease?
- STIMULUS:
SOMETHING IS WRONG IN JAPAN – Moving Quickly Towards Financial Stress!
-
- DEBT:
- $1.1tn…JGBs purchased by BoJ past 12 months, that’s 24% of Japan’s GDP.
- DEBT:
-
- YEN:
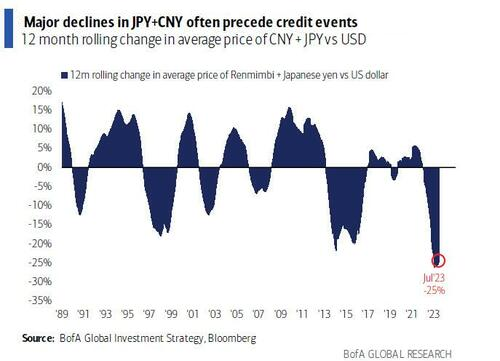
- Big FX reversals with rolling 12-month change of average value of Japan yen & China renminbi down 25% in past year. This often coincides with major deleveraging.
- YEN:
GLOBAL ECONOMIC REPORTING: What This Week’s Key Global Economic Reports Tell Us?
-
- Jobs data highlights further Recessionary behavior.
- Inflation continues to fall at a fast rate. This will soon however make Y-o-Y comparisons more difficult.
- Disinflation is moving towards deflation in some countries.
CONCLUSION
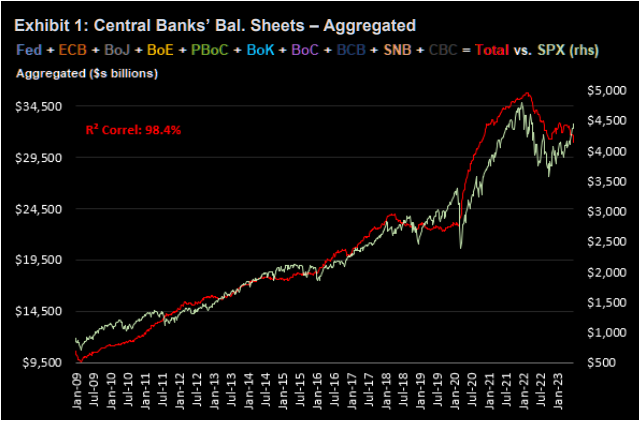 Markets have diverged from the aggregated total of major central bank balances. The state of developed economies around the world suggests that this divergence should be resolved in favor of central bank balance sheet growth. The correlation between central bank balance sheets and the US equity market has firmly existed since the Great Financial Crisis of 2007-2008 and nothing suggests that this correlation should start breaking down.
BANKRUPTCY FILINGS
-
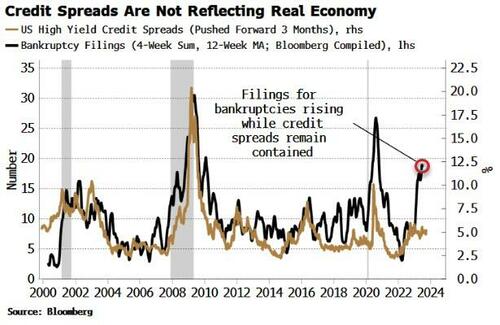
- In the first six months of 2023, there were 340 corporate bankruptcies, topping every other comparable span in 13 years, according to S&P Global Market Intelligence. This is up 93 percent from the same time a year ago and higher than in 2020, when there was a spike during the early days of the coronavirus pandemic.
- There were 54 recorded corporate bankruptcy filings in June, unchanged from the 54 bankruptcies in May. Last month, some of the most notable companies to submit filings were Lordstown Motors, Rockport Co., Instant Brands Acquisition Holdings and iMedia Brands.
- Year-to-date through June, 15 companies with more than $1 billion in liabilities filed for bankruptcy, such as Cyxtera Technologies, Diebold Holding, Bed Bath & Beyond, Diamond Sports Group and Party City.
- Epiq Bankruptcy, a U.S. bankruptcy filing data provider, confirmed that 2,973 total commercial Chapter 11 bankruptcies were filed in the first half of 2023, up 68 percent from the same period in 2022.
A WEAK CHINA – A Major Global Problem
China is dealing with its own challenges that are wildly different from the challenges that the West is facing.
While both China and the West have to deal with a slump in the manufacturing sector, China does not have an inflation battle to fight – at least not yet. China’s economy is struggling because local governments, the real estate sector and households have too much debt. China seeks to transform its economy from an export based model to a model of dual circulation that also relies on domestic consumption.
However, given the circumstances outlined above, the latter will prove to be everything but easy. Currently, consumers are mainly busy with deleveraging. This is reflected in higher savings ratios and early mortgage repayments that hit a 5 year high according to Fitch Bohua. While it is a necessary step for households to deleverage, it does put a lot of pressure on the expected interest rate returns of China’s banking sector. Moreover, today’s PMI’s coming from China shows a continuous cooling of the manufacturing sector and a lower than expected value for the services sector (53.2 versus 53.5 expected) in June, which also came out lower than the survey for the previous month.
CHINA SLIDING TOWARDS DEFLATION
 With Youth unemployment well over 20%, the property market woes still unresolved and the Post-Covid Reopening being very weak, China was dealt another blow.
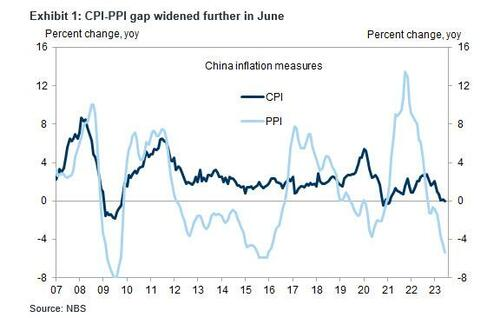
According to China’s National Bureau of Statistics, PPI or factory-gate prices tumbled a whopping 5.4% Y-o-Y, the biggest drop since December 2015 (CHART RIGHT). Meanwhile China CPI came in at 0.0% Y-o-Y and has now fallen for a fifth consecutive month.
The continued decline in the two gauges add to evidence that the recovery is weakening, with concerns about deflation weighing on confidence indicating sustained weak consumer demand and a clouded growth outlook. That’s likely to spur more speculation about what potential stimulus may be in the cards to shore up the economy.
A key drag on consumer prices last month was pork prices. The cost of meat — a staple in the Chinese diet — fell 7.2% in June from a year earlier. That was more than May’s 3.2% decrease. The government has been trying to put a floor under pork price declines, saying last week that it would buy more pork for state reserves to boost demand.
NO MAJOR STIMULUS IN THE CARDS
 There is increasing evidence of a need for more economic stimulus. However, due to the current levels of debt and the ongoing real estate crisis, most China watchers do not anticipate any significant economic stimulus measures. They see Beijing is holding back for fear that aggressive stimulus will over stimulate the economy and fuel a jump in leverage, like it did in the past. But authorities may be left with no choice if no one else steps up to revive spending and growth.
If Beijing insists on no bail-out and forces local authorities to resolve their own debt problems, it may have to grapple with not only mass defaults but also banking crises in the years to come.
WHAT WE ARE LIKELY TO SEE:
We could see more strategic sectors receiving tax breaks, and some stimulus may come in the form of additional investments in digital infrastructure such as data centers, cloud computin, and the semiconductor sector. However, demand-side stimulus would likely be more effective given the disappointing revival of domestic consumption so far.
The basic reality is that China still needs the West much more than the West needs China.
CHINA NEEDS THE WEST MORE THAN THE WEST NEEDS CHINA!
MOUNTING PROBLEMS IN EU – As Goes Germany So Goes The EU!
 Germany and Japan have both been bulwarks of the US-dominated system that has existed since the end of the Second World War. The Yen and the Deutschmark (now the Euro) have provided important ballast for the Dollar reserve system, and the trade surpluses of these countries have allowed for large US deficits to be recycled before providing the capital back to Wall Street in the form of US Treasury purchases.
Emmanuel Macron has been clear that he is seeking “strategic autonomy” for Europe, but European living standards were seeded by US Dollar transfers under the Marshall Plan, and European security continues to be underwritten by the Truman Doctrine under the Aegis of the United States military. Is it reasonable to expect that Europe can achieve anything like strategic autonomy from its current position, with a hostile neighbor knocking on its door in the East?
Lagarde has correctly diagnosed that the global landscape is changing, but how it will look in the future remains uncertain, and there are still signs of denial. Europe has been a beneficiary of US foreign policy priorities over the last 80 years, but will it remain a beneficiary in the future? Britain made the mistake of overestimating its ongoing relevance to the global system in the middle of the last century. It took a cold US reaction to the Suez Crisis to eventually disabuse it of this notion.
In seeking strategic autonomy for Europe, Emmanuel Macron should be careful what he wishes for, especially with a US Presidential election due next year!
FINANCIAL STRESS:
 “The EU Is On The Brink Of Bankruptcy” says Hungary’s Orbán At EU Summit! Meanwhile the central strategy of the EU’s climate agreement is only 13% funded. How’s that going to work?
INFLATION WITH DEFLATION: Euro zone PPI has dumped Into Deflation with PMI’s plunging. All major euro countries have lost considerable momentum. We just witnessed a big deflationary print for EU PPI along with a contractionary print for EU PMI.
STIMULUS: The ECB could be forced to do more than they would otherwise have to do, with potentially more devastating effects on the economy as a result. Doesn’t that make mortgage relief a cure that is worse than the disease?
SOMETHING WRONG IN JAPAN – Moving Quickly Towards Financial Stress!
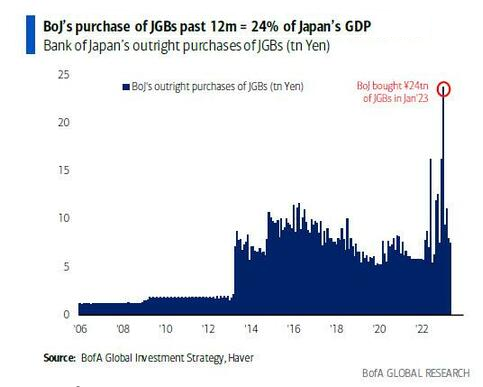 The BOJ purchased $1.1 TRILLION of JGB over the past 12 months. That’s 24% of Japan’s GDP! On what planet is this considered normal???
Something is seriously wrong and broken somewhere!
We are seeing big FX reversals. The rolling 12-month change of average value of the Japanese Yen & China Renminbi is down 25% in past year. This often coincides with deleveraging.
CHART BELOW: Major declines in JPY and CNY often precede significant credit events.
GLOBAL ECONOMIC REPORTING: What This Week’s Key Global Economic Reports Tell Us
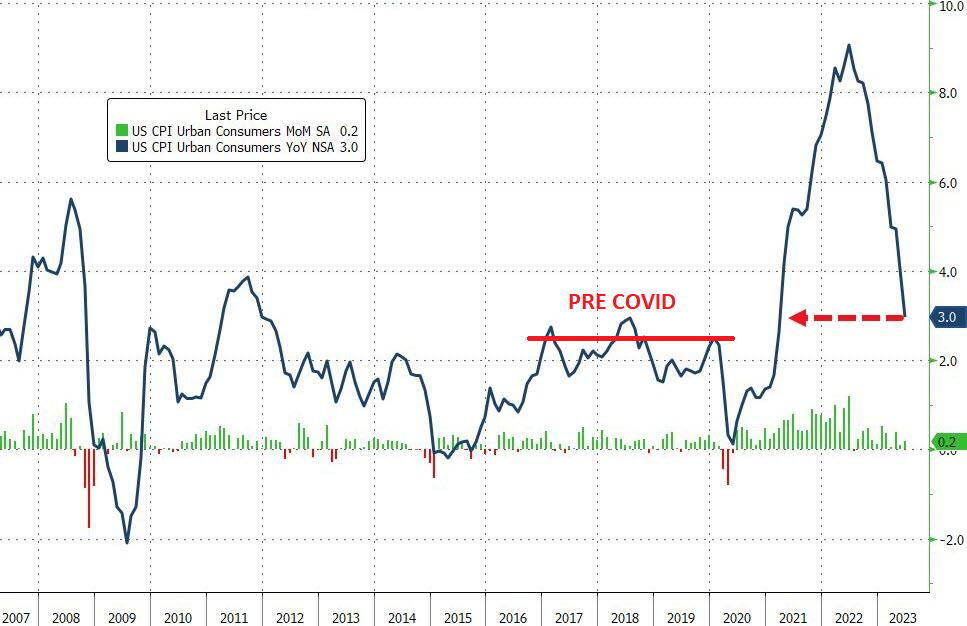
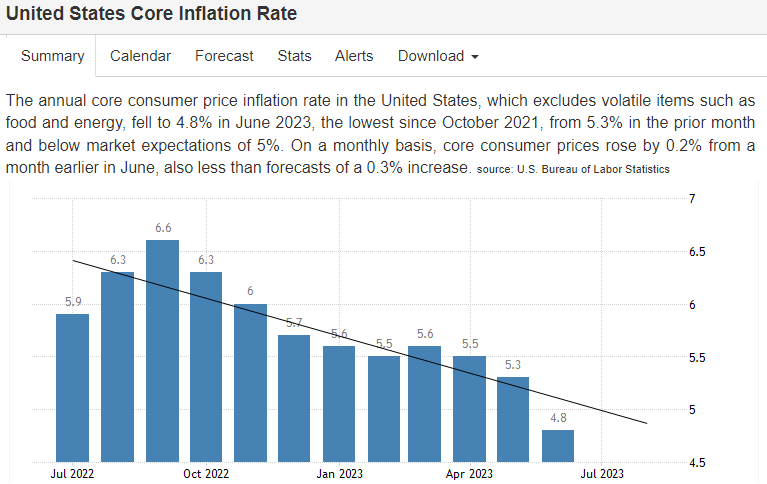
The headline CPI rose just 0.2% M-o-M (below the 0.3% MoM expected), which dragged the headline down to +3.0% YoY (cooler than expected) – the lowest since March 2021.
 The CPI chart on the home page reflects our estimate of inflation for today as if it were calculated the same way it was in 1990. The CPI on the Alternate Data Series tab here reflects the CPI as if it were calculated using the methodologies in place in 1980. In general terms, methodological shifts in government reporting have depressed reported inflation, moving the concept of the CPI away from being a measure of the cost of living needed to maintain a constant standard of living.
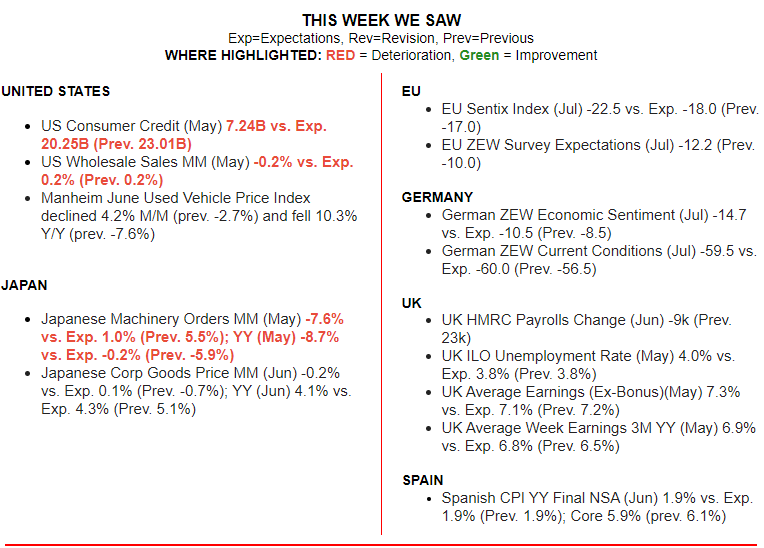
WHAT DOES YOUR SCAN OF THE DATA BELOW TELL YOU? – THE MEDIA AVOIDS BAD NEWS!
We present the data in a way you can quickly see what is happening. Anything in Red is further deterioration.
In Green is an improvement over the last release.
CONCLUSION
Markets rose in direct correlation, since 2009, to the increase in central bank balance sheet growth. That aggregated total is now falling while stocks continue (at least temporarily to rise). Is this 14 year correlation now no longer valid or should we soon expect the divergence to be closed?
If the global economy was strong there may possibly be an argument for this. However, as we “toured” the major economies in this newsletter, that is far from the reality!
In America, working- and middle-class Americans, are poorer today than they were prior to Bidenomics. How could the market therefore be dramatically higher?
-
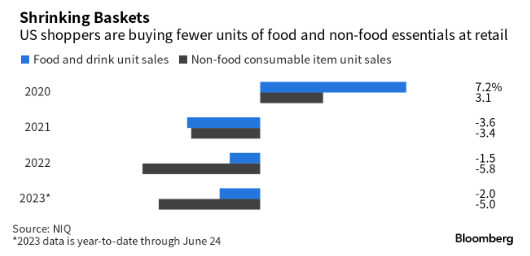 US Consumers Are Suffering In A Less Than “Robust” Economy – Daniel Lacalle
- Consumers are trading down from Walmart as Dollar Tree Becomes ‘Supermarket For The Working Poor’ GRAPHIC VIDEO
- “A dumpster-diving millennial cut her grocery bill to about $45 a month on average for the last 4 months,” Business Insider which shows how some millennials are dumpster diving for survival in today’s high inflation period.
- “I spend just $90 a year on groceries — here’s how I do it,” NY Post
- Cash-Strapped Consumers Cut Back On Toilet Paper And Toothpaste ZeroHedge
- Cash-Strapped Consumers Resort To ‘Dumpster Dining’ To Save On Grocery Bill ZeroHedge
BANKRUPTCY FILINGS
In the first six months of 2023, there were 340 corporate bankruptcies, topping every other comparable span in 13 years, according to S&P Global Market Intelligence. This is up 93 percent from the same time a year ago and higher than in 2020, when there was a spike during the early days of the coronavirus pandemic.
There were 54 recorded corporate bankruptcy filings in June, unchanged from the 54 bankruptcies in May. Last month, some of the most notable companies to submit filings were Lordstown Motors, Rockport Co., Instant Brands Acquisition Holdings and iMedia Brands.
Year-to-date through June, 15 companies with more than $1 billion in liabilities filed for bankruptcy, such as Cyxtera Technologies, Diebold Holding, Bed Bath & Beyond, Diamond Sports Group and Party City.
Epiq Bankruptcy, a U.S. bankruptcy filing data provider, confirmed that 2,973 total commercial Chapter 11 bankruptcies were filed in the first half of 2023, up 68 percent from the same period in 2022.
CONCLUSION
 DISTRESSED FIRMS
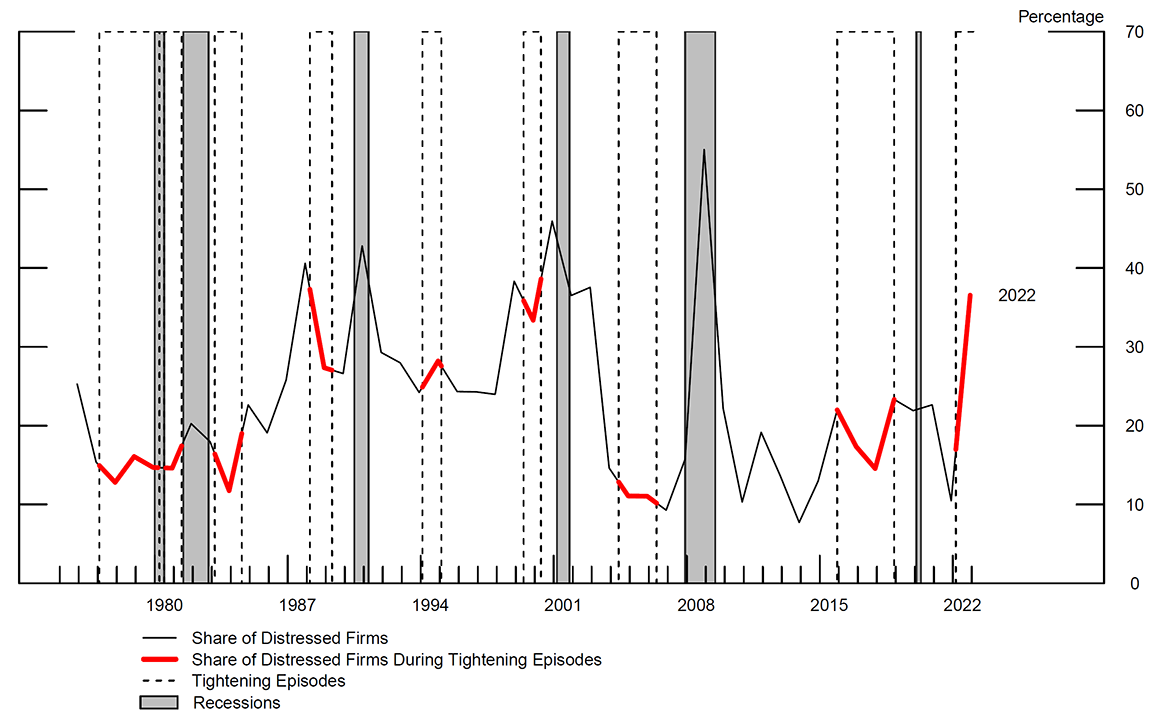
There are now more significantly distressed firms today than there were when the Fed tightened monetary policy prior to the financial crisis and the Great Recession.
The high number of over-leveraged firms in distress is likely to have effects on investment, employment and aggregate activity that are stronger than in most tightening episodes since the late 1970s.
In other words, the impacts of this tightening cycle could be worse than the Great Recession.
In other words, the impacts of this tightening cycle could be worse than the Great Recession.
More than a decade of artificially low-interest rates, coupled with massive stimulus injected into the economy during the pandemic, incentivized companies to load up on low-interest debt. That was fine and dandy as long as rates were near zero. But with interest rates now pushed up to over 5%, many companies can’t service their massive debt loads. Many will undoubtedly go under.
According to a Fed paper, this will likely have “substantial effects on investment and employment.”
 BANKRUPTCY FILINGS
Bankruptcy Filings Show Credit Slipping Despite What Spreads Say.
It looks like the credit environment is set to worsen, but spreads appear to be disconnected.
Q2 EARNINGS ON TAP!
IGNORE THE “BEAT EXPECTATIONS” – WHAT DID THEY EARN?
Click All Charts to Enlarge
1- SITUATIONAL ANALYSIS
 COMPLACENCY KILLS
Nothing is more threatening to investor returns than “complacency”! Complacency Kills!
“The spirit of the times is ‘Don’t worry about the markets crashing. They will come back up and set new highs.'” –@RobertJShiller
The graphic to the righjt was taken from the WSJ in an article they wrote entitled: “America’s Retirees Are Investing More Like 30-Year-Olds“. They report that “at Vanguard, one-fifth of investors 85 or older have nearly all their money in stocks, up from 16% in 2012”.
Q2 EARNINGS ON TAP
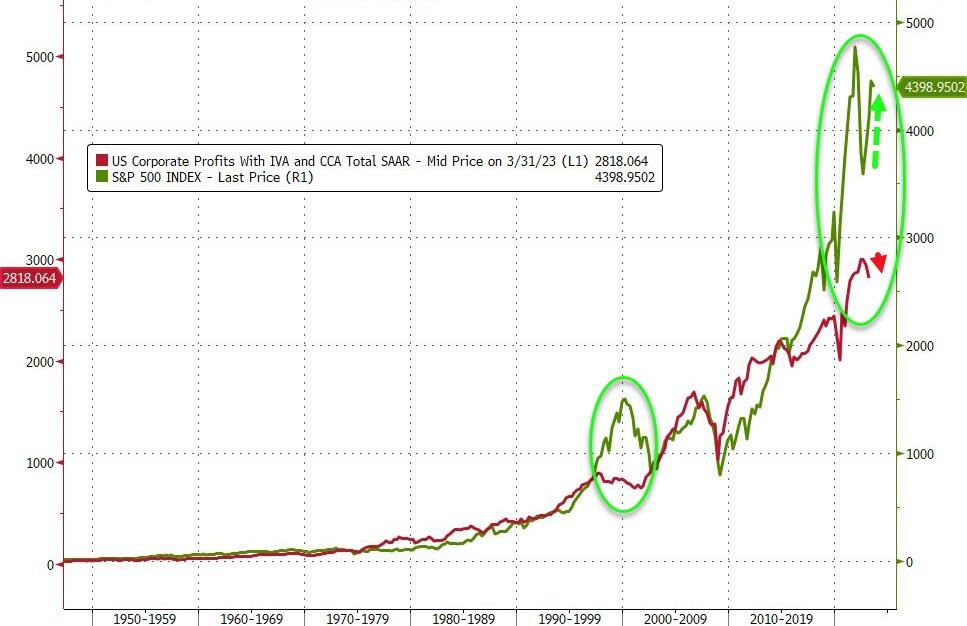 In the first quarter of 2023, U.S. corporate profits fell by just over 5%.
Low taxes and interest rates contributed to about one-third of profit growth across nonfinancial companies in the S&P 500 over the last 20 years, a paper from the Federal Reserve shows.
Now, as interest rates climb higher, steeper costs could cut into bottom lines.
So far, corporations have shown resilience to a shifting interest rate regime.
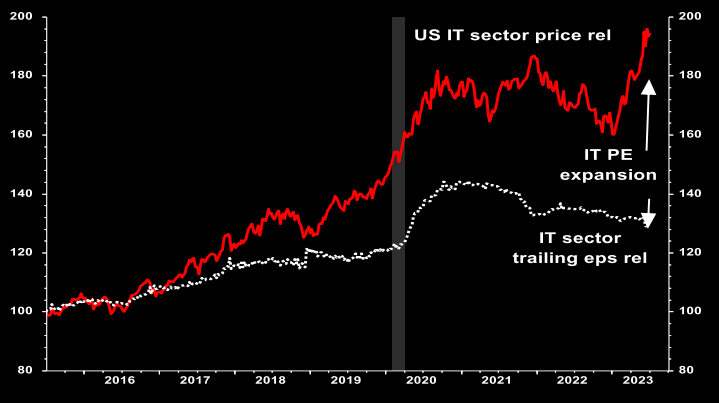
HOW MUCH IS TOO MUCH??
Soc Gen chart (right) showing the latest tech PE expansion vs trailing EPS.
AI may be great, but what price are you willing to pay here?
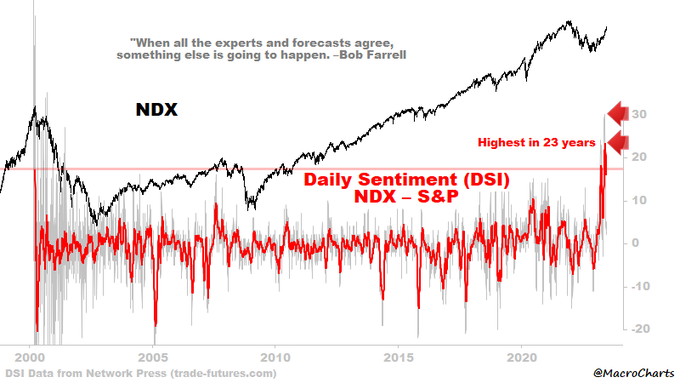
“When all the experts and forecasts agree, something else is going to happen.”
Bob Farrel
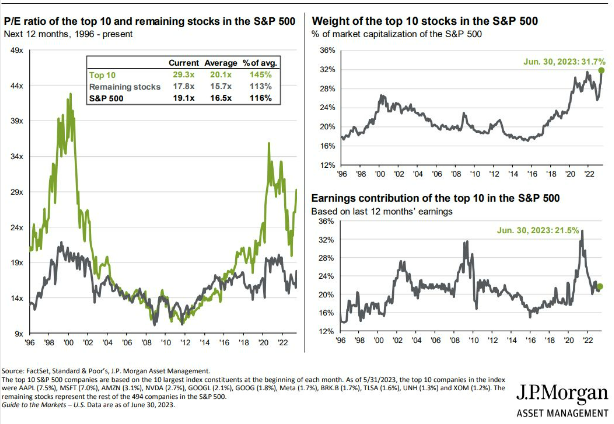
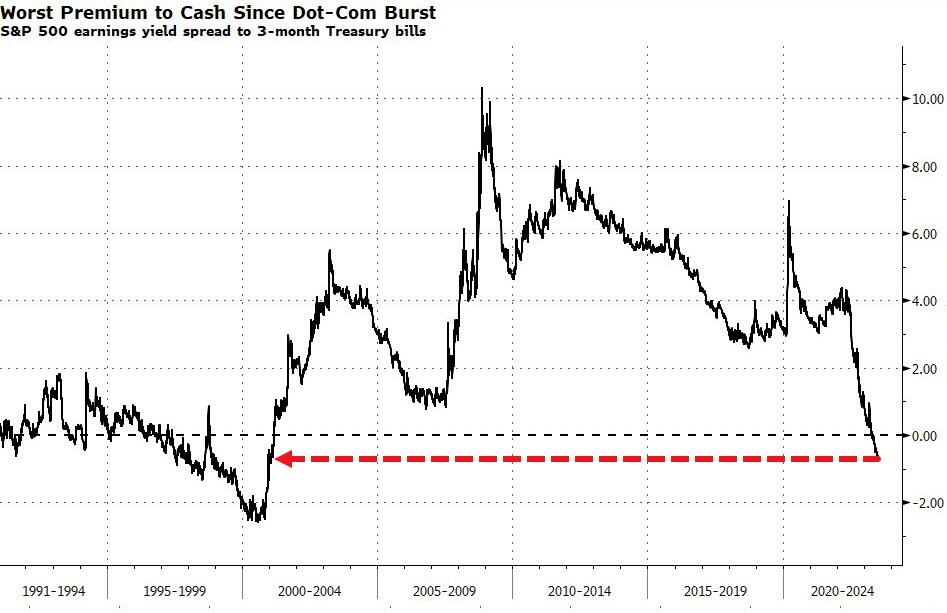
CHART RIGHT
The spread between the earnings yield on the S&P 500 and three-month bills, already the worst since the dot-com bust, has fallen to a fresh low.
On that basis, the most expensive sectors are info tech and consumer discretionary, which have earnings yields more than 200 bps lower than the yield on bills. For info tech, that’s comparable to the end of 2000.
2- TECHNICAL ANALYSIS
THE MAGNIFICANT SEVEN
The “Magnificant Seven” include the following stocks:
- AAPL
- AMZN
- META
- GOOG
- NVDA
- MSFT
- TSLA
Below we compare the Magnificant Seven performance to the S&P 500.
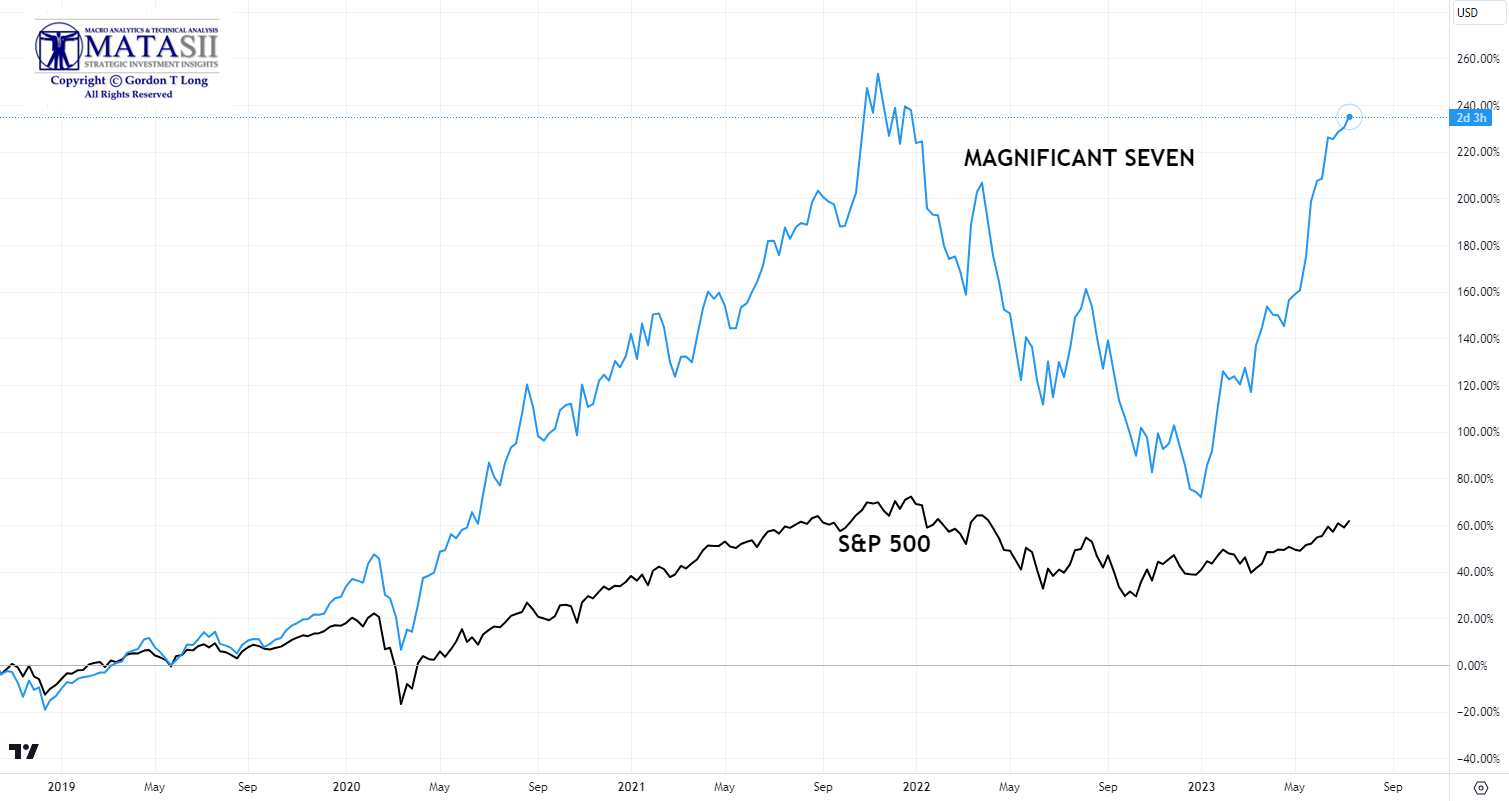
YOUR DESK TOP / TABLET / PHONE ANNOTATED CHART
Macro Analytics Chart Above: SUBSCRIBER LINK
Next we compare the Magnificant Seven (minus) NVDA to NVDA alone.
Clearly NVDA throughout 2023 has been the major driver of the Magnificant Seven, (which have been the primary driver of the overall market).
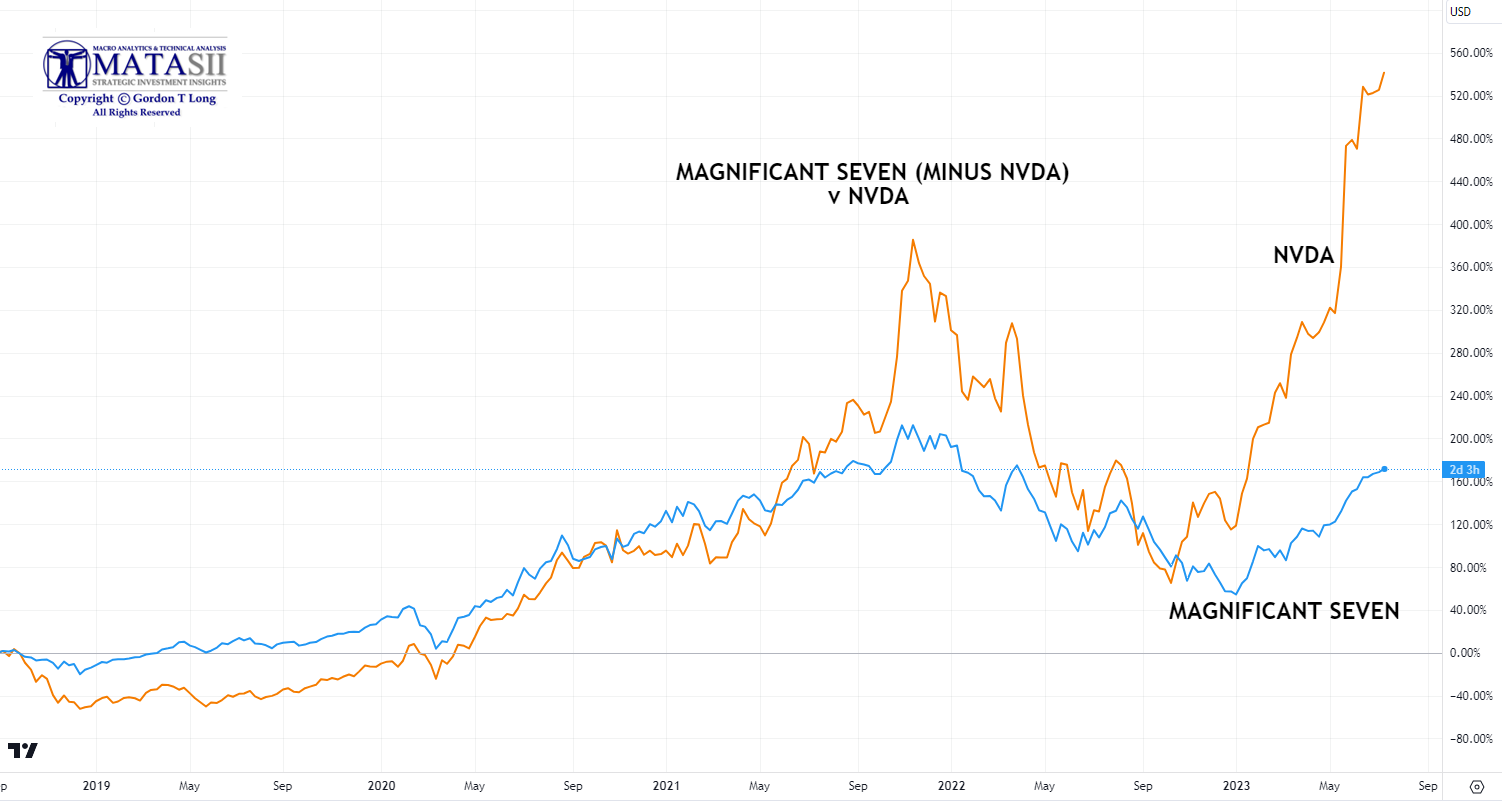
YOUR DESK TOP / TABLET / PHONE ANNOTATED CHART
Macro Analytics Chart Above: SUBSCRIBER LINK
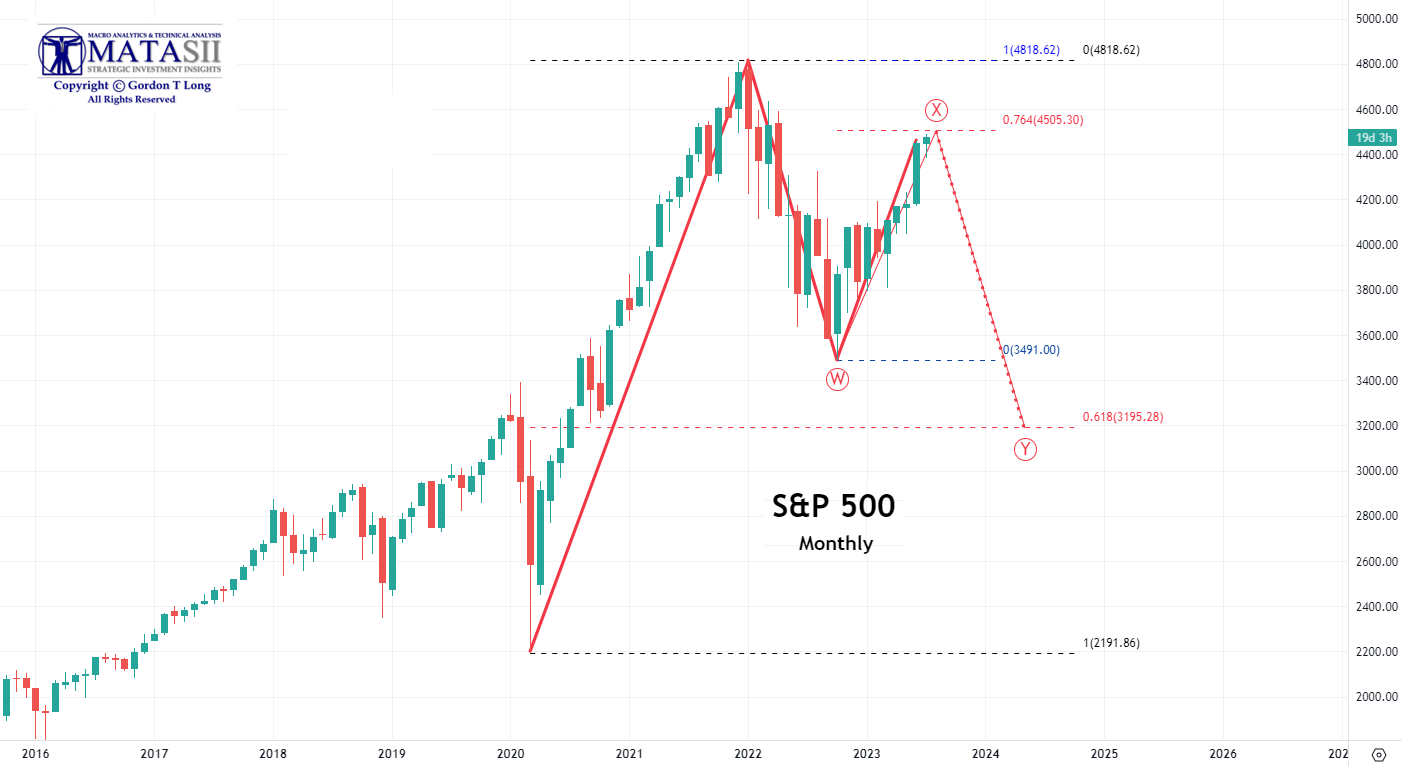
S&P 500
The S&P 500 has retraced a Fibonacci 0.76. This is extraordinary, considering it was done through mosty seven stocks.
-
- The S&P 500 index returns were negative YTD, if you excluded the top 28 names.
-
- $4.1T…YTD market cap gain of Big Tech 7 at $4.1 Trillion was greater than GDP of Germany.
-
- The AAPL+MSFT+GOOG market cap of $7.1 Trillion now exceeds the Emerging Markets of >6.5bn people.
If NVDA was to now even slow slightly its hypersonic trajector, what would the performance of the S&P 500 look like?? What if rising interest rates slow the magnificant Seven? What if some unexpected bad news came out on NVDA?
This in the old days was called a Wall Street Market “Set-up”. The fortunes on Wall Street are made shorting set-ups when everyone is on the same side of the boat!
YOUR DESK TOP / TABLET / PHONE ANNOTATED CHART
Macro Analytics Chart Above: SUBSCRIBER LINK
FAIR USE NOTICE This site contains copyrighted material the use of which has not always been specifically authorized by the copyright owner. We are making such material available in our efforts to advance understanding of environmental, political, human rights, economic, democracy, scientific, and social justice issues, etc. We believe this constitutes a ‘fair use’ of any such copyrighted material as provided for in section 107 of the US Copyright Law. In accordance with Title 17 U.S.C. Section 107, the material on this site is distributed without profit to those who have expressed a prior interest in receiving the included information for research and educational purposes. If you wish to use copyrighted material from this site for purposes of your own that go beyond ‘fair use’, you must obtain permission from the copyright owner.
NOTICE Information on these pages contains forward-looking statements that involve risks and uncertainties. Markets and instruments profiled on this page are for informational purposes only and should not in any way come across as a recommendation to buy or sell in these assets. You should do your own thorough research before making any investment decisions. MATASII.com does not in any way guarantee that this information is free from mistakes, errors, or material misstatements. It also does not guarantee that this information is of a timely nature. Investing in Open Markets involves a great deal of risk, including the loss of all or a portion of your investment, as well as emotional distress. All risks, losses and costs associated with investing, including total loss of principal, are your responsibility.