Gordon T Long
Global Macro Research | Macro-Technical Analysis
GLOBAL MACRO
US ECONOMICS
BIDENOMICS: BASICALLY CENTRAL PLANNING WITH A NEW TITLE!
In the last newsletter we discussed the Biden Administration’s newly launched Bidenomics focus by pointing out the mis-information, mis-direction, fabrications and data manipulation that it encompassed. What we didn’t have time to discuss is that it is in essence and fundamentally nothing more than policies of central planning by the state.
If there is one lesson we should have learned from the Cold War and the subsequent breakup of the USSR is that central planning doesn’t work in the longer term. Bidenomics can be best characterized as the West’s version of today’s Chinese Communist Party (CCP) approach under Xi Jinping! Let me explain what I see occurring by being quite specific.
On the first day of Biden assuming the Presidency he unilaterally issued over 40 Executive Orders, either reversing Trump policy or instituting new policies reducing US energy independence and global leadership. This was followed by unilateral mandates in the form of pandemic lockdown, vaccinations, forbearance for rents, student loans and other debt obligations – all of which have subsequently been ruled unconstitutional by the Supreme Court. This is not to suggest that Covid-19 actions should have been taken, but they were not done as law requires through the congressional process by the people’s elected representatives. China’s unelected CCP enacts policy the same way!
During the Biden Administration we have witnessed wholesale issuances of regulations, not through congress, but rather through unelected government agencies. These new regulations, licenses,
restrictions, reporting requirements, approvals and authorizations restrict entrepreneurial freedoms, innovation and risk taking. This is exactly what eventually destroyed the centrally planned USSR.
….. continued below “What You need To Know”
 WHAT YOU NEED TO KNOW
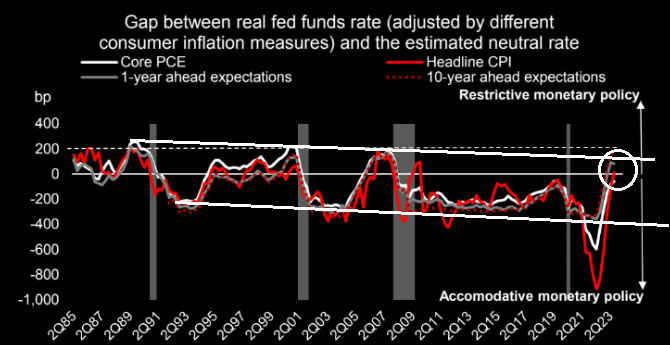
LIQUIDITY: Monetary Policy Normally Works With A 12-18 Month Lag.
The gap between the Real Fed Funds Rate adjusted by consumer inflation measures and the estimated neutral rates says we should be very close to soon feeling the real impact of the Federal Reserve’s monetary actions over the last 16 months.
Q2 EARNINGS – Preparing For the Q2 Earnings Barrage!
-
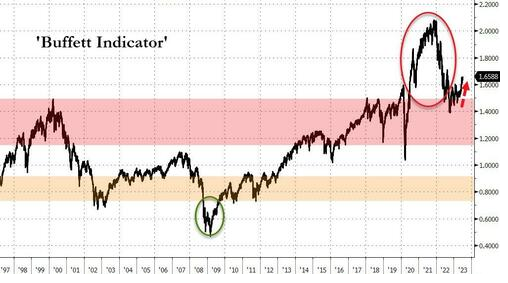
- The Buffett Indicator, which is the ratio of the total market capitalization over gross domestic product, is over 167 percent.
- There are only two ways for these sky-high valuations to come down: 1- GDP must either go up. (This is simply not going to happen since the Gross Domestic Income (GDI) has registered its second negative quarter in a row) OR 2- Market capitalization must come down.
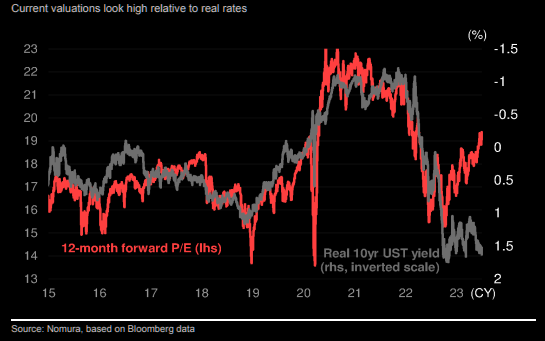
- Current valuations as defined by the 12 month forward PE for the S&P 500 are significantly disconnected from the current Real 10Y US Treasury Yield.
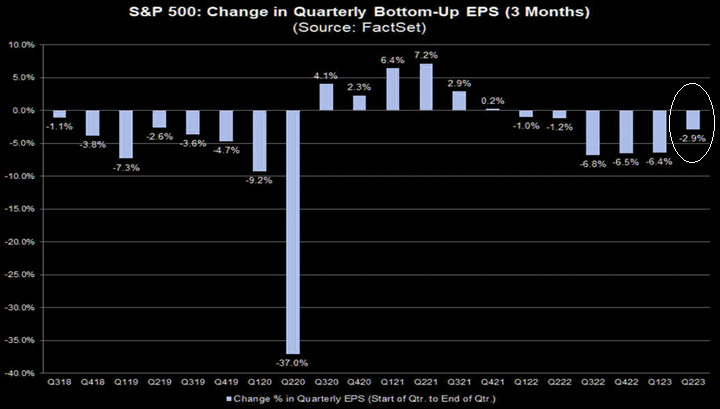
- We have been witnessing global provider FedEx Corp. to Siemens Energy AG and European chemical firms cutting or withdrawing outlooks, and there may be more woe in store as the earnings season kicks off in earnest in two weeks.
- US Wall Street analysts have actually made smaller cuts to EPS than average going into an earning season. Time will soon tell if they are right, since the assessments are clearly disconnected from what we read in all the monthly Regional Federal Reserve Reports.
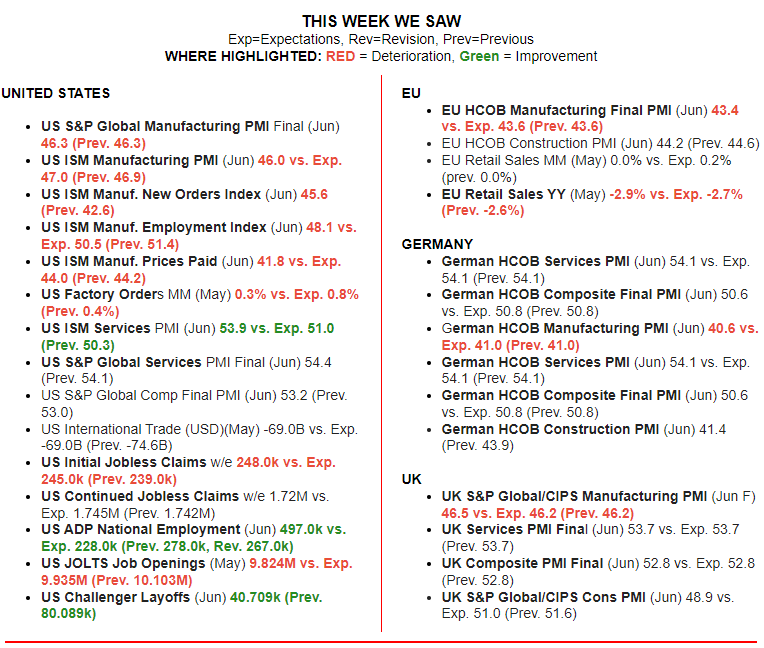
GLOBAL ECONOMIC REPORTING: What This Week’s Key Global Economic Reports Tell Us?
-
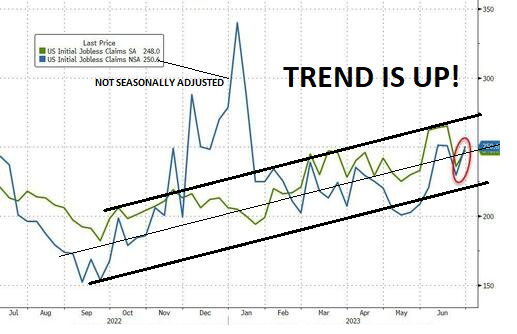
- Initial Jobless Claims continue to trend higher. Meanwhile the June Employment crumbled to 209K with all previous months revised lower.
- 60K of the total June NFP Jobs created was made up of new Government Bidenomics jobs!
- May 2023 Shadowstats Alternate Unemployment increased to 24.7% from 24.6% on top of U-6 increasing to 6.7% from 6.6%,
- More than 105 Million Working-Age Americans do not have a Job right now. These are people diligently searching for jobs, but the reality of the matter is that the employment market has gotten very tight as a result of skill requirement “mismatches”. Meanwhile, the cost of living just continues to rise and that has resulted in a “collapse of household savings”.
CONCLUSION
 DISTRESSED FIRMS
-
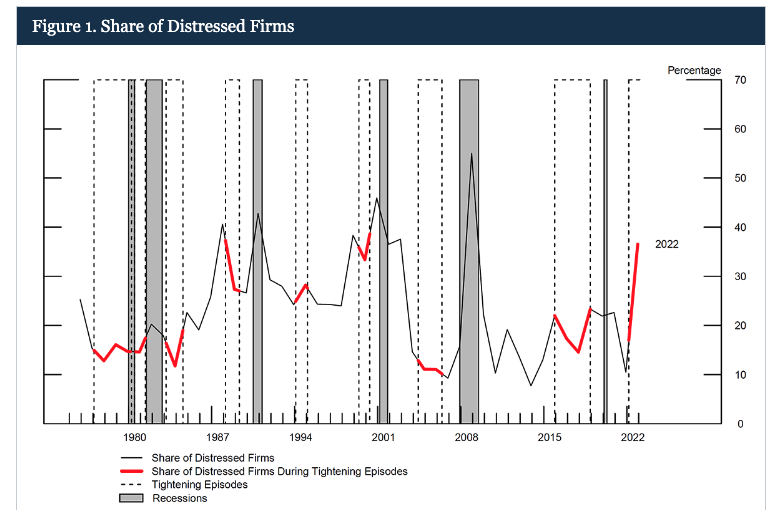
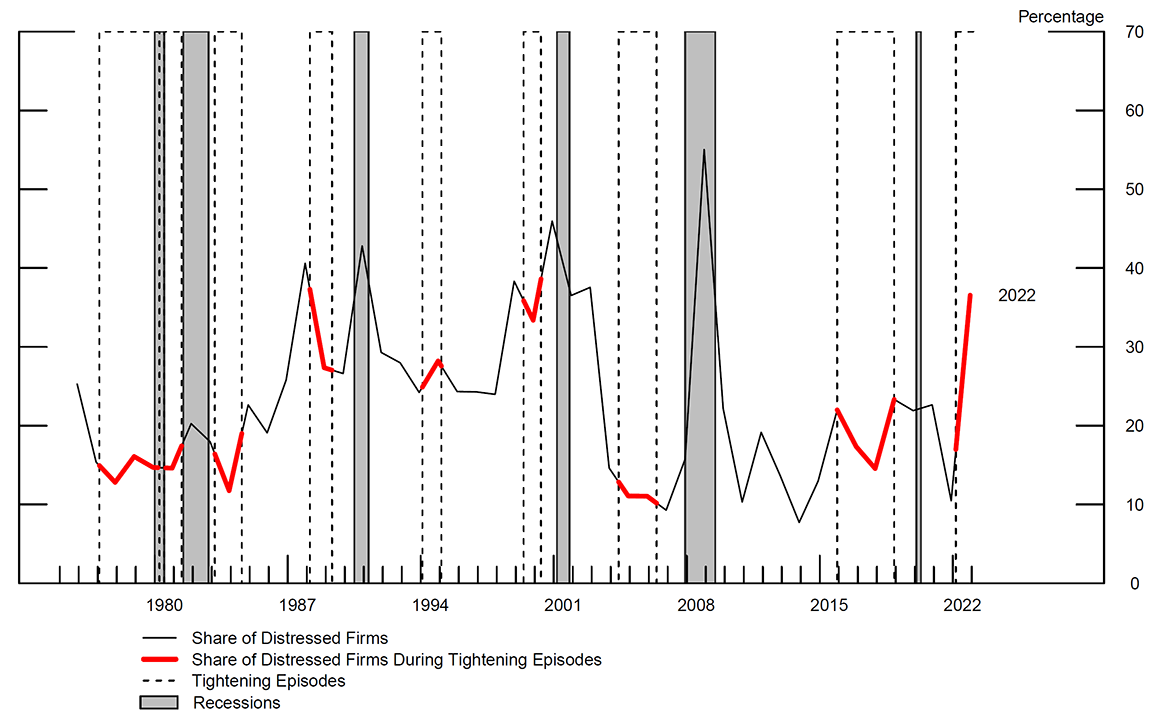
- According to a Fed paper there are now more significantly distressed firms today than there were when the Fed tightened monetary policy prior to the financial crisis and the Great Recession. The high number of over-leveraged firms in distress is likely to have effects on investment, employment and aggregate activity that are stronger than in most tightening episodes since the late 1970s. The impacts of this tightening cycle could be worse than the Great Recession.
BANKRUPTCY FILINGS
-
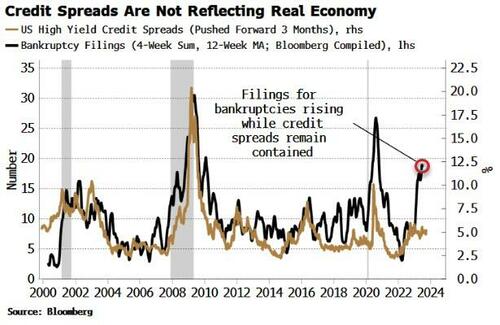
- Bankruptcy Filings Show Credit Slipping Despite What Spreads Say. It looks like the credit environment is set to worsen, but spreads appear to be disconnected.
BIDENOMICS: Basically Central Planning With a New Title!
…. CONTINUED FROM ABOVE
Bidenomics has allowed mass illegal entry into the US without any changes to our immigration laws by congress. We have had over 6 million people cross our southern border seeking “political asylum” without security safeguards, screening or ongoing tracking until their court appearance. This is in complete violation to the constitutional responsibility of the President! The transportation, hotels, food, social services, education et al iare now being paid by the US taxpayer without a single elected official voting for it. This is justifiably called “taxation without representation”.
Are we to conclude this is all just part of the central industrial planning strategy of Bidenomics for future low cost workers? The electorate has not been asked, informed nor had any explanation given on what this is all about?? There are names for this sort of governance and it isn’t called “Democracy”!
The CCP & USSR were both built on the concept of centrally directed industrial and planning policies. This is exactly what Bidenomics is and intends to do. As the roll-out of Bidenomics specifically boasts:
-
- WHITE HOUSE STATEMENT: “Bidenomics rests on three pillars: massive “smart” government spending on renewable energy and semiconductors, support for unions and domestic manufacturing, and promoting competition.”
-
- BIDEN: “We’re supporting targeted investments. We’re strengthening America’s economic security, our national security, energy security, and our climate security.”
-
- JAKE SULLIVAN – Chief Bidenomics Spokesperson: “President Biden … believes that building a twenty-first-century clean-energy economy is one of the most significant growth opportunities of the twenty-first century. But that to harness that opportunity, America needs a deliberate, hands-on investment strategy to pull forward innovation, drive down costs, and create good jobs.”
THE ONE QUESTION YOU MUST ANSWER!
We don’t give investment advice at MATASII.com. (We are not institutionally licensed by the state), so don’t look to us to tell you the answer. However, what we are legally allowed (at least temporarily) is to present you with the right questions you need to answer!! (For that we are only exposed to being shadow banned or censored for mis-information).
THE QUESTION: What is your investment strategy for a failing economy in the unfolding regulatory administrative state where policy is enacted, not through a gridlocked congress, but through dictatorial Executive Order (mandates) or administrative regulation?
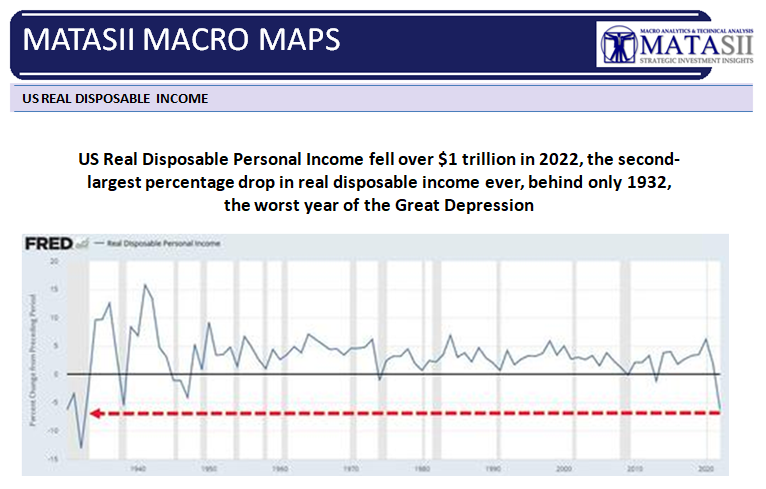
REMEMBER: Your Standard of Living is Being Reduced Through Bidenomics as Your REAL DISPOSABLE INCOME is steadily taken down to fund the increasing size of the regulatory state!
 Q2 EARNINGS – Preparing For the Q2 Earnings Barage!
SPX is not looking overly cheap here…but on the other hand, who cares about valuation? We do especially since the NASDAQ is up 29.86 percent Year-to-date.
The Buffett Indicator, which is the ratio of the total market capitalization over gross domestic product, is over 167 percent. Specifically, the Total Market Index, as measured by the Wilshire 5000, is at $44.38 trillion. This is over 167 percent of the last reported U.S. GDP of about $26.53 trillion. A fairly valued market is a ratio somewhere between 75 and 90 percent. Anything above 115 percent is considered significantly overvalued.
-
- For perspective, in March 2000, the Buffett Indicator hit 148 percent just before the S&P 500 collapsed 49 percent.
- Before that, the Buffett Indicator registered a mere 110 percent in September 2007, in advance of the S&P 500 crashing 56 percent.
- More recently, the Buffett Indicator hit a nosebleed 211 percent in December 2021. If you recall, the S&P 500 peaked out at that time and then declined by roughly 24 percent over the following 9 months.
There are only two ways for these sky-high valuations to come down:
-
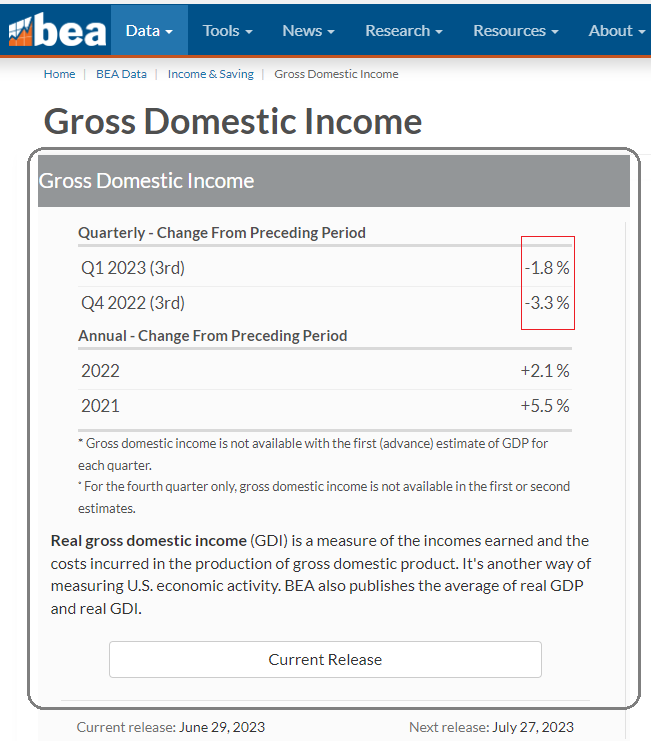
- GDP must either go up. (This is simply not going to happen since the Gross Domestic Income (GDI) has registered its second negative quarter in a row – see below),, OR
- Market capitalization must come down.
GDP = GDI
Theoretically GDP equals GDI. It never quite equals due the realities of data capture.
- GDI = Wages + Profits + Interest Income + Rental Income + Taxes – Production/Import Subsidies + Statistical Adjustments
- GDP = Consumption + Investment + Government
However as the long term Federal Reserve chart below illustrates there is a very close fit up until the adoption of Bidenomics!
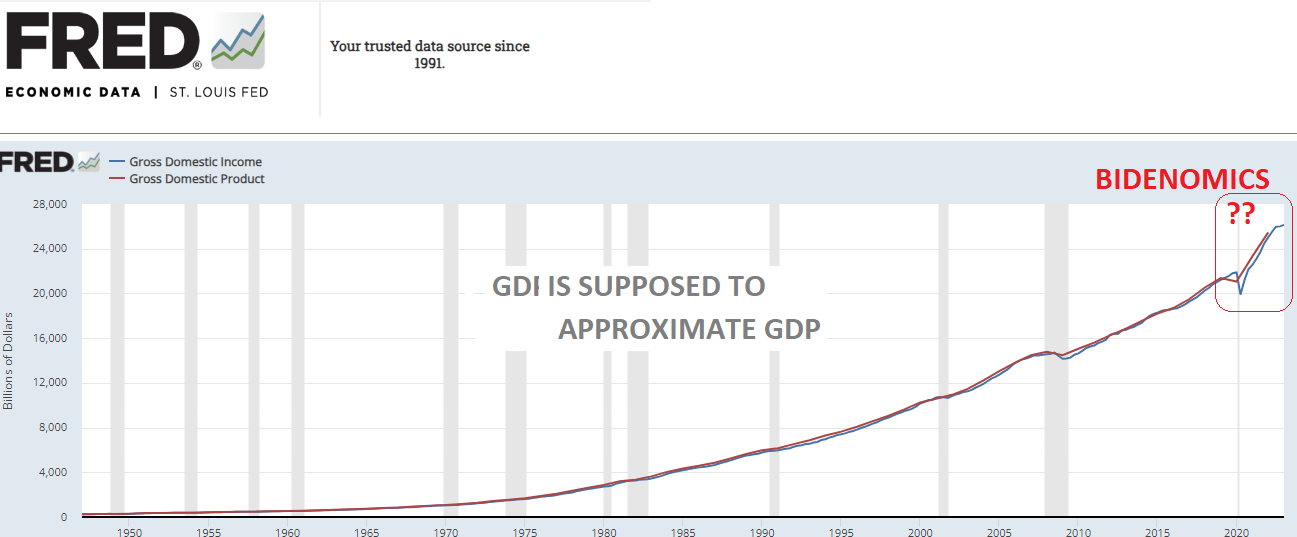
Here is the offical GDI as issued by the government’s own Bureau of Economic Analysis (BEA). According to the GDI the US Economy is already in a Recession.
Q2 EARNINGS SEASON
 SPX is not looking overly cheap here…but on the other hand, who cares about valuation? We do!
The chart to the right illustrates that current valuations as defined by the 12 month forward PE for the S&P 500 is significantly disconnected from the current Real 10Y US Treasury Yield. (We discuss the movement in Real Rates and Yields in this week’s “Current Market Perspective” below).
GLOBAL PROFIT WEAKNESS
Analysts are slashing profit forecasts on a global basis, following a period of surprising resilience earlier this year.
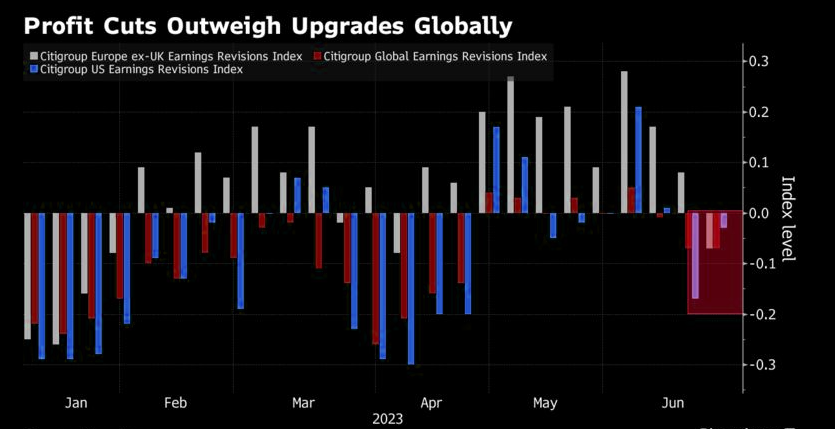
We have been witnessing global provider FedEx Corp. to Siemens Energy AG and European chemical firms cutting or withdrawing outlooks, and there may be more woe in store as the earnings season kicks off in earnest in two weeks.
 US EARNINGS OUTLOOK?
HOWEVER, US Wall Street analysts have actually made smaller cuts to EPS than average going into an earning season?
Time will soon tell if they are right, since the assessments are clearly disconnected from what we read in all the monthly Regional Federal Reserve Reports.
GLOBAL ECONOMIC REPORTING: What This Week’s Key Global Economic Reports Tell Us
 SUMMARY HIGHLIGHTS
-
- Initial Jobless Claims continue to rise.
- The June Employment crumbled to 209K with all previous months revised lower and 60K of the total made up of new Government jobs!
JUNE NON-FARM PAYROLLS (CHART BELOW)
June payrolls number came in at 209K, a big drop from last month’s blowout 339K print, which was revised down to 306K, and the lowest print since Dec 2020.
It wasn’t just May that was revised lower: the change in total nonfarm payroll employment for April was revised down by 77,000, from +294,000 to +217,000, and the change for May was revised down by 33,000, from +339,000 to +306,000. With these revisions, employment in April and May combined is 110,000 lower than previously reported. In fact, every single month in 2023 has now been revised lower.
The number missed the median economist expectation of 230K, which was the first time the series has missed since April 2022, and followed 13 consecutive beats.
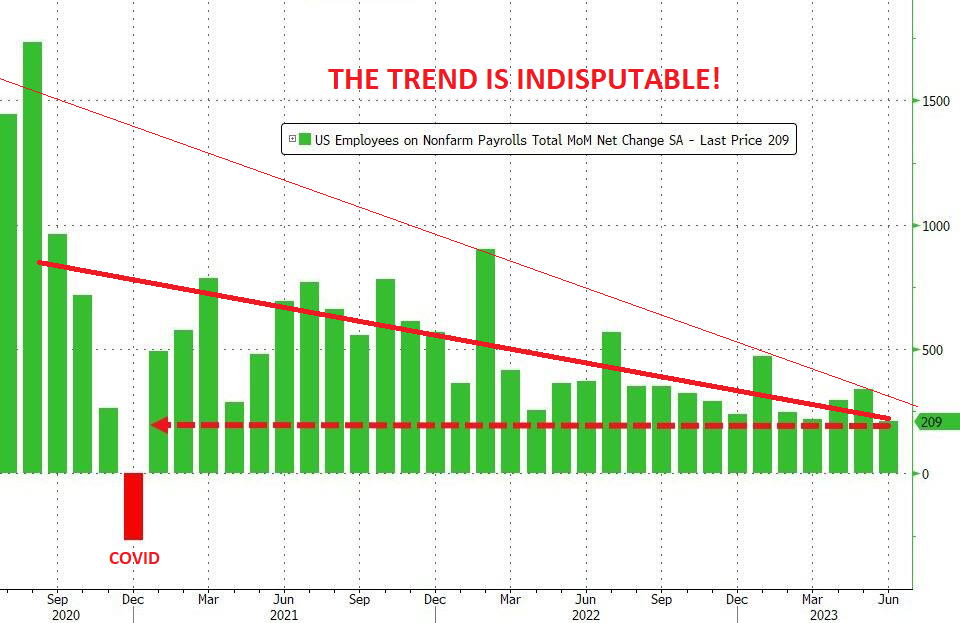
BIDENOMICS: The largest contributor to the 209K print was government. Employment in government increased by 60,000 in June. Employment continued to trend up in state government (+27,000) and local government (+32,000). Overall, government has added an average of 63,000 jobs per month thus far in 2023, more than twice the average of 23,000 per month in 2022.
SHADOWSTATS: May 2023 ShadowStats Alternate Unemployment increased to 24.7% from 24.6% on top of U-6 increasing to 6.7% from 6.6%.
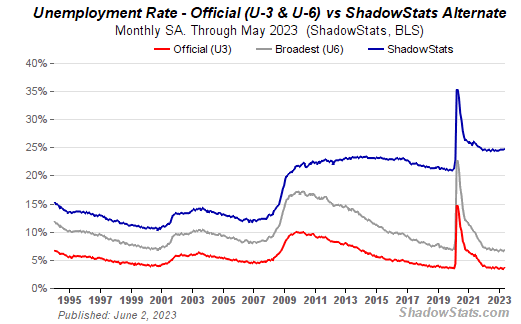 The seasonally-adjusted SGS Alternate Unemployment Rate reflects current unemployment reporting methodology adjusted for SGS-estimated long-term discouraged workers, who were defined out of official existence in 1994. That estimate is added to the BLS estimate of U-6 unemployment, which includes short-term discouraged workers. The U-3 unemployment rate is the monthly headline number. The U-6 unemployment rate is the Bureau of Labor Statistics’ (BLS) broadest unemployment measure, including short-term discouraged and other marginally-attached workers as well as those forced to work part-time because they cannot find full-time employment.
-
- More Than 105 Million Working-Age Americans Do Not Have A Job Right Now They are diligently searching for jobs, but the reality of the matter is that the employment market has become very tight. Meanwhile, the cost of living just continues to rise and that has resulted in a “collapse of household savings”.
-
- Personal Savings: Quarter Of Americans Have Few, 1 In 10 Have None Americans today are lacking crucial savings needed for managing short-term emergencies and building long-term wealth. According to a rolling representative online survey among U.S. adults by YouGov, 27 percent of Americans had some savings below $1,000 as of May 2023, while 12 percent said they had no savings at all.
WHAT DOES YOUR SCAN OF THE DATA BELOW TELL YOU? – THE MEDIA AVOIDS BAD NEWS!
We present the data in a way you can quickly see what is happening. Anything in Red is further deterioration.
In Green is an improvement over the last release.
CONCLUSION
 DISTRESSED FIRMS
There are now more significantly distressed firms today than there were when the Fed tightened monetary policy prior to the financial crisis and the Great Recession.
The high number of over-leveraged firms in distress is likely to have effects on investment, employment and aggregate activity that are stronger than in most tightening episodes since the late 1970s.
In other words, the impacts of this tightening cycle could be worse than the Great Recession.
In other words, the impacts of this tightening cycle could be worse than the Great Recession.
More than a decade of artificially low-interest rates, coupled with massive stimulus injected into the economy during the pandemic, incentivized companies to load up on low-interest debt. That was fine and dandy as long as rates were near zero. But with interest rates now pushed up to over 5%, many companies can’t service their massive debt loads. Many will undoubtedly go under.
According to a Fed paper, this will likely have “substantial effects on investment and employment.”
 BANKRUPTCY FILINGS
Bankruptcy Filings Show Credit Slipping Despite What Spreads Say.
It looks like the credit environment is set to worsen, but spreads appear to be disconnected.
SPIKING BOND YIELDS ARE NOW A PROBLEM!
EQUITY YIELDS HAVE DISCONNECTED FROM BOND YIELDS!
Click All Charts to Enlarge
1- SITUATIONAL ANALYSIS
This week we witnessed a major increase in US Treasury Bond Yields! The US equity market yields can only disconnect from bond yields for so long! That time is nearing and unless the upcoming Q2 earnings season is marked by stellar performance, we have a major adjustment looming!
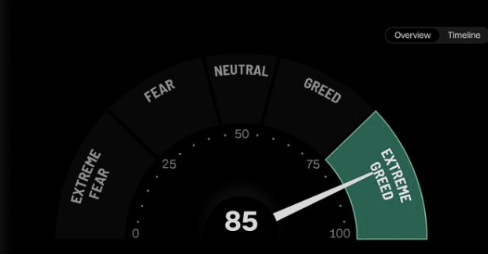 EXTREME GREED IS ALWAYS A CONCERN!
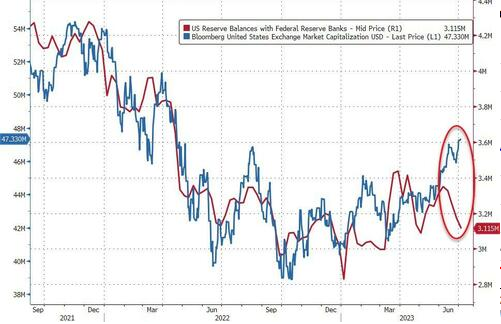
As the Risk Index registers readings in the extreme Greed level, the US equity market continues to charge ahead, decoupling from falling reserves at The Fed. (Chart below)
Banks have around 8 months left under the original 12-month BTFP Fed bailout program to find a way to stabilize their balance sheets. Not only have they failed to do so, usage of the BTFP facility remains near record highs, and yields are rising even more (increasing M-to-M losses).
2- CREDIT & LIQUIDITY
Meanwhile, Money Market Fund Assets have hit new record highs, as inflows resume and the Fed Balance Sheet shrink accelerates.
Bankruptcy Filings show Credit slipping despite what spreads say It looks like the credit environment is set to worsen, but spreads appear to be nonchalant about it all. However, we saw “JNK” break the lower trend support we have been warning about for sometime.
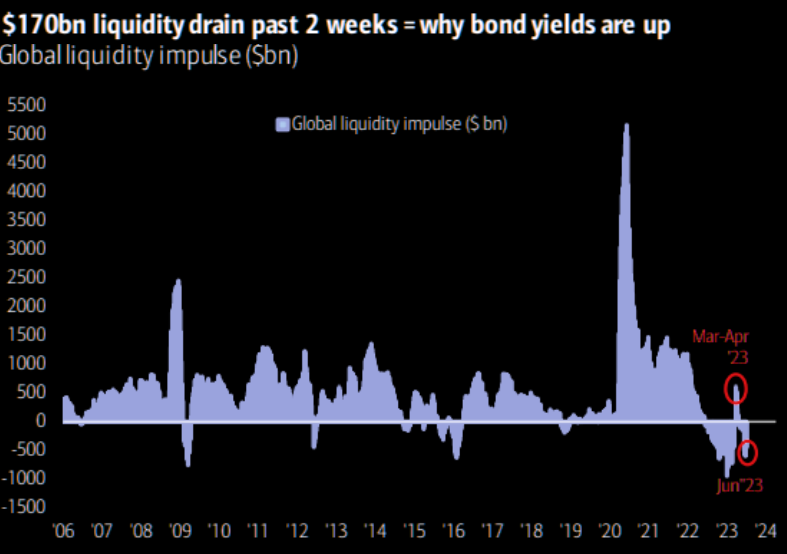
Liquidity drain over the past 2 weeks has drove the bond move. Beware there is another $1tn drain expected in the coming couple of months!
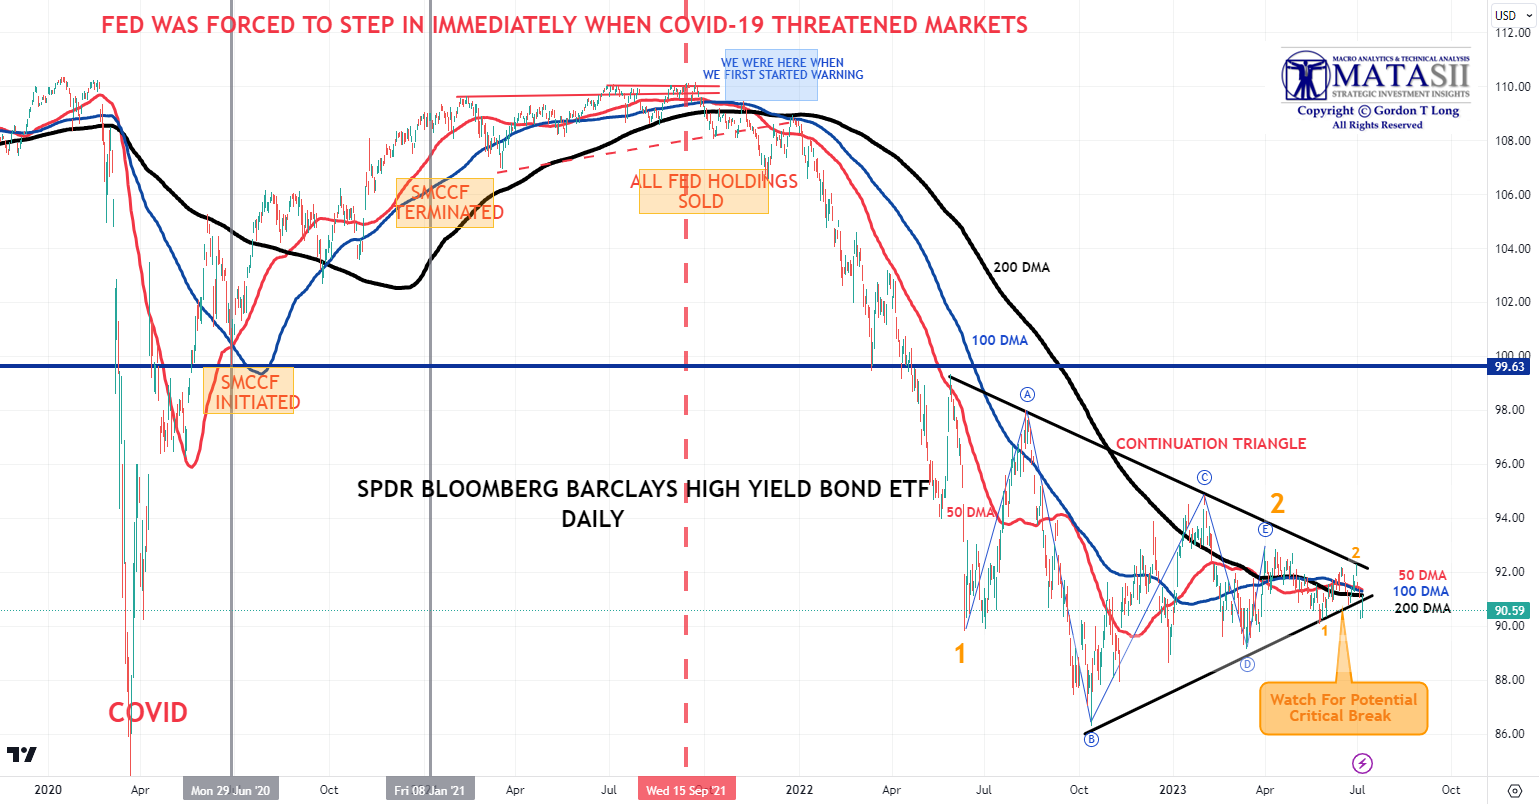
SPDR BLOOMBERG BARCLAYS HIGH YIELD BOND ETF – “JNK”
The High Yield “JNK” ETF briefly broke our lower trend support line before abruptly rising to close at the underside of the trend line, making it overhead resistance. We should expect weakness in “JNK” to lead equity markets lower.
YOUR DESK TOP / TABLET / PHONE ANNOTATED CHART
Macro Analytics Chart Above: SUBSCRIBER LINK
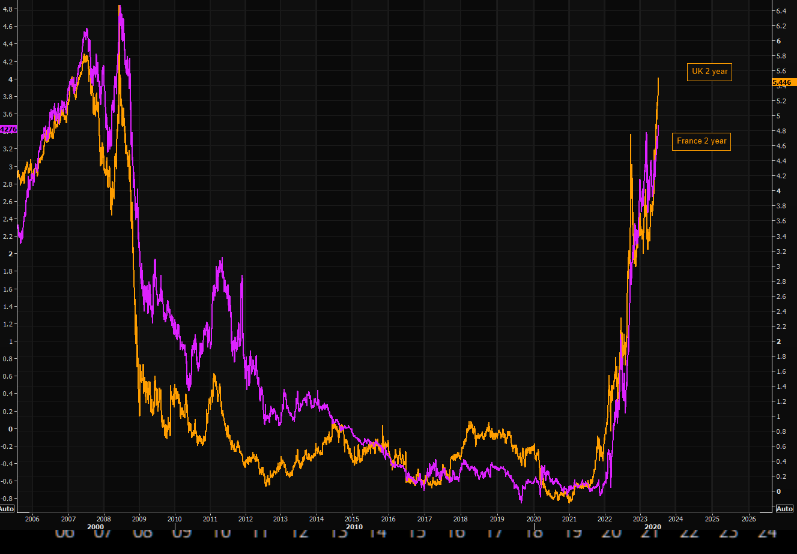
Everyone is trying to digest the moves in UK and French 2 year yields.We haven’t seen something like this …. ever?
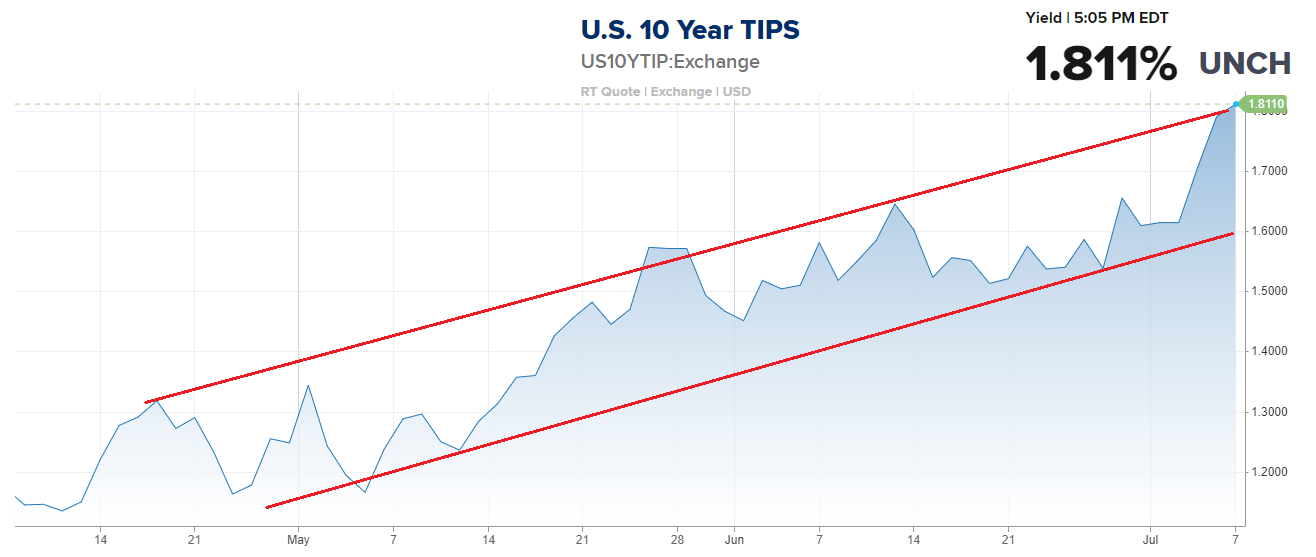
WE WITNESSED A SURGE IN TREASURY YIELDS THIS WEEK
The major driver was the movement in real rates.
INFLATION BREAK-EVENS
- 5yr BEI -0.6bps at 2.243%,
- 10yr BEI +0.3bps at 2.298%,
- 30yr BEI +1.3bps at 2.277%.
FISHER’S EQUATION: Nominal = Inflation + Real Rate
10Y UST
- Calculated Nominal = 2.298 + 1.811 = 4.109%.
- Actual Reported Close = ~4.0576%
3- TECHNICAL ANALYSIS
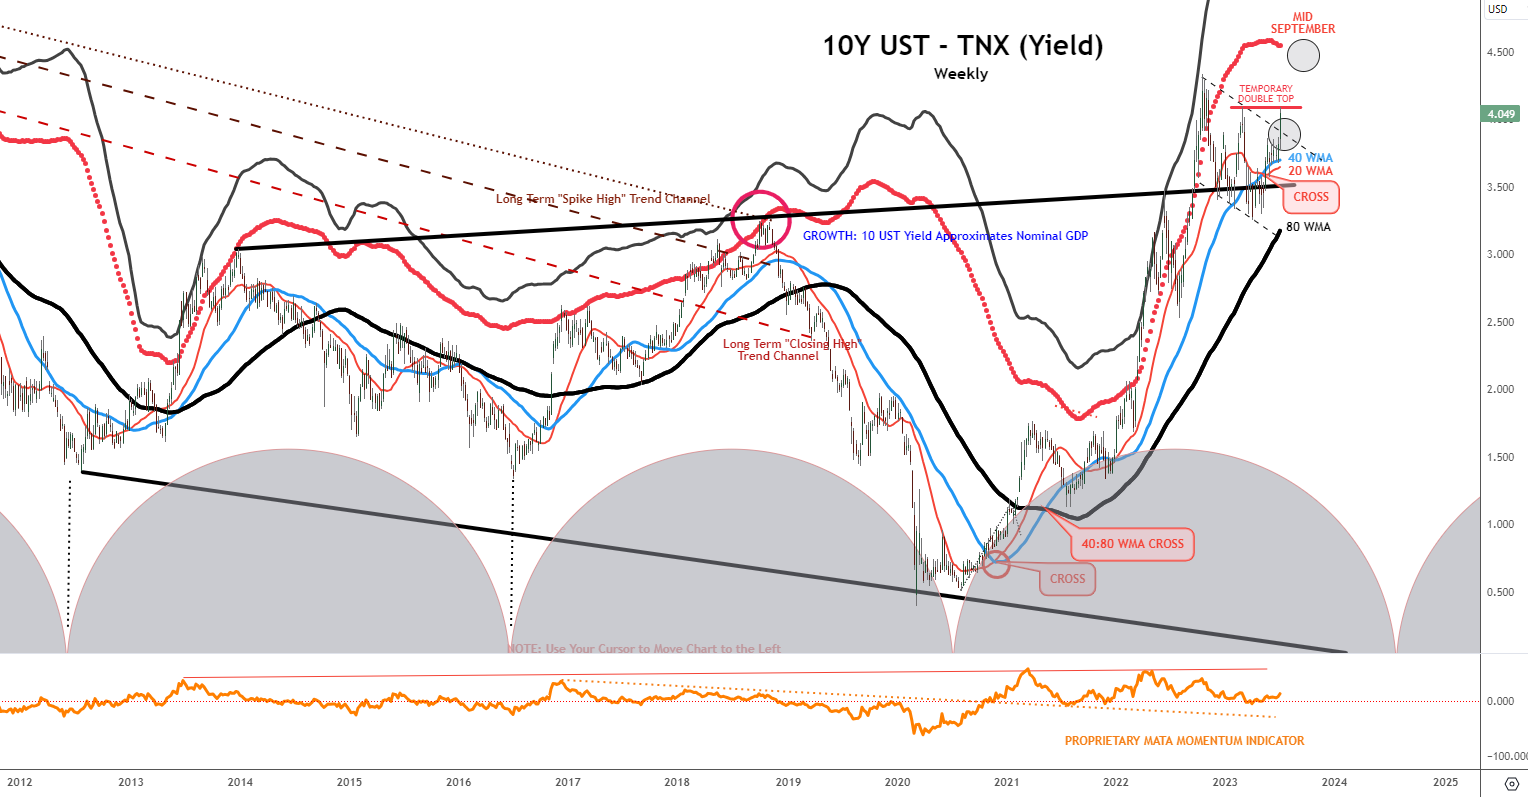
10Y UST – YIELD – “TNX” WEEKLY
Yield closed on our target (lower circle) puttting in a temporary double top at 4.09% (our calculated Fisher Equation target shown above. We expect consolidation before heading higher (top circled objective).
YOUR DESK TOP / TABLET / PHONE ANNOTATED CHART
Macro Analytics Chart Above: SUBSCRIBER LINK
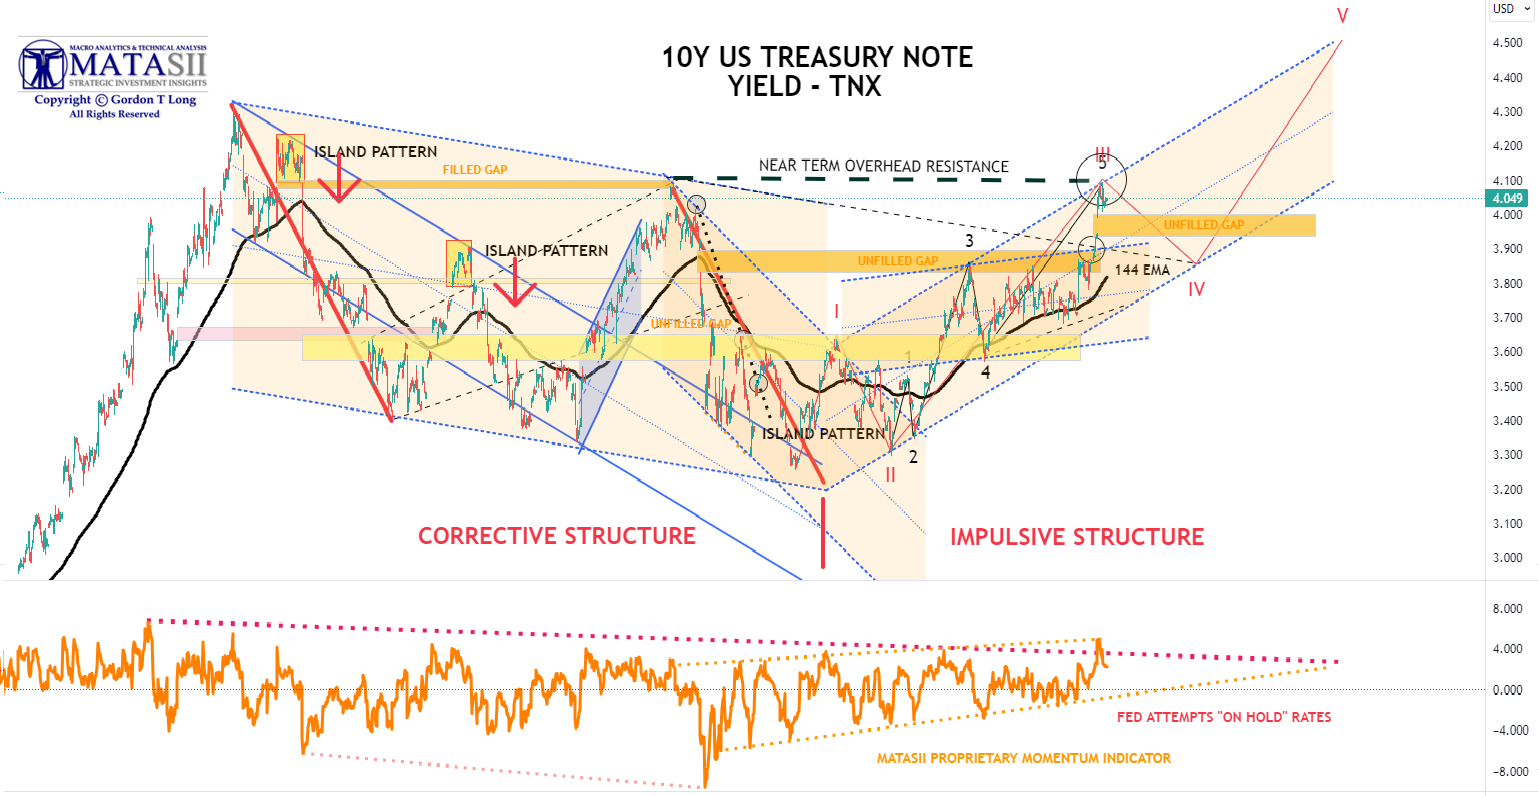
10Y UST – YIELD – “TNX” HOURLY
The Hourly TNX shows more granularity for the initial circle at ~4.09 shown above on the weekly chart. There is a gap that is likely to be filled before moving higher on yield.
The upper circle we expect to be in the area of ~4.5% and timewise approximating the September Quadruple Witch Options Expiration.
YOUR DESK TOP / TABLET / PHONE ANNOTATED CHART
Macro Analytics Chart Above: SUBSCRIBER LINK
FAIR USE NOTICE This site contains copyrighted material the use of which has not always been specifically authorized by the copyright owner. We are making such material available in our efforts to advance understanding of environmental, political, human rights, economic, democracy, scientific, and social justice issues, etc. We believe this constitutes a ‘fair use’ of any such copyrighted material as provided for in section 107 of the US Copyright Law. In accordance with Title 17 U.S.C. Section 107, the material on this site is distributed without profit to those who have expressed a prior interest in receiving the included information for research and educational purposes. If you wish to use copyrighted material from this site for purposes of your own that go beyond ‘fair use’, you must obtain permission from the copyright owner.
NOTICE Information on these pages contains forward-looking statements that involve risks and uncertainties. Markets and instruments profiled on this page are for informational purposes only and should not in any way come across as a recommendation to buy or sell in these assets. You should do your own thorough research before making any investment decisions. MATASII.com does not in any way guarantee that this information is free from mistakes, errors, or material misstatements. It also does not guarantee that this information is of a timely nature. Investing in Open Markets involves a great deal of risk, including the loss of all or a portion of your investment, as well as emotional distress. All risks, losses and costs associated with investing, including total loss of principal, are your responsibility.