Gordon T Long
Global Macro Research | Macro-Technical Analysis
GLOBAL MACRO
ECONOMICS
THE ONE QUESTION YOU MUST ANSWER!
We try quite hard to keep these newsletters focused on the key “signals” not the “noise”. So let me clearly state in simple terms what should be obvious to all our long term readers by now. The interest expense on Uncle Sam’s debt is now at ~$1T per annum against around $20T in GDP, a ratio which makes the inflationary money printing ahead now a “slam dunk” given!
The reason is because history without exception tells us this is the only recourse that politicians can be counted on reaching an agreement. Any other approach takes unusual leadership which the US has been devoid of for decades (with one exception which I will leave you to determine who that might have been)! Broken regimes can ALWAYS be relied on to debase their currencies. It’s just that simple!
What isn’t simple is what do you do about it?
Traditionally the answer has been to buy Precious Metals and natural resources. Anything that removed you from “paper” claims on wealth that the state will take from you, debase or tax as profit on financial “windfalls”. That is also a given. Your carefully hoarded gold can be counted on to be taxed as though you are a “financial terrorist” with trading in it being nothing short of a level 1 felony. Count on it!
You therefore increasingly need to start thinking out of the box with a full appreciation that wealth can only be created and maintained by: 1-Mining it, 2-Growing it or 3-Building it. Everything else is only paper IOU claims on real wealth. Unfortunately, you can also count on the growing “Regulatory State” to begin nationalizing these three areas by various means, as the currency debasement worsens.
Therefore, how you maintain and grow your wealth going forward is a tough question to answer! However, this has become a central question as governments are becoming increasingly predatory! They are trapped and see no other recourse!
We don’t give investment advice at MATASII.com (we are not institutionally licensed by the state) so don’t look to us to tell you the answer. However, what we are legally allowed (at least temporarily) is to present you with the right questions you need to answer!! (For that we are only exposed to being shadow banned or censored for mis-information).
THE ONE QUESTION YOU MUST ANSWER: What is your investment strategy for a failing economy in the unfolding regulatory administrative state where policy is enacted, not through a gridlocked congress, but through dictatorial Executive Order (mandates) or administrative regulation?
WHAT YOU NEED TO KNOW
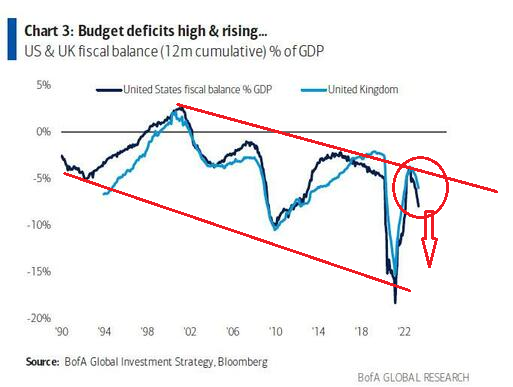 LIQUIDITY: Larger Deficits Mean More Government Directed Inflationary Spending
If rates continue higher, we’ll hit a point where they crush the economy, However, until we hit that point, the thing that could surprise investors most would be higher rates lifting government interest payments on debt that are then funded by rising deficits? The CBO forecasts a 5.3% deficit in 2023 ($1.4trln), and 6.1% in 2024 and 2025. There is this expectation that higher rates slow inflation. We should be on the lookout for signs that higher rates spur a flood of cash from the government into the economy that sustains inflation in ways that few people can yet imagine! Most currently see the Treasury borrowing as draining liquidity but actually it may be more about it being redirected.
UNDERSTANDING BIDENOMICS – President Biden Outlines His Economic Strategy and It Backfires!
-
- “IT’S THE ECONOMY STUPID!” – The Game of Mis-Direction. The video only worsened Biden’s position because it was so filled with mis-information, mis-direction, fabrications and massaged data from Biden’s BLS “adjustments” that even the Wall Street Journal took exception to it! The WSJ went so far as to caption their reporting on it as: “Bidenomics in One Lesson – The Bureau of Labor Statistics says real average hourly earnings have fallen 3.16% during the Biden Presidency”. The WSJ concluded their reporting in regard to the mis-direction of the presentation with: “All of which reminds us of the old Marx Brothers joke: Who are you going to believe, me or your own eyes? Regarding Bidenomics Americans should believe their own eyes!”
- “IT’S ABOUT DATA MANIPULATION STUPID!” – The Game of Statistical Data Manipulation
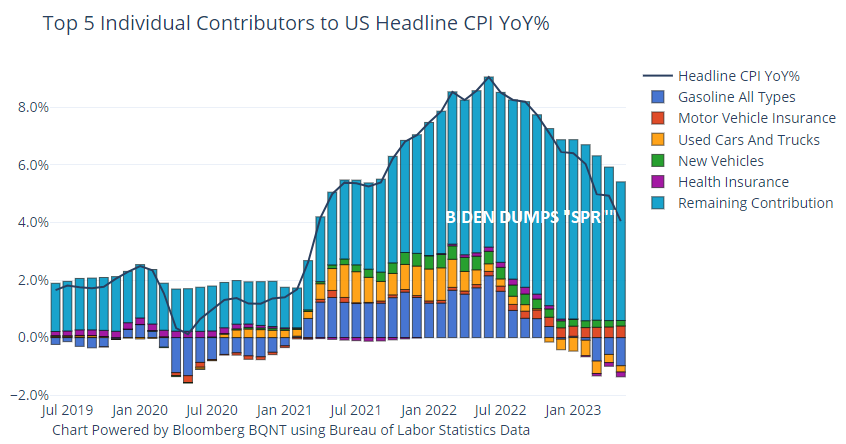
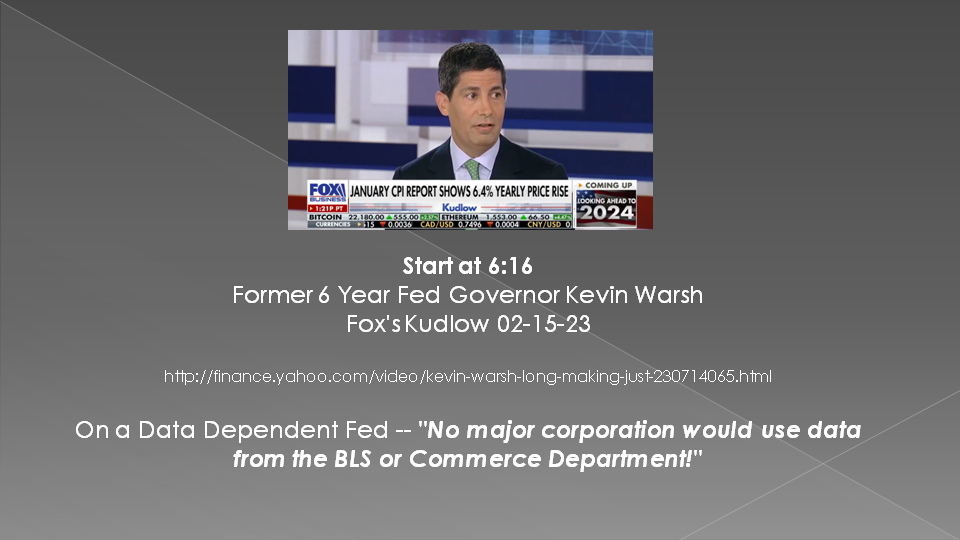
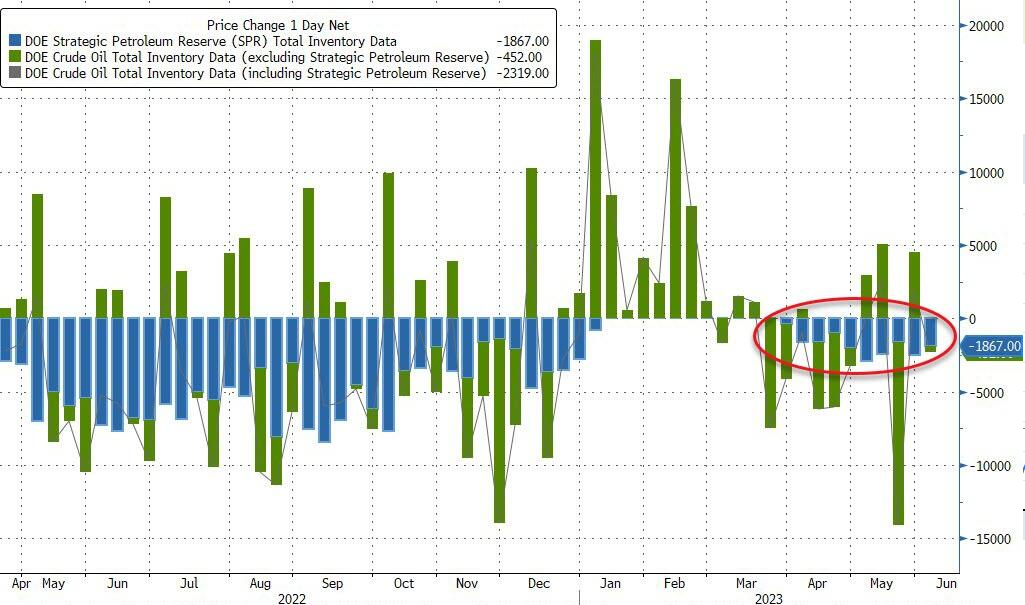
- OUTRIGHT POLICY MANIPULATION: The Selling off of the US National Strategic Petroleum Reserves (SPR)SEASONAL ADJUSTMENTS: Almost every government report that suddenly shows an unexpected 2 Sigma+ deviation is a result of “seasonal adjustments”. All analysts know exactly what the expected seasonal adjustment is going to be but that is not what happens. Instead we get a shocker seasonal adjustment with no explanation? That is why recently retired voting Federal Reserve Governor Kevin Warsh stated “No Major Corporation Would Use Data from the BLS or Commerce Department!”
- TRAILING ADJUSTMENTS: Another standard procedure being used by the Biden administration is to adjust reports on a trailing basis. The BLS or Commerce Department report headline results in line with the required narrative being pushed, then in subsequent months adjust the data so the distortions can be “managed away” (if possible). In many ways it is a cyclical narrative process of relative good news, bad news with the adjustments alleviating the data distortion pressures.
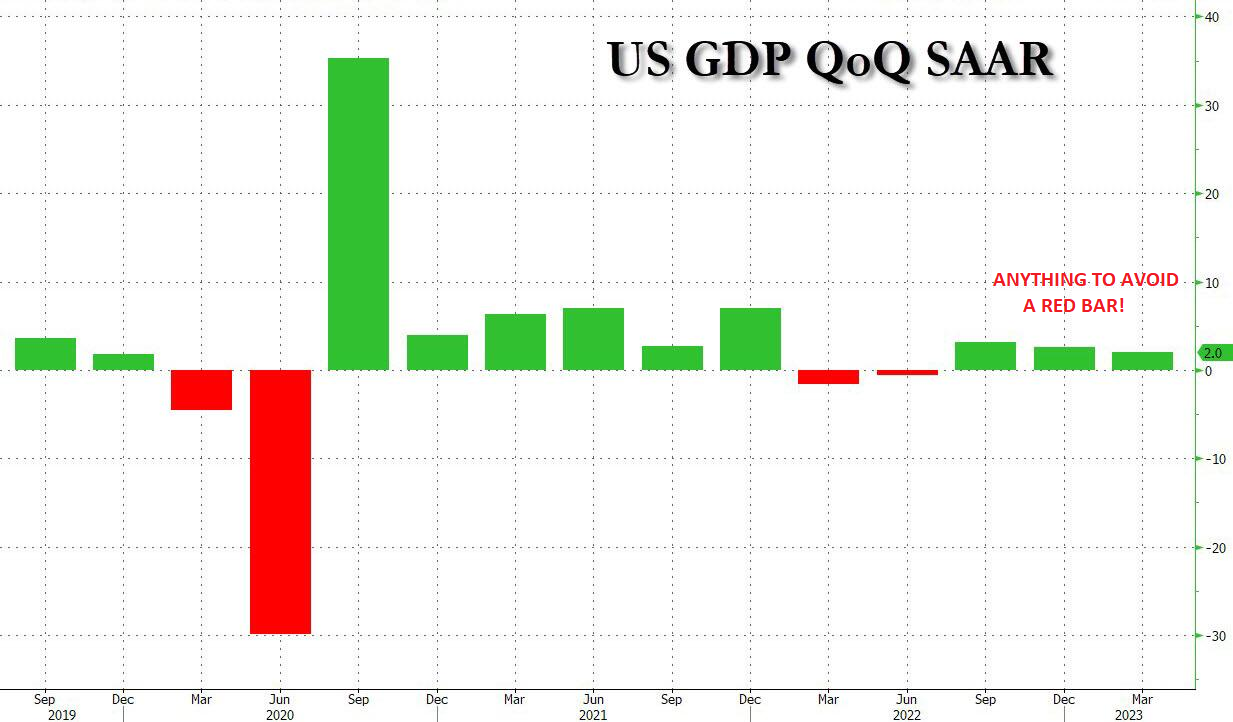
- A DOUBLE ACCOUNTNG SYSTEM: The GDP must equal GDI (within margin of error).It suddenly doesn’t because you can’t hide the broad degree of statistical data manipulation going on!
ECONOMIC DATA NOT AS STRONG AS MOST STILL BELIEVE
-
- Economic Data Isn’t Near As Strong As The Headlines Claim
-
- JOBS: Since 2022, the Establishment Survey and the Household Survey have ceased to correlate similar trend, with a sizable gap forming between the two surveys. In fact, over the past two years, the two surveys show a gap of 2.2 million jobs??
- CONSUMER CONFIDENCE: Lower Inflation expectations were primarily driven by a big drop in energy prices. Biden’s 12 week SPR selling correlates with improving inflation expectations. Gasoline prices at the pump are down over 20% from this time last year.
- RISING HOME SALES: Sales of new homes is primarily a function of tight inventory in the existing housing market. Existing home sales were only up 0.2% but were down 20.4% from a year ago
- DURABLE GOODS ORDERS UP: Excluding transportation, the last two months balance out to zero. Excluding defense, durable goods orders fell.
- MAY RETAILS SALES BEAT EXPECTATIONS: Retail sales increased by 0.3% month over month and grew by 1.6% year-over-year. That sounds like Americans are buying a lot of stuff. But in reality, they are paying the inflation tax. Retail sales are not adjusted for inflation.
 CONCLUSION
NO ONE BELIEVES THE FED!
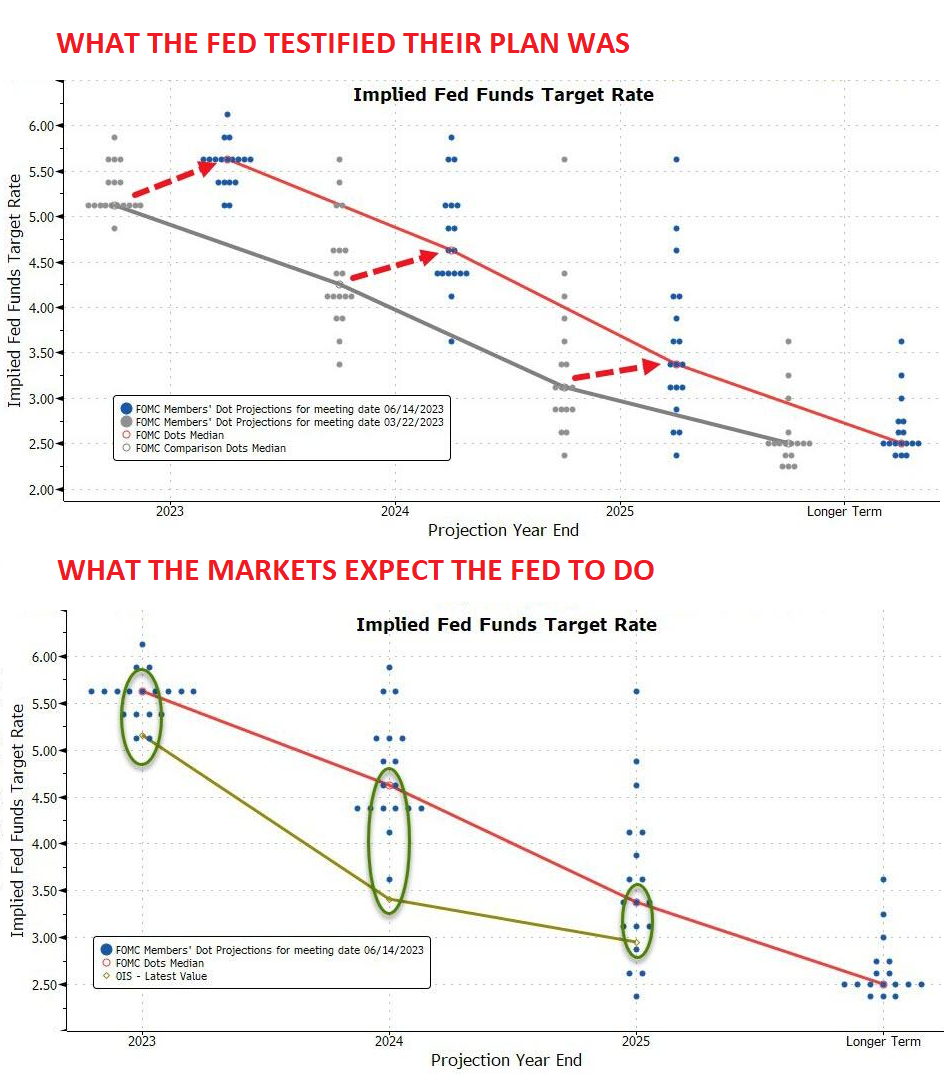
CHARTS RIGHT: The Fed is very clear on what they expect to do and reconfirmed during the Semi-Annual Humphrey-Hawkins Congressional Hearings last week. The markets however clearly reject this and are pricing in another outcome.
But, just maybe they should believe the Fed!!
FED MANUFACTURING SURVEY
A FOOD MANUFACTURER
“Stagflation – Political incompetence is creating an unstable business environment.”
COMPUTER & ELECTRONIC PRODUCT MANUFACTURER
“We are starting to see a major shift in industrial production and a lack of confidence”.
(More Quotes in newsletter’s Conclusion Section)
We highlight key 1- LAYOFFS, 2- EARLY EARNING WARNINGS, 3- BANKRUPTCIES & CREDIT SPREADS and 4- STRIKES presently occurring. These further suggest that the US and Global Economy is worsening.
UNDERSTANDING BIDENOMICS – President Biden Outlines His Economic Strategy & It Backfires!!
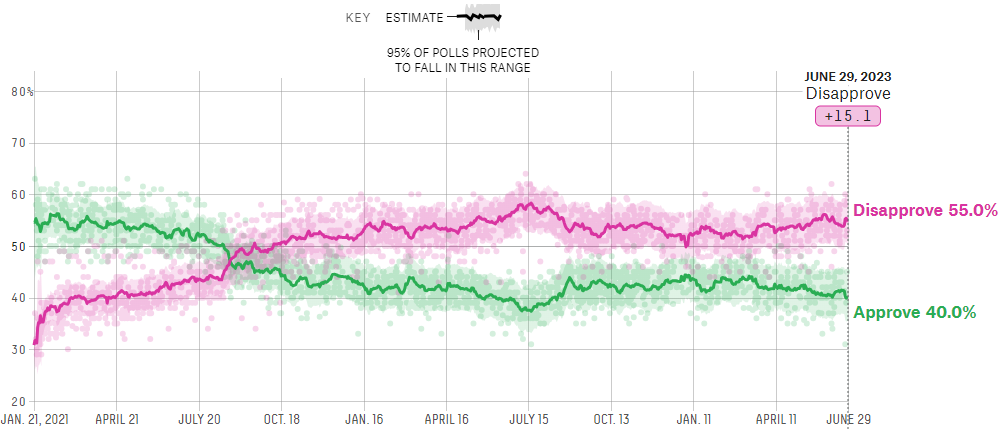
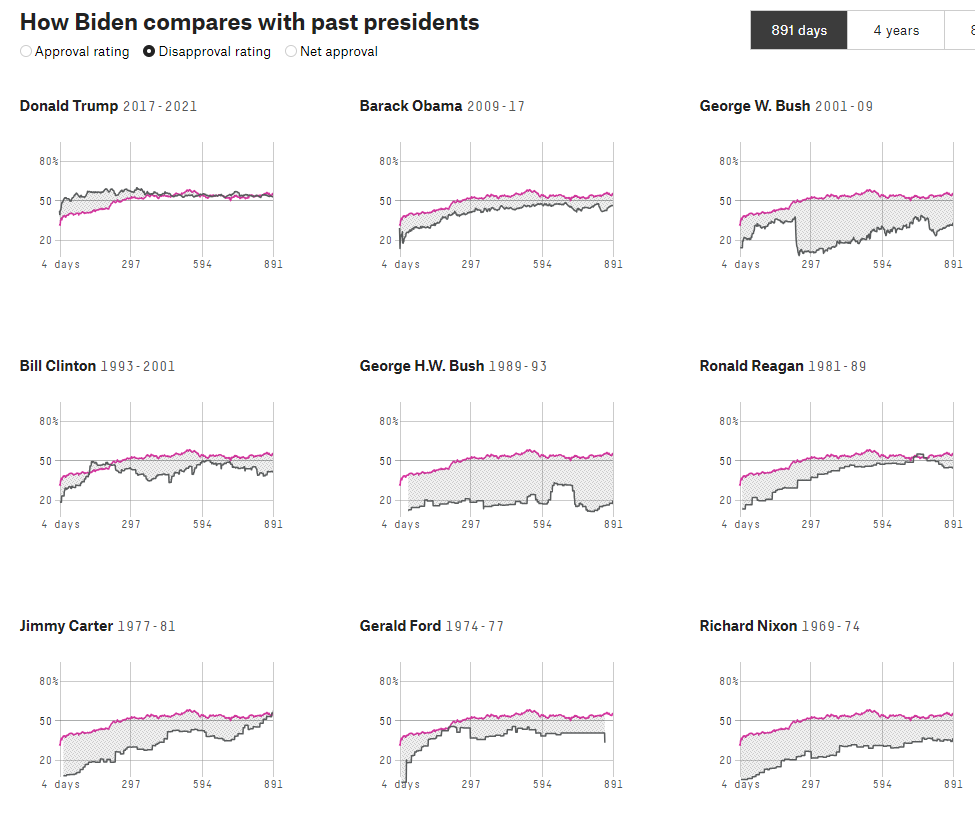
With some of the lowest polling results for a sitting President since jimmy Carter and Harry Truman the Biden Administration went on the offensive by rolling out a major presentation by the President to shore up election polling going into the 2024 Presidential campaign.
RIGHT: Video Presentation – 40 Minutes
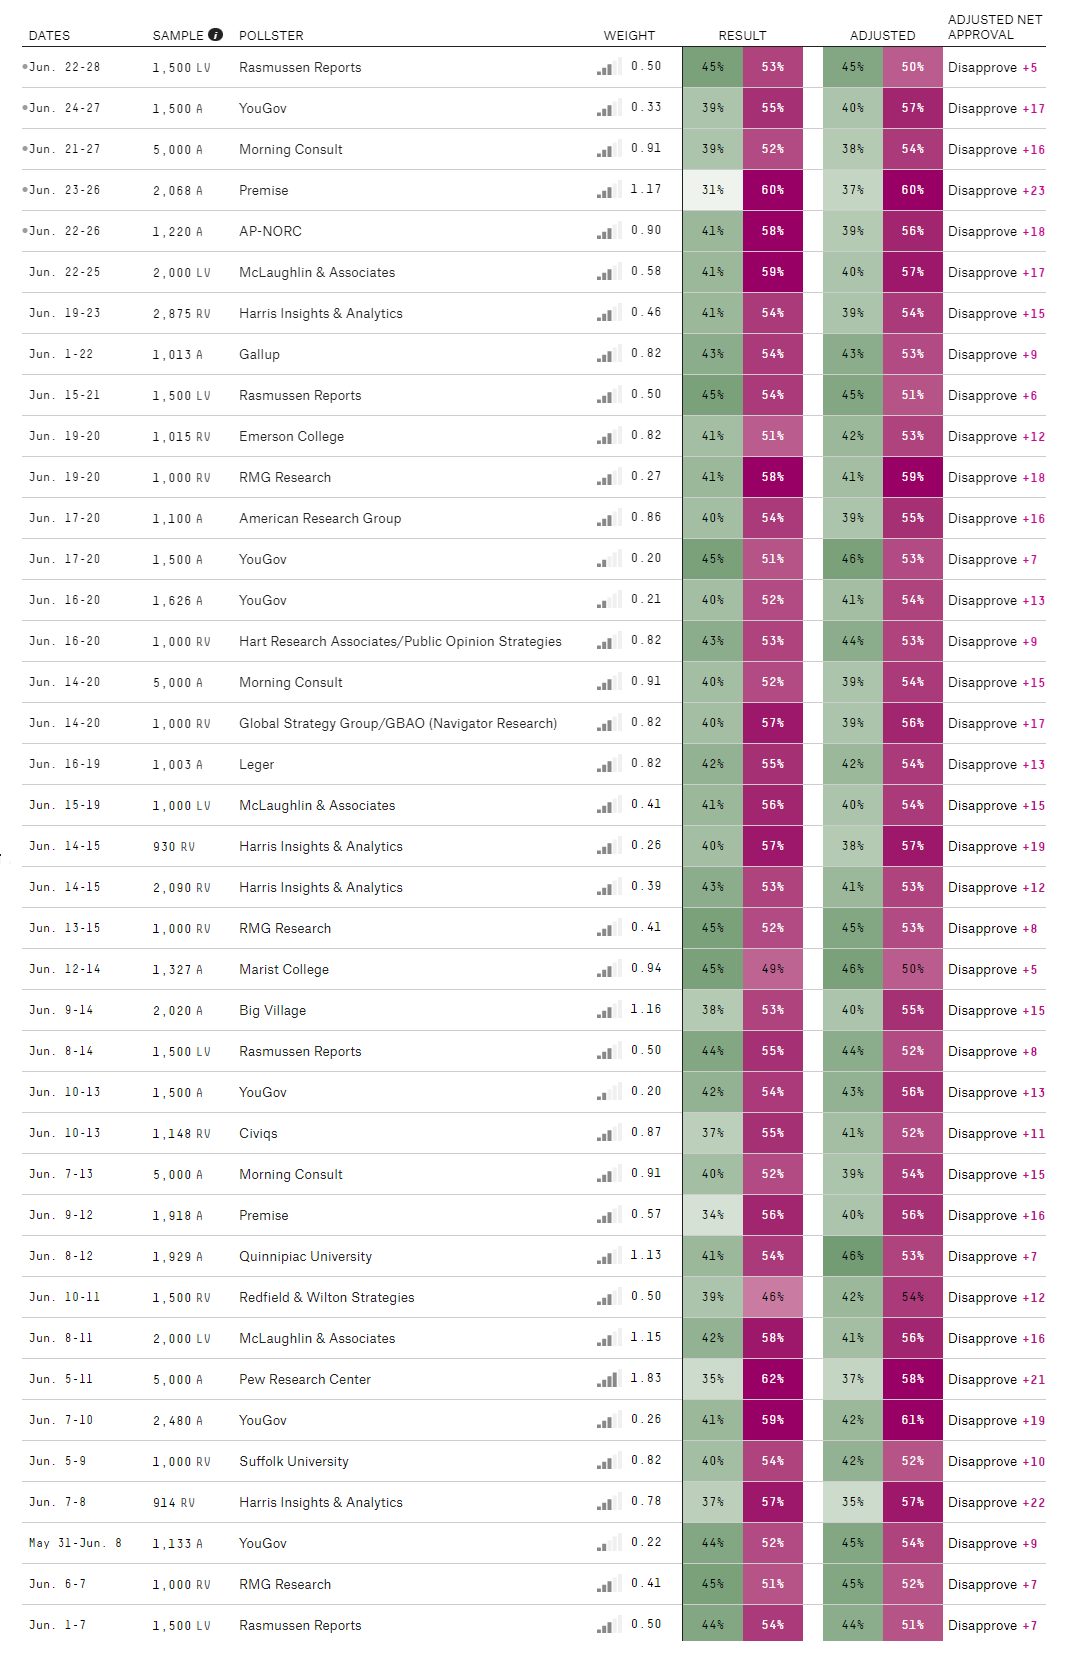
BELOW: Summary of Major Pollsters (of all leanings / persuasions)
BIDEN IS UNQUESTIONABLY IN SERIOUS POLITICAL TROUBLES – AND THE PRESENTATION MADE IT WORSE!
“IT’S THE ECONOMY STUPID!” – The Game of Mis-Direction
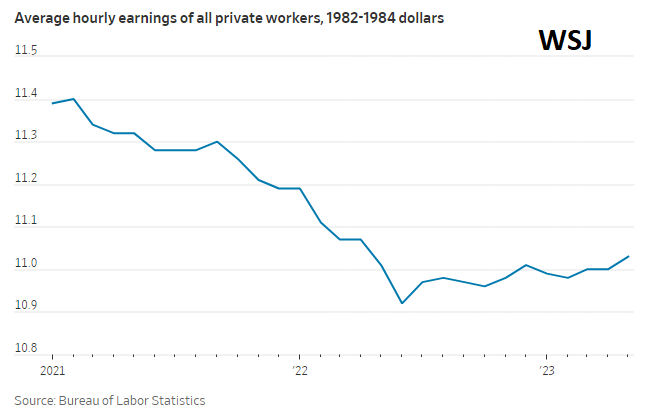 The video only worsened Biden’s position because it was so filled with mis-information, mis-direction, fabrications and massaged data. Biden’s BLS “adjustments” that even the Wall Street Journal took exception to it! went so far as to caption their reporting on it as: “Bidenomics in One Lesson – The Bureau of Labor Statistics says real average hourly earnings have fallen 3.16% during the Biden Presidency”
The WSJ concluded their reporting in regard to the mis-direction of the presentation with: “All of which reminds us of the old Marx Brothers joke: Who are you going to believe, me or your own eyes? Regarding Bidenomics, Americans should believe their own eyes!”
IT’S ABOUT DATA MANIPULATION STUPID! – The Game of Statistical Data Manipulation
Since the beginning of Q1 when the short lived Labor Secretary (responsible for overseeing the Bureau of Labor Statistics – BLS) abruptly resigned the game of manipulation as moved from mere use of Substitution, Hedonics, Imputation et al into a new realm of the absurd! All major houses from Goldman Sachs, BoAML, Morgan Stanley to JP Morgan have publically questioned the government’s Economic releases.
1- OUTRIGHT POLICY MANIPULATION
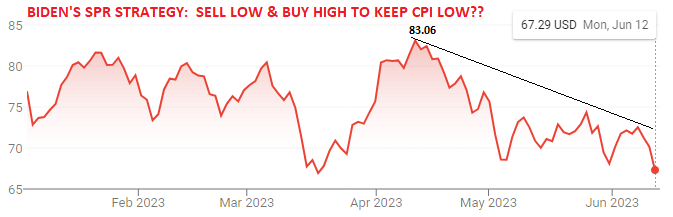 Policy decisions are being made with one purpose only, to manipulate data for the sole purpose (at great public expense) to sway public sentiment and confidence. Two weeks ago we outlined the latest such example (BIDEN REGIME BUSY OVER THE LAST 11 WEEKS) with the dangerous drawdown of the Strategic Petroleum Reserves (SPR) to simply show a reduction (temporary) in the CPI.
 2- SEASONAL ADJUSTMENTS
Almost every government report that suddenly shows an unexpected 2 Sigma+ deviation is a result of “seasonal adjustments”.
All analysts know exactly what the expected seasonal adjustment is going to be but that is not what happens. Instead we get a shocker seasonal adjustment with no explanation? That is why recently retired voting Federal Reserve Governor Kevin Warsh stated “No Major Corporation Would Use Data from the BLS or Commerce Department!”
CHART RIGHT: Link to Larry Kudlow interview of Fed Governor Kevin Warsh
3- TRAILING ADJUSTMENTS
Another standard procedure being used by the Biden administration is to adjust reports on a trailing basis. The BLS or Commerce Department report headline results in line with the required narrative being pushed, then in subsequent months adjust the data so the distortions can be “managed away” (if possible). In many ways it is a cyclical narrative process of relative good news, bad news with the adjustments alleviating the data distortion pressures.
The most blatant example of this is the well followed monthly non-farm Payrolls number. Here a factor called the “Birth/ Death Model” is employed. It supposedly reflects new jobs being created due to new companies being created. These numbers are complete fabrications and simply overwhelm the monthly numbers. Likewise the quarterly and annual adjustments are so large as to make the monthly NFP nothing more than a propaganda tool. (See latest explanation)
We are all still trying to understand “Special Procedures” implemented. I challenge readers to follow the latest explanation link above and the statement below to rationalize the reporting since January.
CHANGES TO THE NET BIRTH-DEATH MODEL DUE TO THE COVID-19 PANDEMIC
The labor market experienced widespread disruption at the onset of the pandemic, leading to a breakdown in the historical relationship between business openings (births) and closings (deaths). To better reflect the net effect of the contribution of business births and deaths to the estimates during the pandemic, BLS implemented special procedures to the net birth-death model in March 2020. Effective with the release of October 2021 preliminary estimates, BLS determined that adjustments to its birth-death methodology were no longer necessary. Therefore, the birth-death contribution to establishment survey estimates beginning with October 2021 are forecast using the methodology used prior to the onset of the of the COVID-19 pandemic (described on this page). More information about changes to the CES net birth-death model during months affected by the COVID-19 pandemic are available on our birth-death frequently asked questions page at www.bls.gov/web/empsit/cesbdqa.htm#qa8.
A DOUBLE ACCOUNTNG SYSTEM – GDP versus GDI
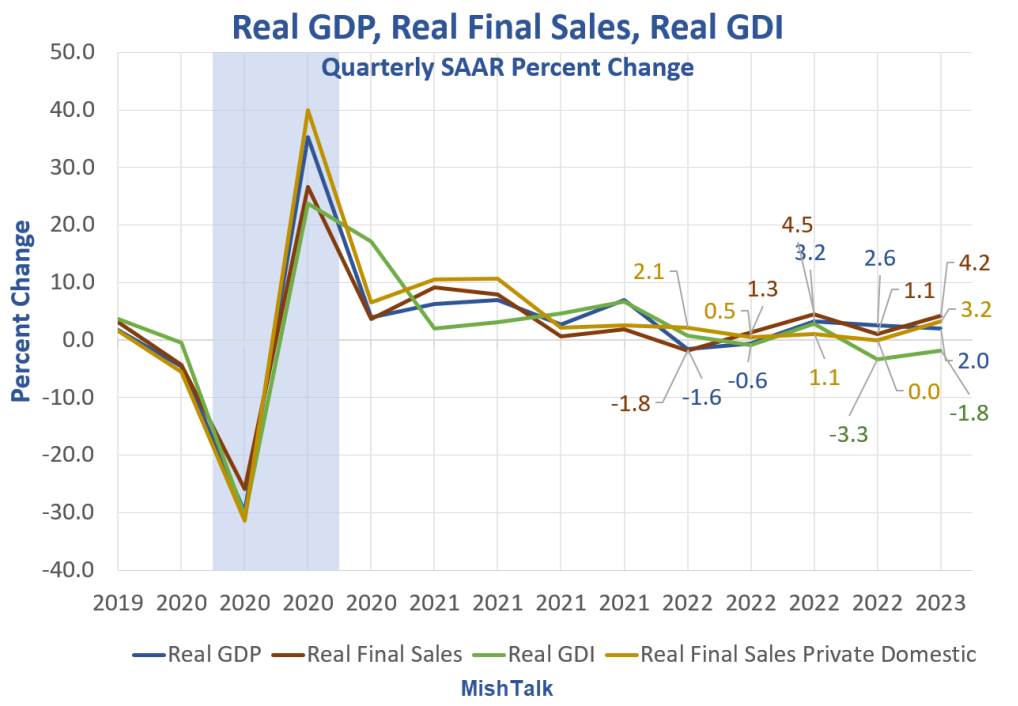 To avoid mistakes and stop fraud accountants have long used a “double accounting” process. The Gross Domestic Product was designed with a similar basis. The other side of the GDP ledger is the Gross Domestic Income (GDI). They should equal or be relatively close based on the realities of effective and timely data capture.
My former macro Analytics co-Host Mish Shedlock recently issued a report entitled “Largest Discrepancy between GDP and GDI In 20 Years”. Others have also reported this as well as myself.
Meanwhile the BEA reported last Thursday that Q1 GDP grew much faster than expected at the start of the year, rising at a 2.0% SAAR, up dramatically from the 1.3% GDP print reported in the second estimate one month ago, and up almost 100% from the 1.1% initial Q1 GDP report published two months ago. More importantly, the number was a two-sigma beat to consensus expectations of a 1.4% increase, the biggest outlier to the third GDP estimate in over a decade, a testament to how unexpected the beat was!
We have a discrepancy of +2.0% versus -1.8%!!! As we all know we can’t have a negative quarter because two negative quarters is officially a Recession and destroys the Bidenomic success story! – I won’t bother with an accounting of Q4 2022.
Biden’s Economic & Fiscal Policies have been nothing short of a disaster. His Public Policies like Covid Mandates and Student Loan Forgiveness have been overpoweringly rejected by the Supreme Court as unconstitutional. As a result 100’s of Millions worth of suits against the US Government are now pending in the courts. As far as Foreign Policy, it would be hard for a Chinese or Russian strategist to come up with a record better than Biden’s to emasculate America’s military and radically reduce its global stature.
The presentation of Bidenomics is yet another blunder. Instead of the truth we all so desperately seek, we are played like useful idiots.
ECONOMIC DATA NOT AS STRONG AS MOST STILL BELIEVE
“The government and mainstream media always try to paint data as rosy as possible in order to support consumer confidence, falsely believing that keeping people spending will somehow improve the economy.
In reality, all it does is trick people into further overextending themselves and make things much worse.
True economic growth is supported by a high savings rate and investment with low consumer spending.
What we have is an extremely sick economy made much worse by central planners and mainstream media.”
Passant Gardant
MISLEADING NARRATIVES
1- JOBS
-
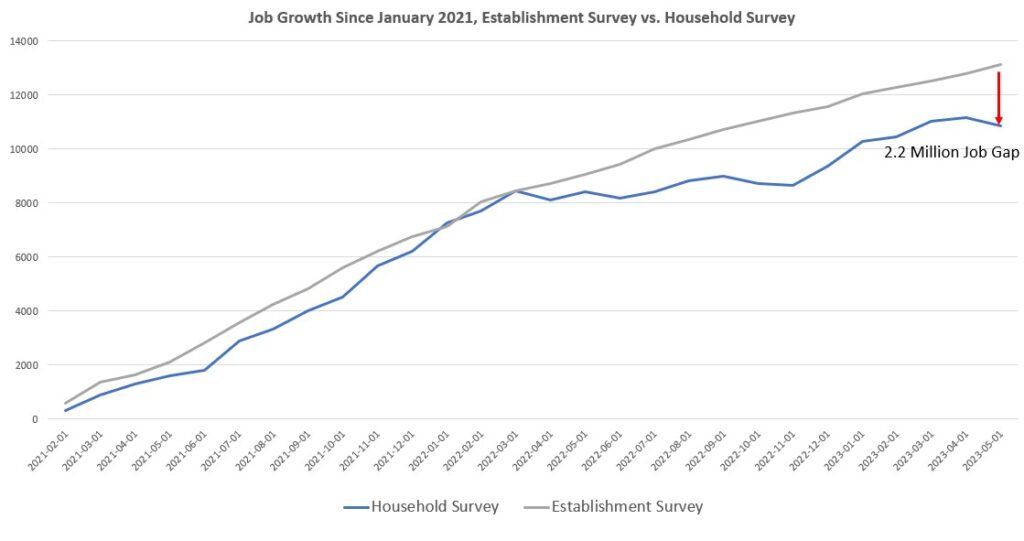 The Household survey over the past two years has not shown nearly as much job growth as the Establishment Survey.
- Specifically, we find that since 2022, the Establishment Survey and the Household Survey have ceased to follow a similar trend, with a sizable gap forming between the two surveys. In fact, over the past two years, the two surveys show a gap of 2.2 million (Chart Right)
-
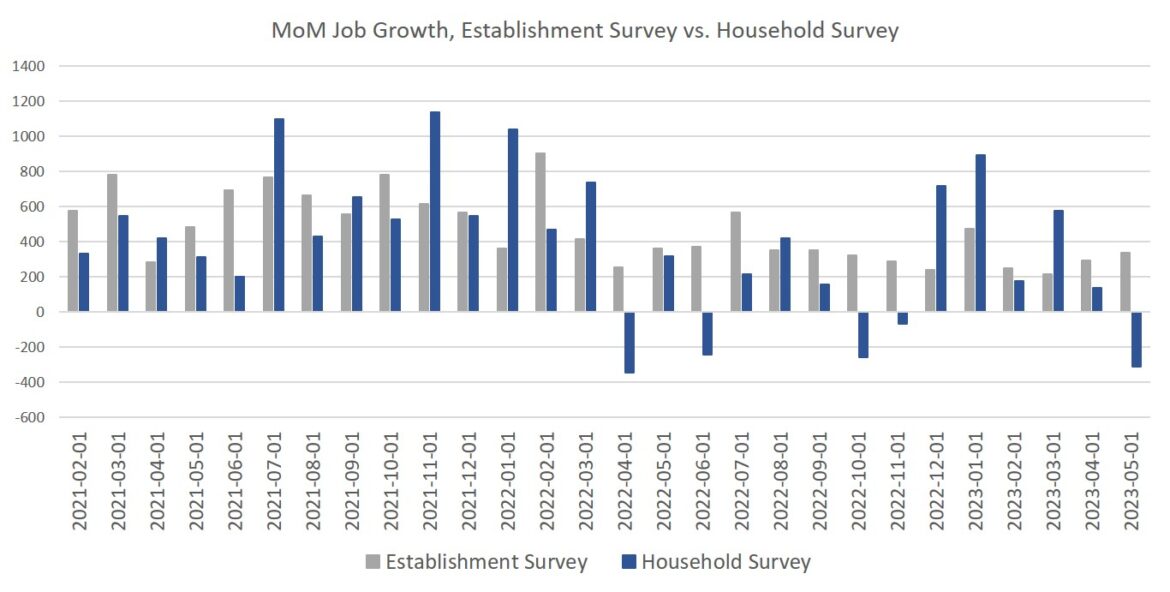 Moreover, in May, while the Establishment Survey showed a gain of 339,000 jobs month-over-month, the Household Survey showed a loss of 310,000 employed persons. That’s a gap of more than 600,000. Looking at month-to-month changes, we can also see how the two surveys have diverged since April 2022.
2- CONSUMER CONFIDENCE
-
 The Conference Board Consumer Confidence Index came in at 109.7 versus an expectation of 104. Last month, Consumer Confidence was 102.3.
- “Consumer confidence improved in June to its highest level since January 2022, reflecting improved current conditions and a pop in expectations,” Conference Board chief economist Dana Peterson said. “Greater confidence was most evident among consumers under age 35, and consumers earning incomes over $35,000. Nonetheless, the expectations gauge continued to signal consumers anticipating a recession at some point over the next 6 to 12 months.”
- But what exactly is driving consumer confidence higher? Lower inflation expectations.
- And lower inflation expectations were primarily driven by a big drop in energy prices. (Biden’s 12week SPR selling correlates with improving inflation expectations) Gasoline prices are down over 20% from this time last year.
- Falling gasoline prices aren’t a sign of a healthy economy. In fact, the expectation of a recession has put a drag on oil prices.
3- RISING HOME SALES
-
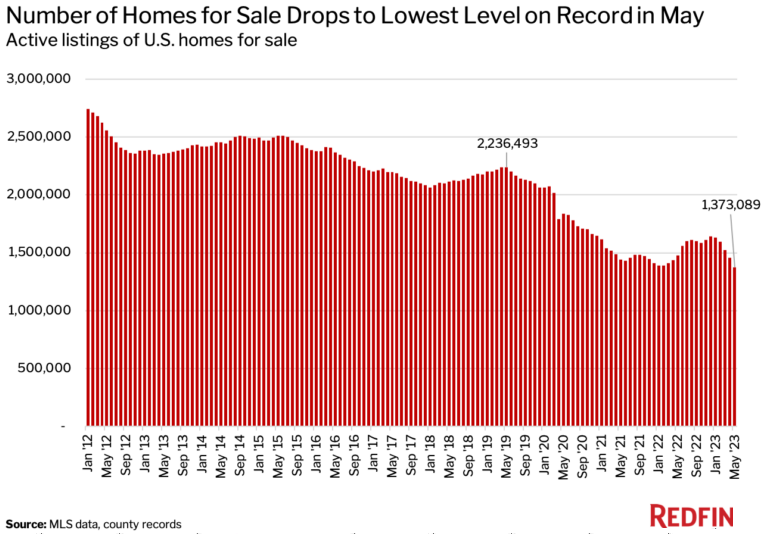 Home prices rose 0.5% month-on-month in April and new home sales surged 20% year-on-year in May. But this sale of new homes is primarily a function of tight inventory in the existing housing market. Existing home sales were only up 0.2% and were down 20.4% from a year ago.
- Home sales typically rise in the spring, so these positive numbers may well be an anomaly. Rising prices (another sign of sticky price inflation) coupled with rising interest rates will continue to put a drag on the housing market.
4- DURABLE GOODS ORDERS
-
- Orders for manufactured US goods jumped 1.7% in May. Economists had expected a decline. This was immediately sold as a sign of a strong economy. But even MarketWatch conceded, “The industrial side of the economy is just muddling along.”
- In fact, the entire increase was attributed to the extremely volatile transportation sector and defense spending for the war in Ukraine.
- Excluding transportation, the last two months balance out to zero.
- Excluding defense, durable goods orders fell.
- Far from signaling a strong economy, the actual economic signal is contraction.
5- RETAIL CONSUMER SALES
-
- Retail sales increased by 0.3% month over month and grew by 1.6% year-over-year. That sounds like Americans are buying a lot of stuff. But in reality, they are paying the inflation tax.
- Retail sales are not adjusted for inflation. When you factor in rising prices, sales of actual stuff were basically flat month-on-month. And year-on-year the sale of goods and services on a quantity basis is down substantially when you adjust for 4% price inflation.
- Furthermore, much of this spending is being put on credit cards. Again, this is not a sign of a strong economy.
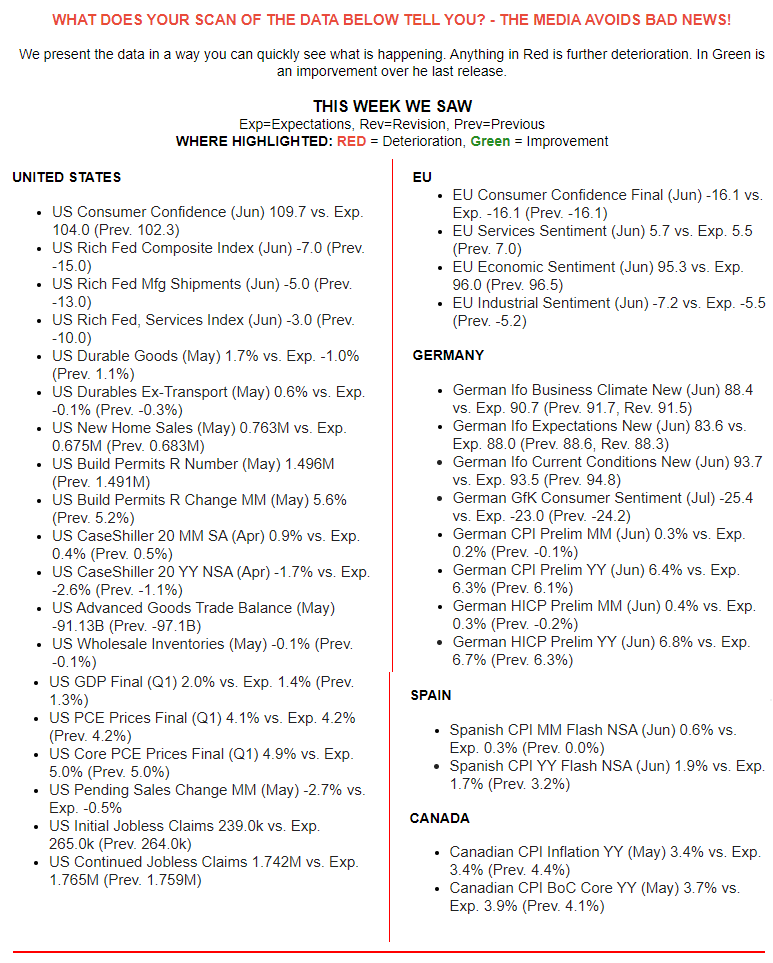
GLOBAL ECONOMIC REPORTING: What This Weeks Key Global Economic Reports Tell Us
 SUMMARY HIGHLIGHTS
-
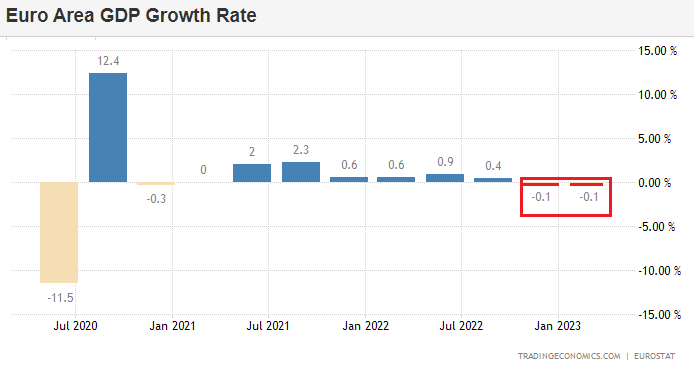
- The EU is in Recession and has been since Q1. This was announced with quietly revised data.
- China’s Exports went negative on a Y-o-Y basis. This is particularly bad remembering that a year ago China was in full Covid lockdowns!
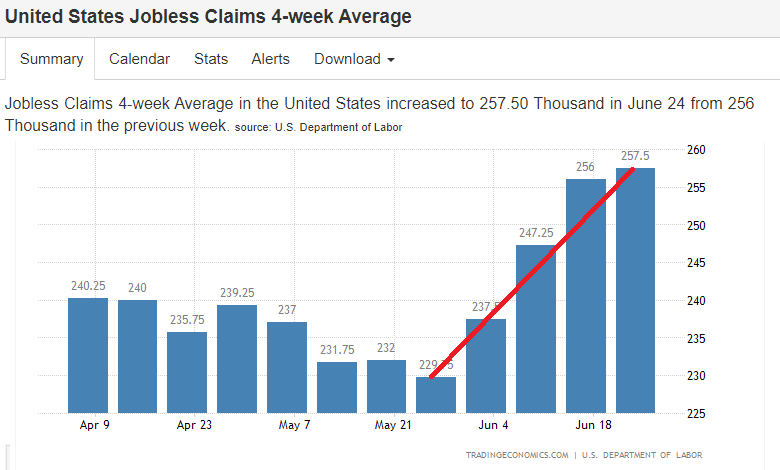
- The US Jobless Claims numbers surged this week (as we forecasted in this months video – charts below).
- Markets are not buying the hawkish dot plots from the Fed
 INFLATION BREAK-EVENS
-
- 5yr BEI +3.0bps at 2.209%,
- 10yr BEI +1.6bps at 2.246%,
- 30yr BEI +0.3bps at 2.236%.
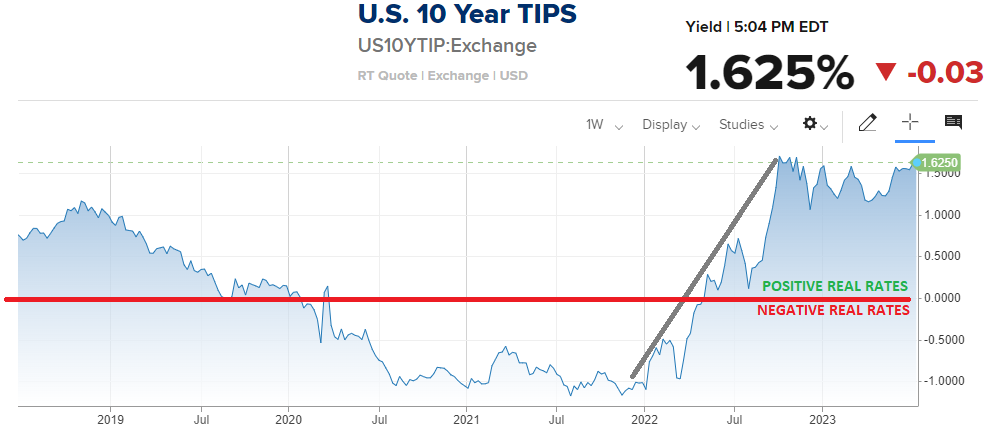
FISHER’S EQUATION
Nom = Inflation + Real Rate
Nom = 2.24 + 1.62 = 3.86%
10Y UST Closed = ~ 3.84%
CONCLUSION
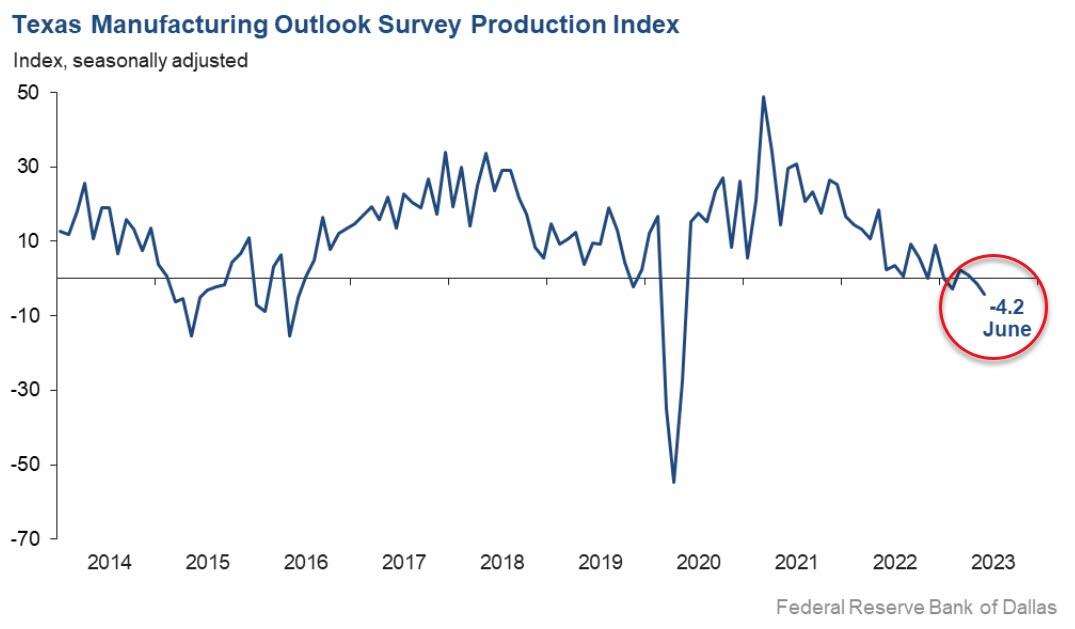 TEXAS FED MANUFACTURING SURVEY
A FOOD MANUFACTURER
Stagflation. Political incompetence is creating an unstable business environment.
COMPUTER & ELECTRONIC PRODUCT MANUFACTURER
We are starting to see a major shift in industrial production and a lack of confidence.
MACHINERY MANUFACTURER
We are living hand to mouth. The surge in orders could easily stop as quickly as it started. We’re month to month.
PLASTICS & RUBBER PRODUCTS MANUFACTURER
We service retailers. They are tentative; we are wary.
PRIMARY METAL MANUFACTURER
Incoming orders are off substantially, especially in the residential building and construction markets we produce raw material for.
Labor market measures suggest weaker employment growth and declining work hours.
Price pressures evaporated, while wage pressures remained elevated.
LAYOFFS
-
- Goldman Sachs is cutting over a hundred Managing Directors as M&A activity sours,
- Ford announced plans to lay-off hundreds of Engineers,
- UBS is slashing half of Credit Suisse’s workforce as the Bank Layoff Tsunami worsens.
EARLY EARNING WARNINGS
-
- Walgreens just slashed Earnings Guidance, blaming “Cautious Consumers.” Shares Plunged to a decade low,
- General Mills has becomes latest company to warn about “Faltering Consumers.
BANKRUPTCIES & CREDIT SPREADS
STRIKES
-
- UPS Teamsters Warn: “Nationwide Strike Imminent” If Friday Deadline Not Met
- Teamsters working for shipping giant UPS are threatening to strike on Aug. 1 if their demands for better pay and working conditions aren’t met.
- Boeing’s top supplier has Halted factory work as Union votes to strike
- Final Stand? Half A Million French Protesters have taken to the streets against Pension Reform
NO ONE BELIEVES THE FED!
DOT-PLOT CHARTS BELOW: The Fed is very clear on what they expect to do and testified as such during the Semi-Annual Humphry-Hawkins Congressional Hearings. The markets however clearly reject this and are pricing in another outcome.
But, just maybe they should believe the Fed??
A HISTORIC QUARTER!
NASDAQ SOARS TO BEST H1 IN 40 YEARS! YIELD CURVE CRASHES
TO ‘MOST INVERTED’ EVER!
Click All Charts to Enlarge
1- SITUATIONAL ANALYSIS
ONE FOR THE RECORD BOOKS!
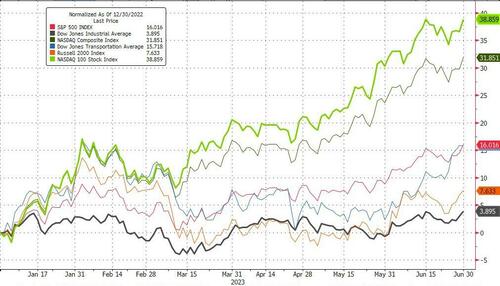 Trading going into Friday’s close was about institutions from Money Managers to Hedge Funds to Insurance / Pension Funds – all “Window Dressing’ their mid-year reports. Absolutely no one wants to be seen as having missed the run-up — and it was a run-up for the history books!
CHART RIGHT
Nasdaq led by the magnificent seven (or just AAPL) surged in H1. The Dow was H1’s laggard, up a mere 3.9%.
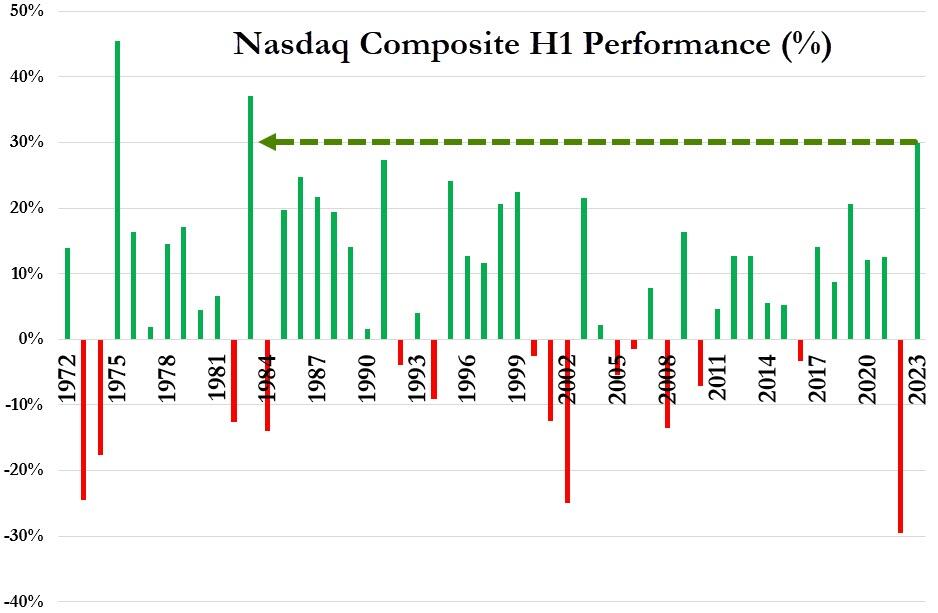
CHART RIGHT:
The Nasdaq Composite rose around 31% in the first half of 2023. This was its largest H1 gain since 1983 (outpaced only by the even more concentrated Nasdaq 100, which rose 37% – its best H1 ever).
Last year was the second worst H1 in history and this year is the 3rd best ever for the composite.
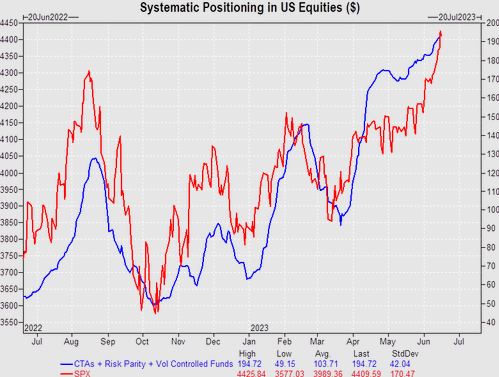
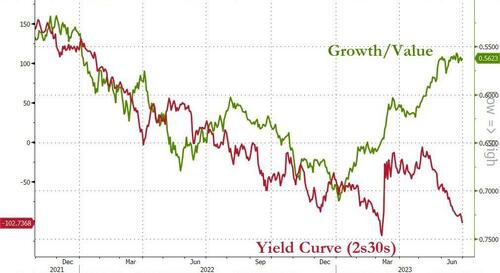 CHART RIGHT
H1 2023 saw the biggest outperformance of Growth over Value since H1 2020, completely decoupling from the yield curve.
 HOWEVER – THIS IS WHERE WE ARE NOW!
Caution is still advised even though July is historically the best month of the year for the stock market!
CHART BELOW
We’re now in the 85th percentile of periods since WWII without a 3% drawdown in the S&P 500.
This, according to Deutsche Bank translates into 73 trading days and over 3 months in real life. Due to a combination of this, positioning, and where vol currently is, Deutsche Bank thinks we’re due a 3-5% modest correction.
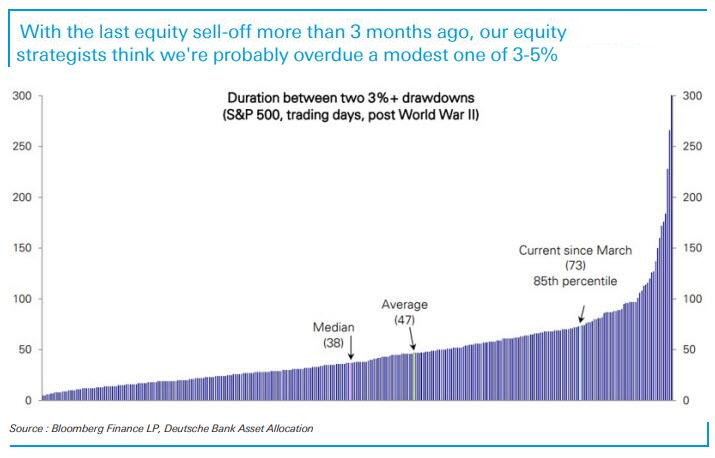
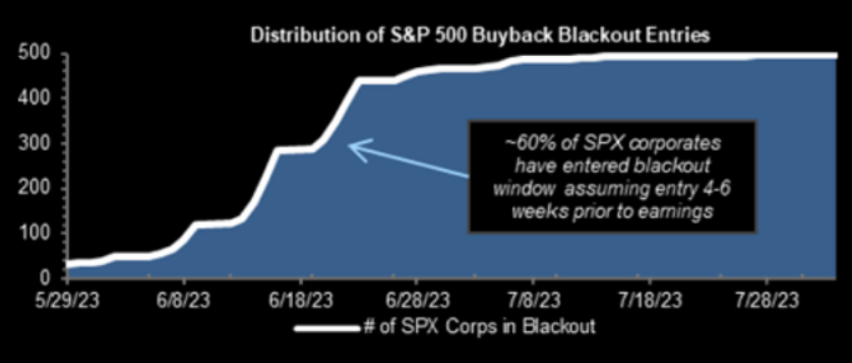
CHART BELOW:
A gentle reminder that the buyback blackout window is here. Goldman Sachs estimates that around 85% of companies are in the blackout window as of today, i.e the big VWAP bid is dormant for a few weeks.
2- TECHNICAL ANALYSIS
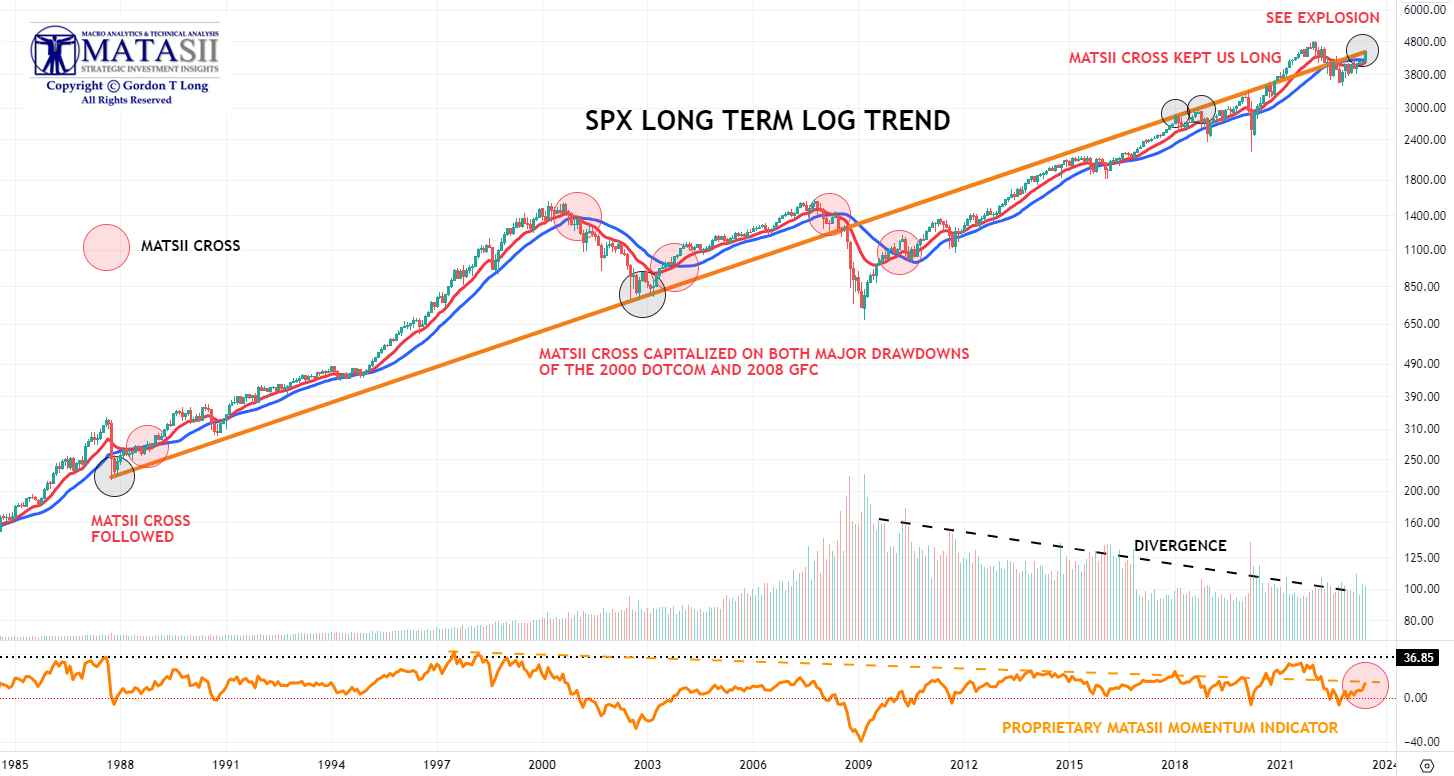
EXPLODED VIEW OF CURRENT MATASII CROSS
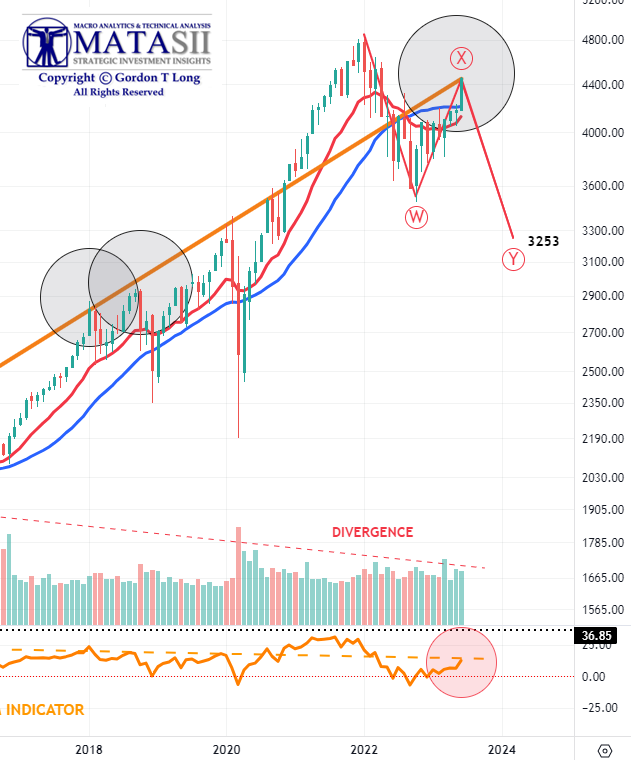
This week the S&P 500 closed on EXACTLY its long term log trend line.
The MATASII CROSS is still on a SELL and sees the “X” leg as simply a consolidation / correction in the Longer-Term secular Bear Market.
The current WXY projection AT 3253 is very close to our long held 3270 projection for this secular Bull Market!
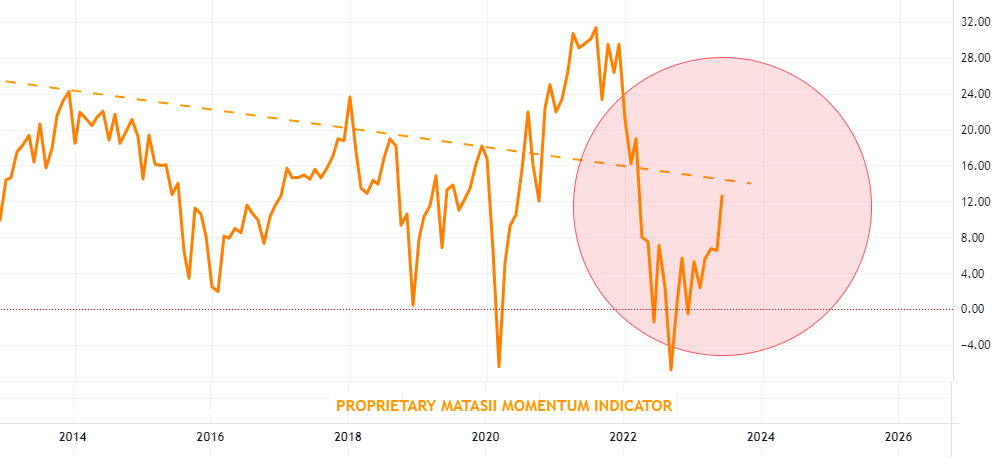 EXPLODED VIEW OF CURRENT MATASII MOMENTUM INDICATOR
There appears to be more work to be done within the strong current Momentum environment.
WHAT WE WROTE 2 WEEKS AGO w/CHART
Below are four charts we showed two weeks ago. We include both what we said then and the current chart with the MATASII CROSS replacing the prior Moving Average indicators to simplify the message of each chart.
ALL MAJOR MARKET SIGNALLING POTENTIAL MAJOR REVERSAL
Major Tops are often drawn-out and “Doomed” in appearance. This is because major reversals normally cross all major markets (Ie Equities, Currencies, Credit and Bonds) and often take time to “synchronize”.
Our current bias is that a major market top is soon to be put in, because we see reversal patterns across most major markets both in the US and Globally. This is rare!
However, this doesn’t mean that a market high will necessarily immediately result in a market drop. Markets can still remain elevated for a period of time before something triggers a major drop. We don’t believe the market is quite ready for a major capitulation lower. That may be later in Q3?
WHAT WE WROTE 2 WEEKS AGO w/CHART
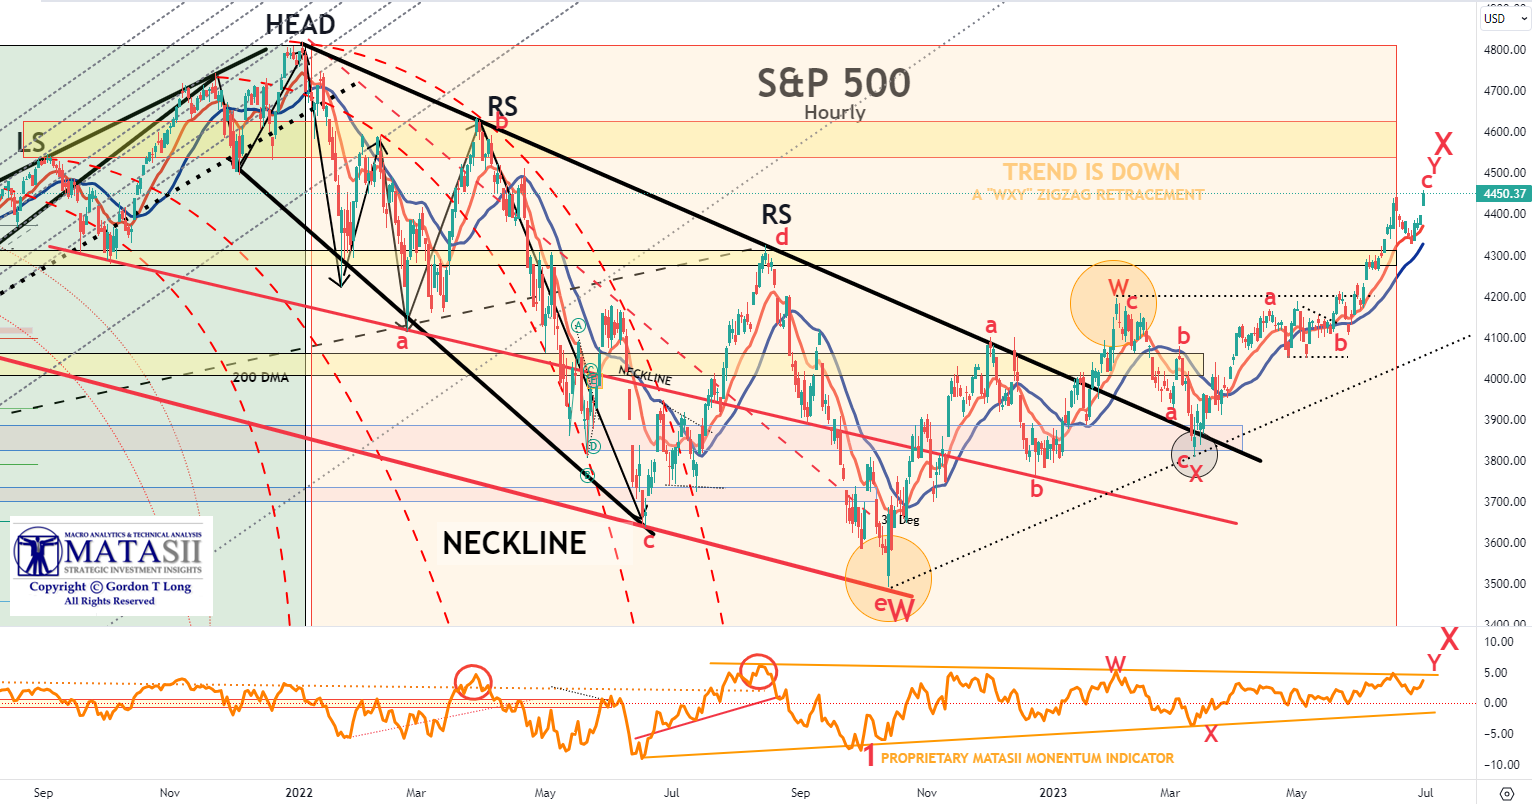
S&P 500 – MAJOR “X”LEG NEARING ENDING
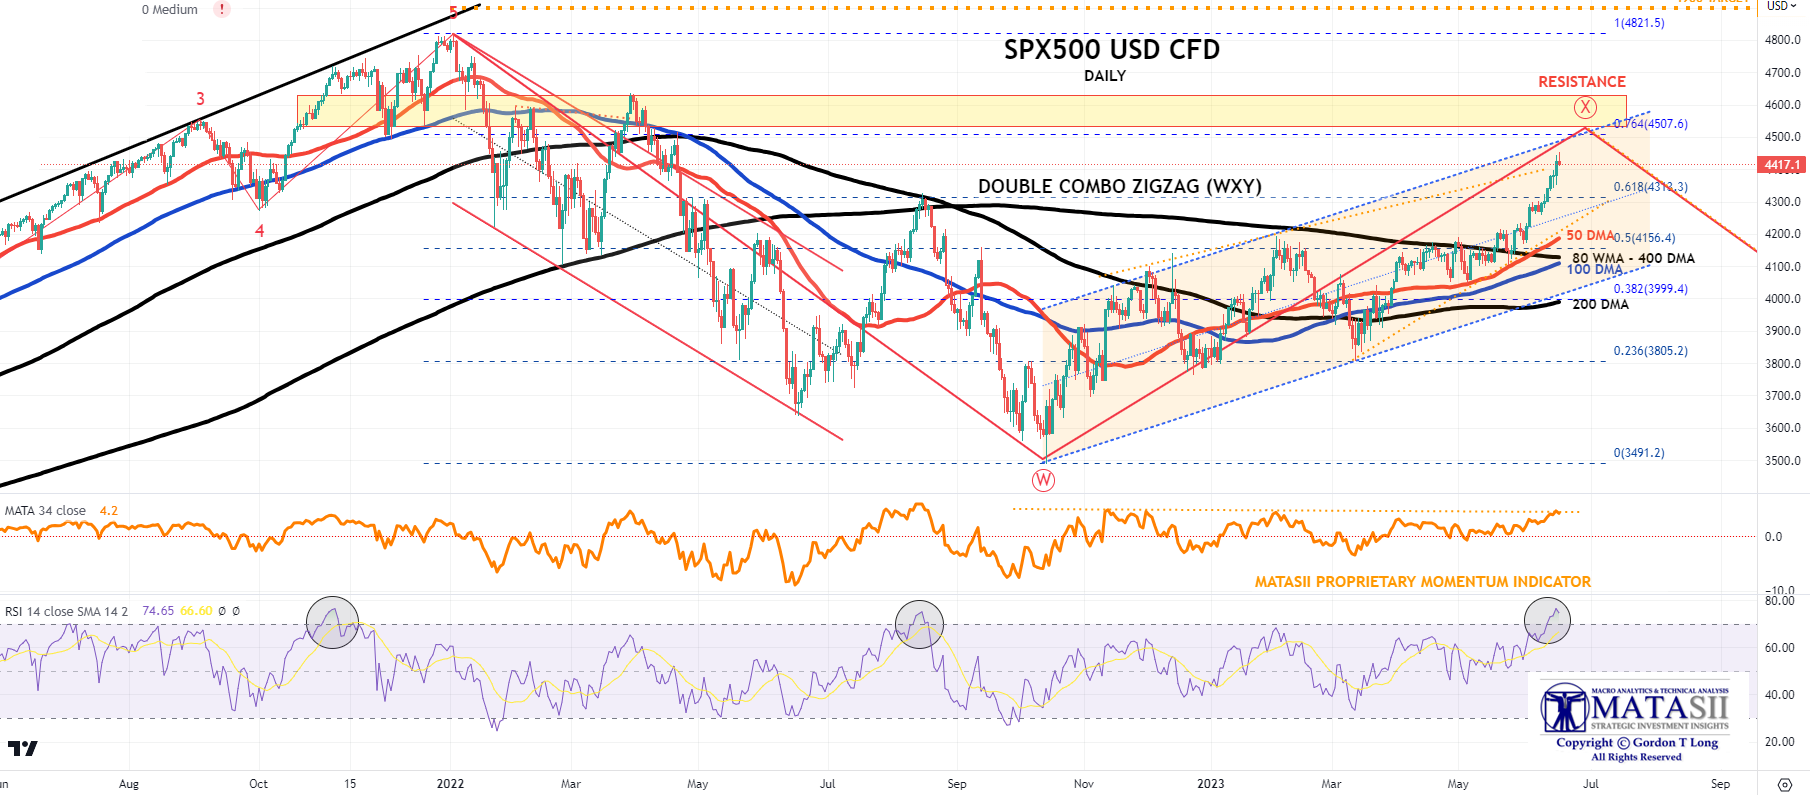 We believe we are very near the completion of the “X” leg of a classic Double Combo ZigZag pattern before the “Y” leg down occurs (normally equals the “W” length in time and price).
Our Long Term S&P 500 Head & Shoulders pattern also appears to support both the initial Fibonacci Cluster Window as part of the “choppy ending diagonal pattern” exhibited, and the June Quadruple Witch turn. Remember the Fibonacci Cluster Window is between June 16th and June 30th.
YOUR DESK TOP / TABLET / PHONE ANNOTATED CHART
Macro Analytics Chart Above: SUBSCRIBER LINK
CLOSE AS OF END-OF-QUARTER FRIDAY 06/30/23
 WHAT WE WROTE 2 WEEKS AGO w/CHART
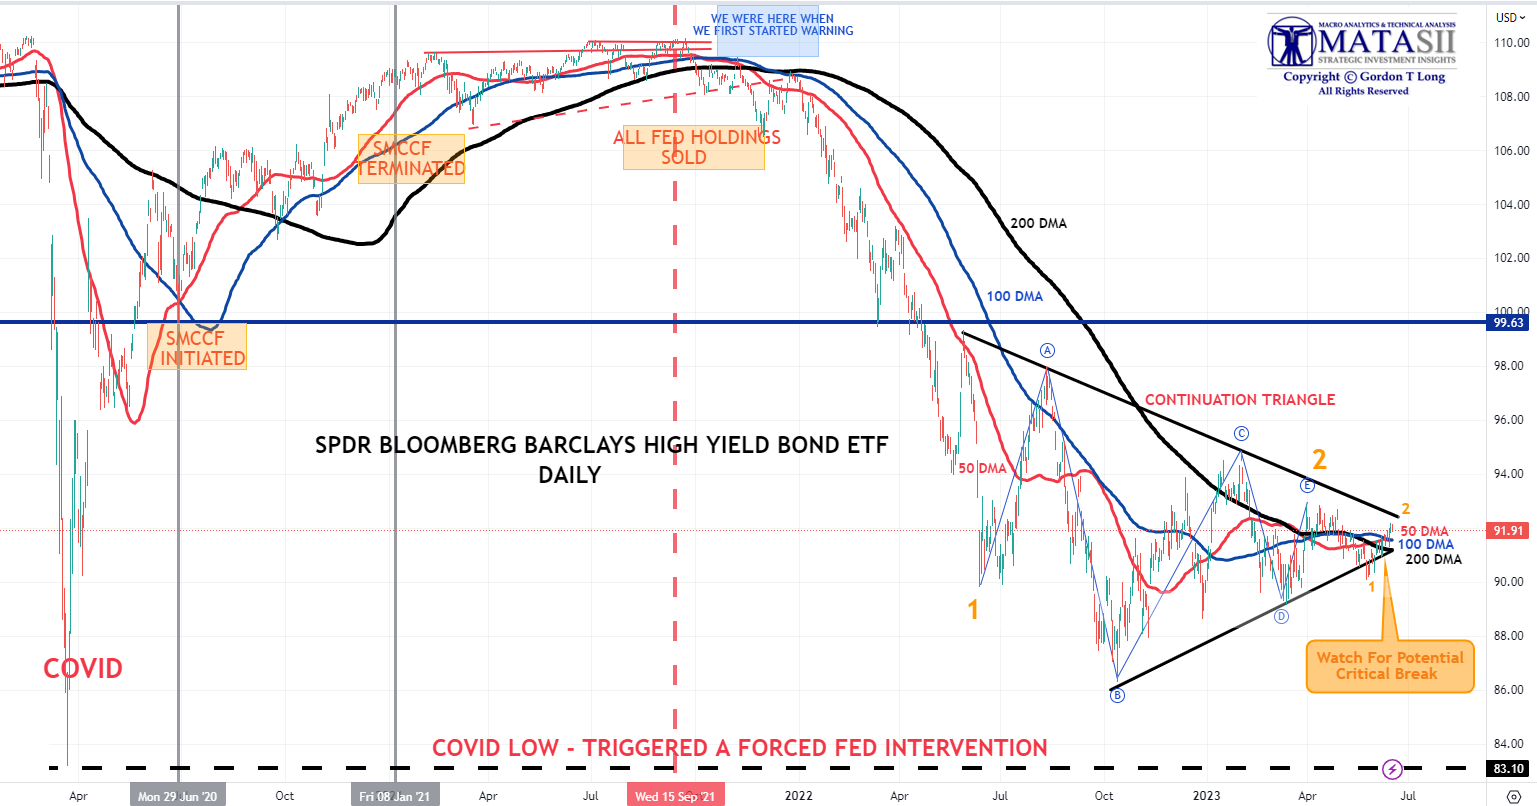
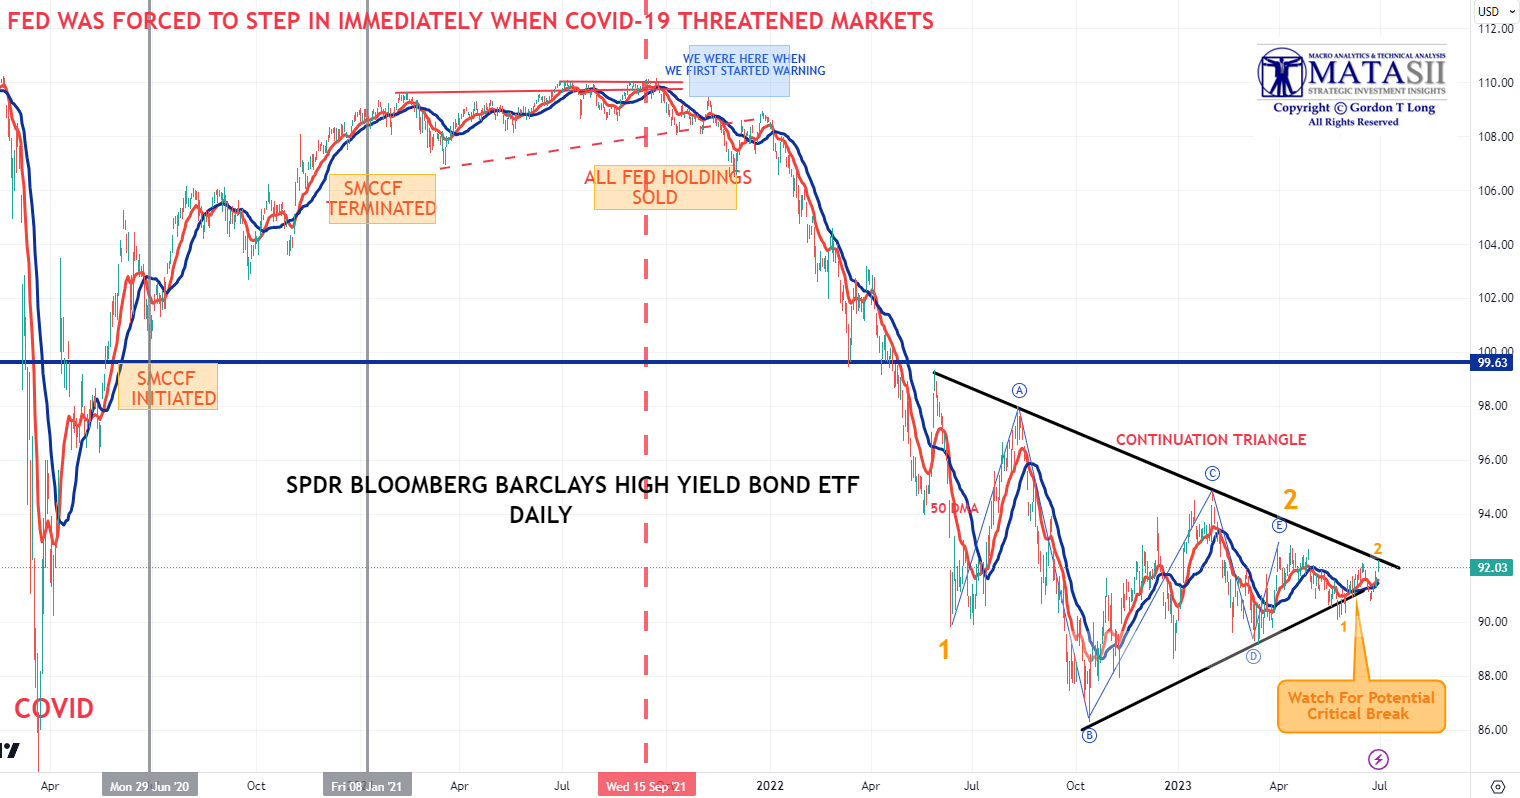
CREDIT – “JNK”
The consolidation pattern in the HY Corporate Bond Market appears to be nearing completion before heading lower in its’next major leg down. This leg will be leg “3” (labeled in red) and is normally the largest leg and often 1.618 of leg “1” in price.
YOUR DESK TOP / TABLET / PHONE ANNOTATED CHART
Macro Analytics Chart Above: SUBSCRIBER LINK
CLOSE AS OF END-OF-QUARTER FRIDAY 06/30/23
JNK jumped to exactly the upper continuation consolidation triangle trend line. We had previously identified this point as an expected smaller degree “2”.
 WHAT WE WROTE 2 WEEKS AGO w/CHART
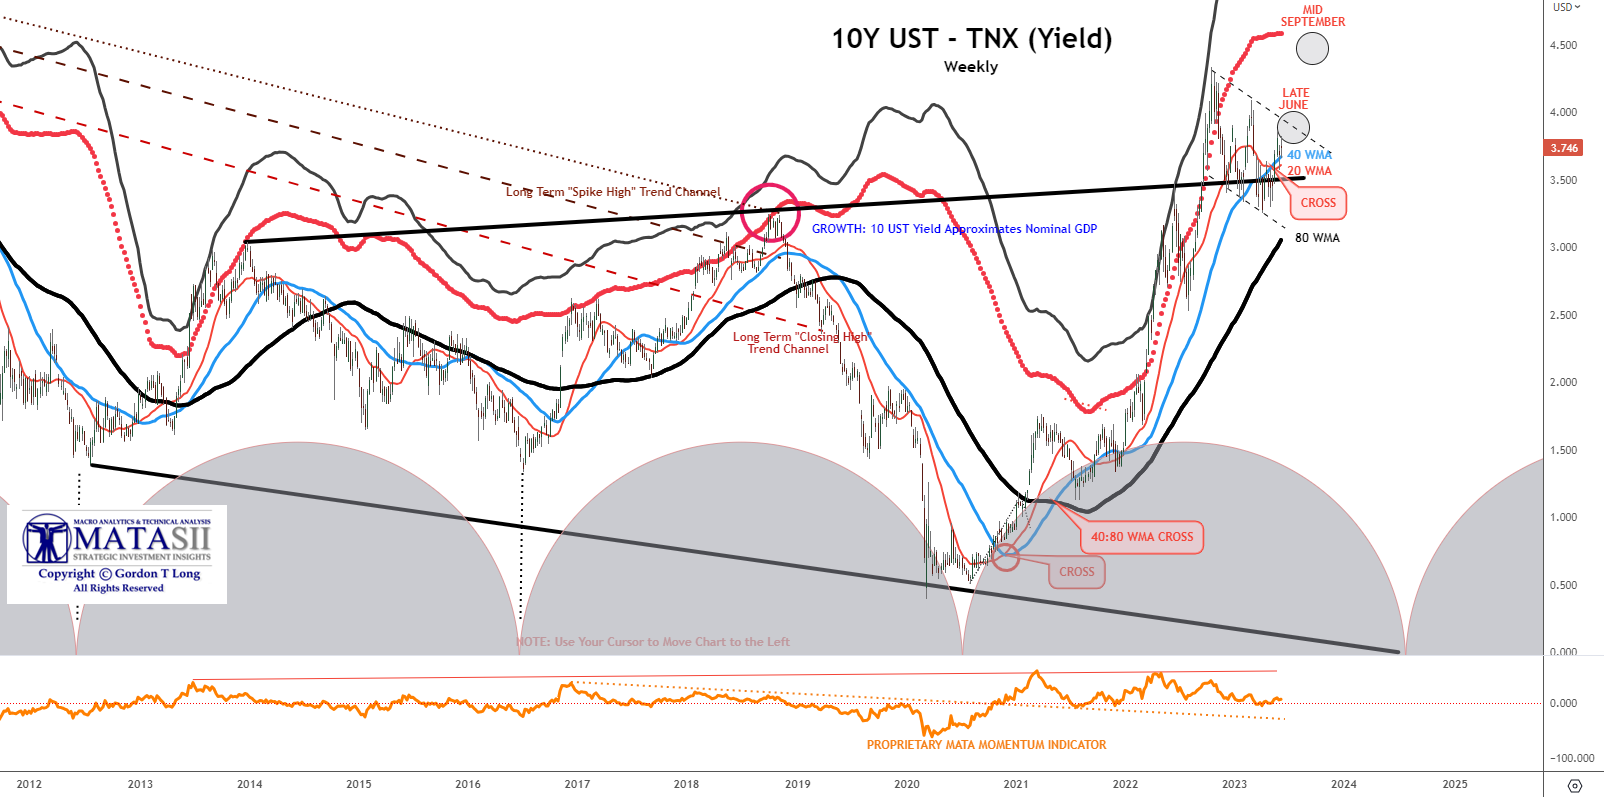
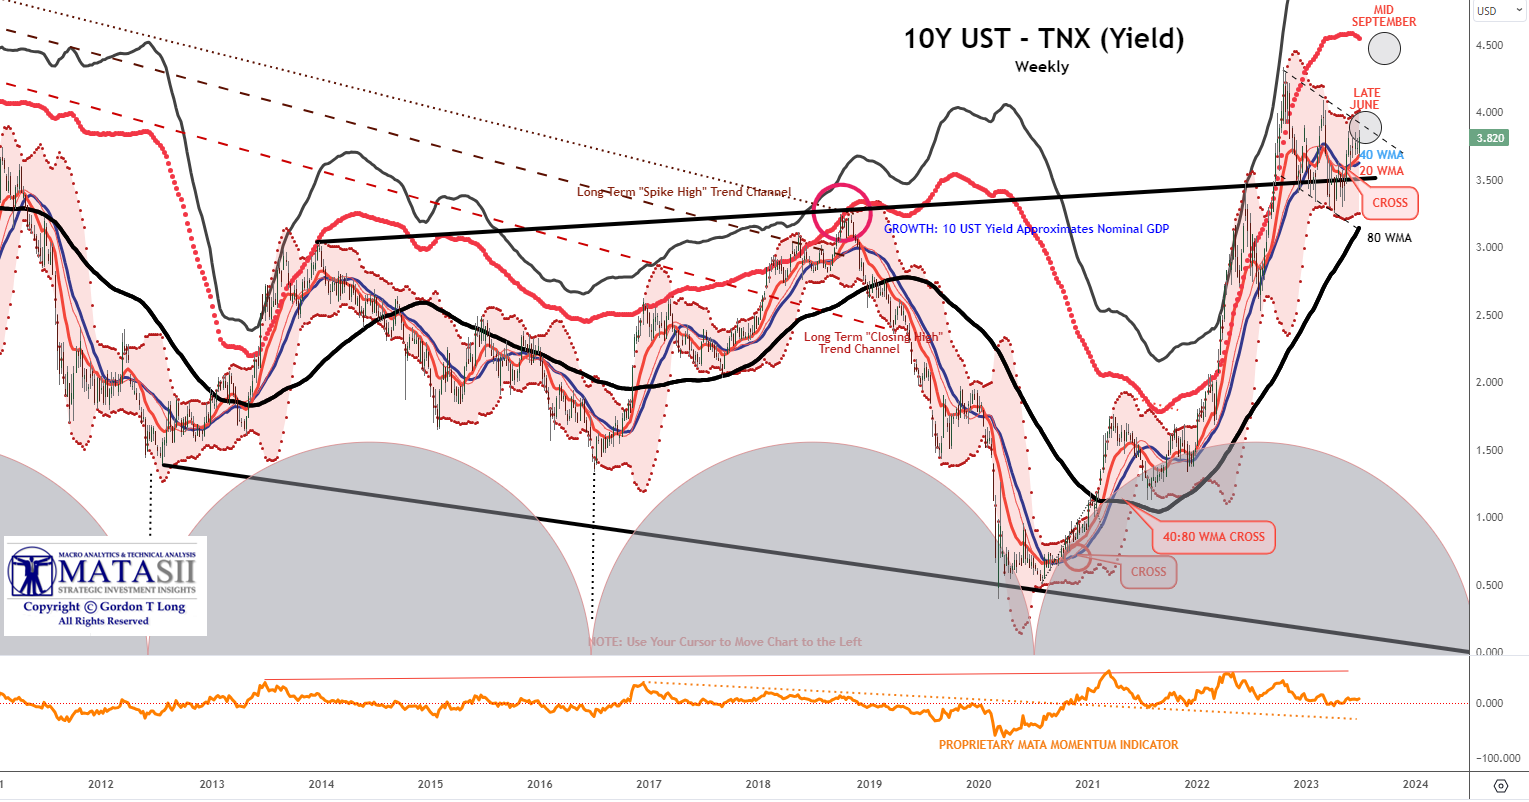
10Y UST YIELD – “TNX”
As we pointed out in last week’s Newsletter, we see the potential for further increases in the 10Y UST Yield (a fall in price) before an Intermediate Term top in in place.
YOUR DESK TOP / TABLET / PHONE ANNOTATED CHART
Macro Analytics Chart Above: SUBSCRIBER LINK
CLOSE AS OF END-OF-QUARTER FRIDAY 06/30/23
The action this week in the US Treasury market pushed our MATASII CROSS indicator to a BUY (Yield) as per our prior expectations. Price rose to inside our predetermined “circle” as indicated on both charts.
 WHAT WE WROTE 2 WEEKS AGO w/CHART
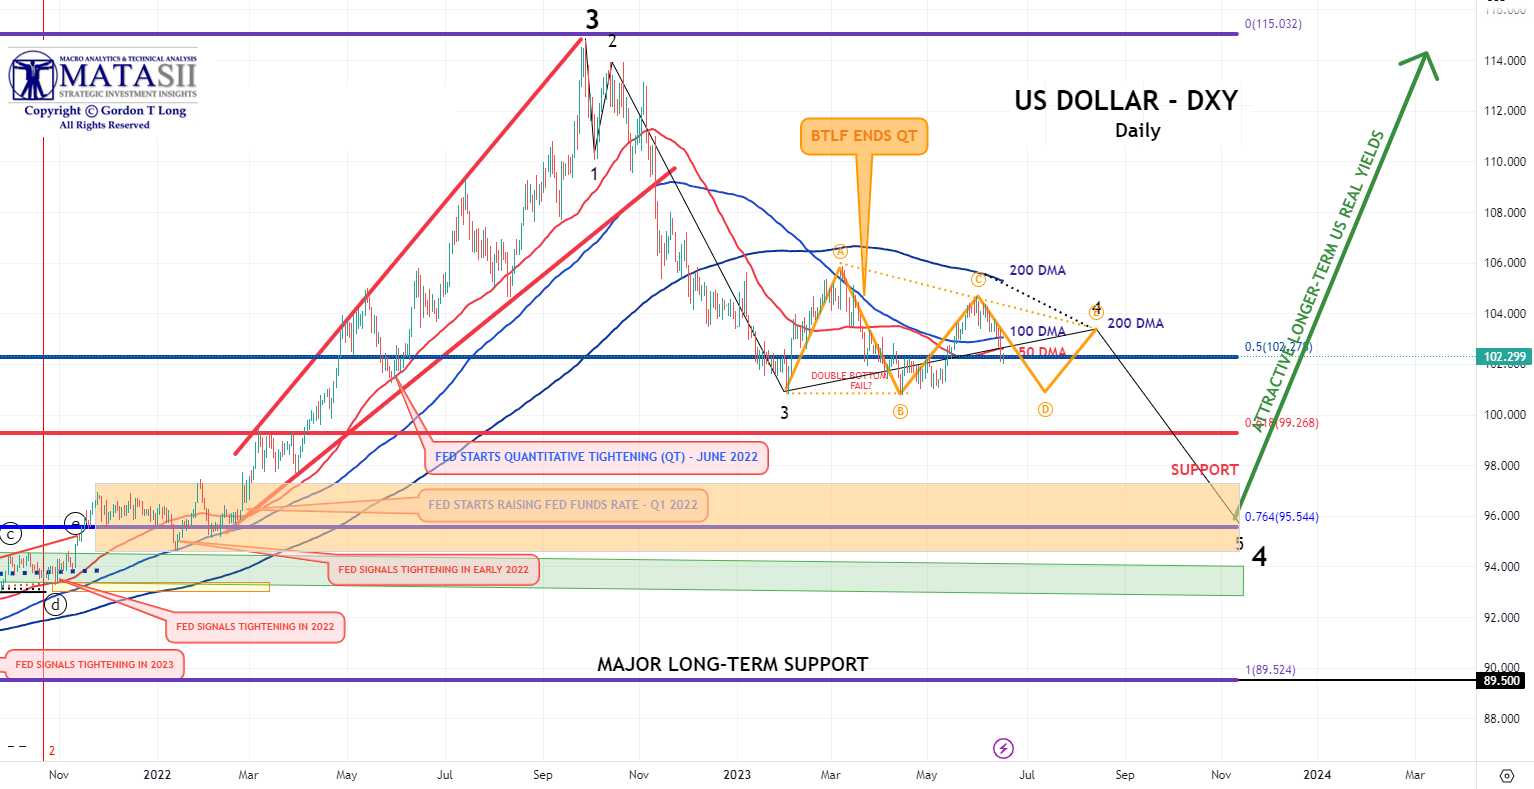
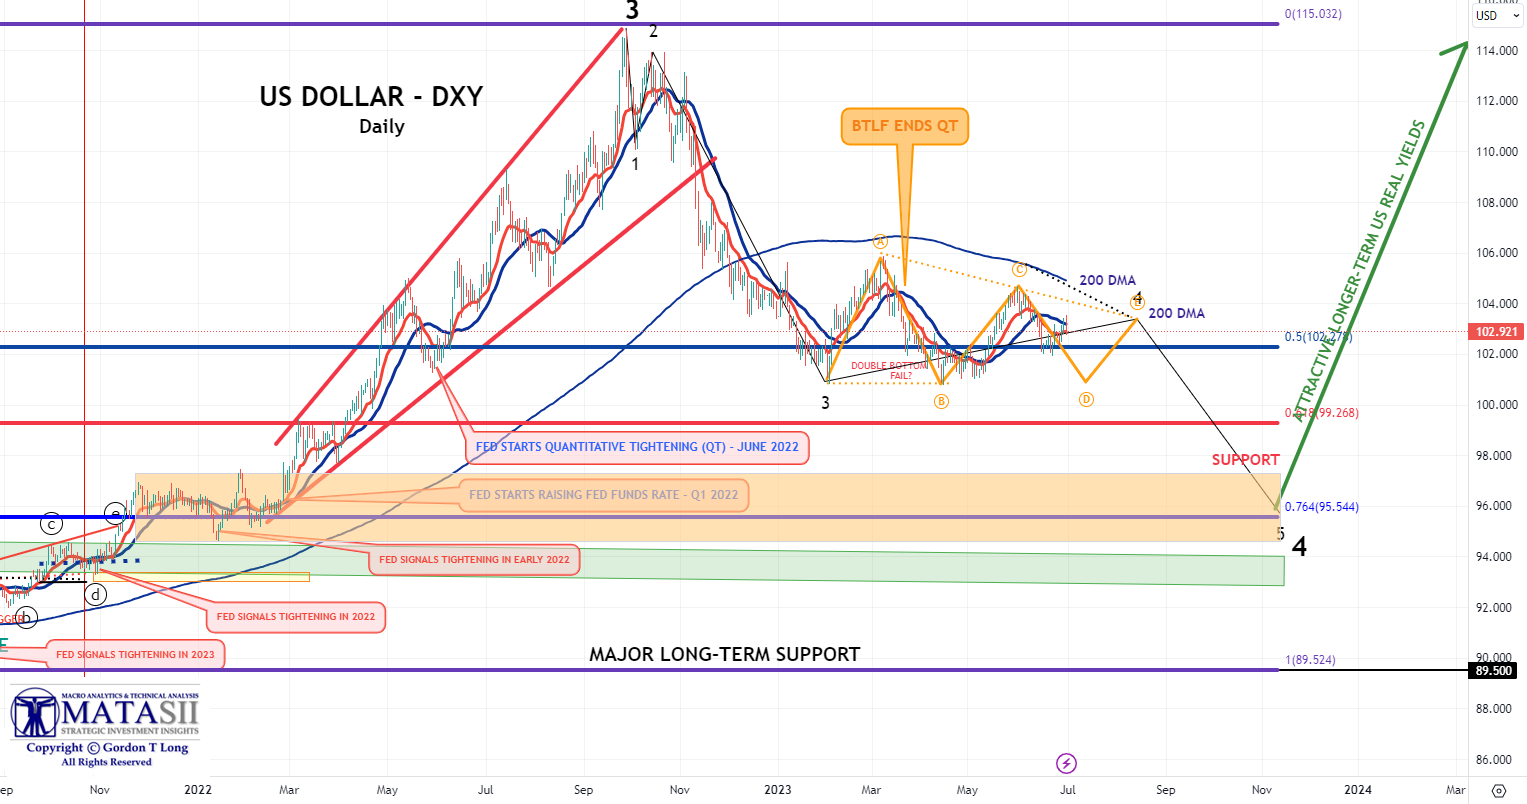
US DOLLAR – “DXY”
The US Dollar appears to need more time for the 10Y UST Yield to reach a near term high before the dollar starts to weaken on US Treasuries not being as attractive and the pressure of the US Treasury’s $1.5T post Debt Ceiling TGA build hitting the market and pressuring prices down (and yields up)!
YOUR DESK TOP / TABLET / PHONE ANNOTATED CHART
Macro Analytics Chart Above: SUBSCRIBER LINK
CLOSE AS OF END-OF-QUARTER FRIDAY 06/30/23
The DXY has weakened as expected. The MATASII CROSS has moved to a NEAR TERM SELL.
FAIR USE NOTICE This site contains copyrighted material the use of which has not always been specifically authorized by the copyright owner. We are making such material available in our efforts to advance understanding of environmental, political, human rights, economic, democracy, scientific, and social justice issues, etc. We believe this constitutes a ‘fair use’ of any such copyrighted material as provided for in section 107 of the US Copyright Law. In accordance with Title 17 U.S.C. Section 107, the material on this site is distributed without profit to those who have expressed a prior interest in receiving the included information for research and educational purposes. If you wish to use copyrighted material from this site for purposes of your own that go beyond ‘fair use’, you must obtain permission from the copyright owner.
NOTICE Information on these pages contains forward-looking statements that involve risks and uncertainties. Markets and instruments profiled on this page are for informational purposes only and should not in any way come across as a recommendation to buy or sell in these assets. You should do your own thorough research before making any investment decisions. MATASII.com does not in any way guarantee that this information is free from mistakes, errors, or material misstatements. It also does not guarantee that this information is of a timely nature. Investing in Open Markets involves a great deal of risk, including the loss of all or a portion of your investment, as well as emotional distress. All risks, losses and costs associated with investing, including total loss of principal, are your responsibility.