Gordon T Long
Global Macro Research | Macro-Technical Analysis
GLOBAL MACRO
ECONOMICS
ARE WE THERE YET??
We believe eventually a Recession in the US will be officially labeled as beginning in Q3 2023. We expect current weakening economic conditions to accelerate in Q3 and to take us into negative GDP growth. This week’s LEI, PMI & Initial Jobless claims solidified our position.
The recession has been delayed from what many were expecting as early as Q4 2022. If fact this is inline with what the EU officially announced last week as their current recession having begun in Q4 2022. What was the cause of the US delay?
Two primary factors:
-
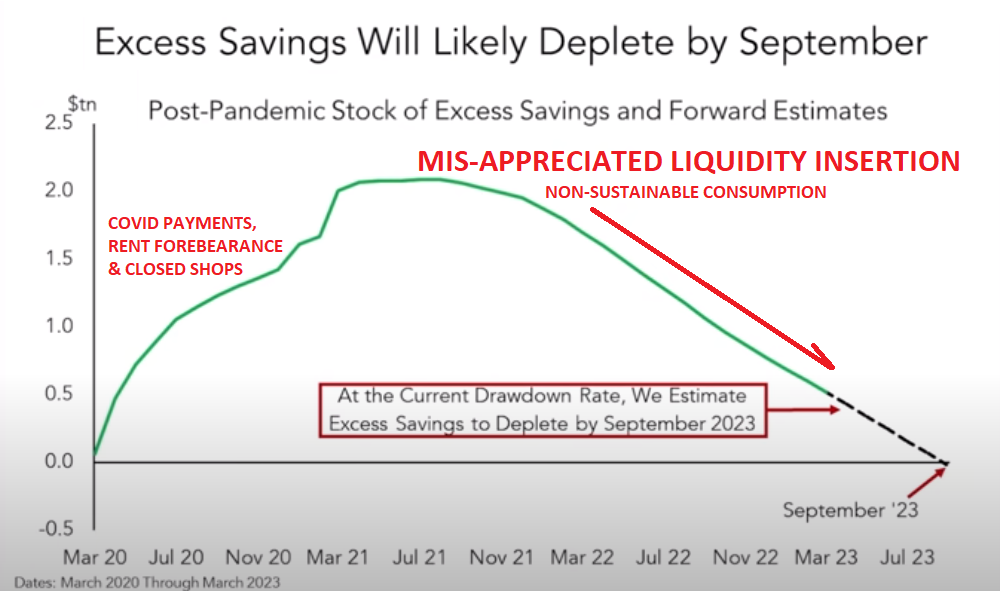
- Consumption fostered by the depletion of Personal Savings resulting from Covid Payments, various Forebearance Programs and limited ability to shop due to Covid lockdowns.
- A Strong Labor market and surging wages due to labor shortages resulting from Supply Chain disruptions associated from Covid lockdowns.
Those factors are now mostly behind us as we will discuss in this newsletter.
When we couple this with “The Bullwhip Effect”, previously outlined in last week’s newsletter, we feel the evidence is fairly convincing. We have most fundamentally moved from “Shortages to Gluts” now creating dis-inflation and weakening labor markets.
Don’t expect the markets to sell off immediately. Major tops are a process and take time. This is a secular event – not a normal business cycle occurance.
WHAT YOU NEED TO KNOW
LEADING ECONOMIC INDICATOR (LEI): US Economy to Contract over Q3 2023 to Q1 2024
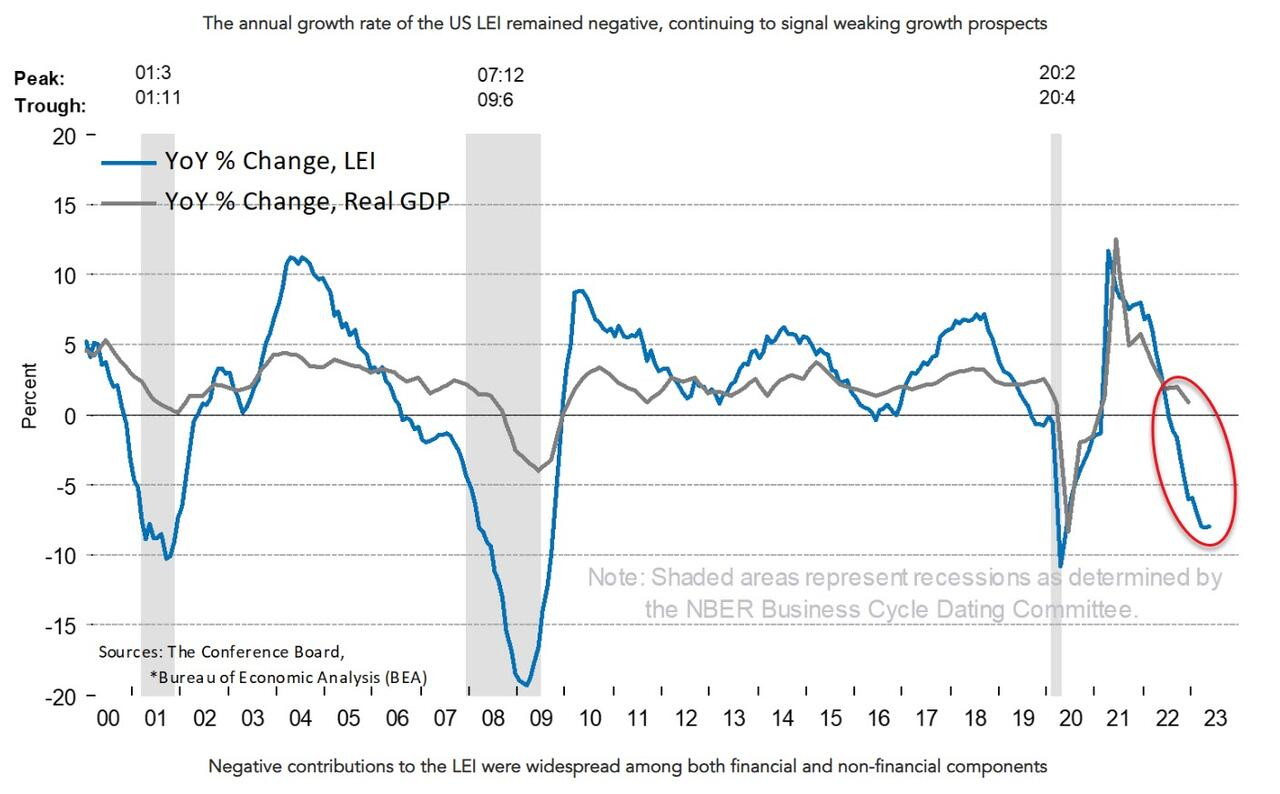 “The US Leading Index has declined in each of the last fourteen months and continues to point to weaker economic activity ahead. Rising interest rates paired with persistent inflation will continue to further dampen economic activity. While we revised our Q2 GDP forecast from negative to slight growth, we project that the US economy will contract over the Q3 2023 to Q1 2024 period. The recession likely will be due to continued tightness in monetary policy and lower government spending.”
Justyna Zabinska-La Monica, Senior Manager, Business Cycle Indicators, The Conference Board.
WHAT DELAYED THE RECESSION? – Covid Driven Personal Savings + An Employment Squeeze
-
- The recession has been delayed through the first half 2023 due to two fundamental reasons directly associated with Covid Policy initiatives (as mentioned above):
-
-
- Depletion of Personal Savings,
- A Strong Labor market and surging wages.
-
CENTRAL BANK RATE ACTIONS – Continues to Crimp Demand & China’s Re-Opening
-
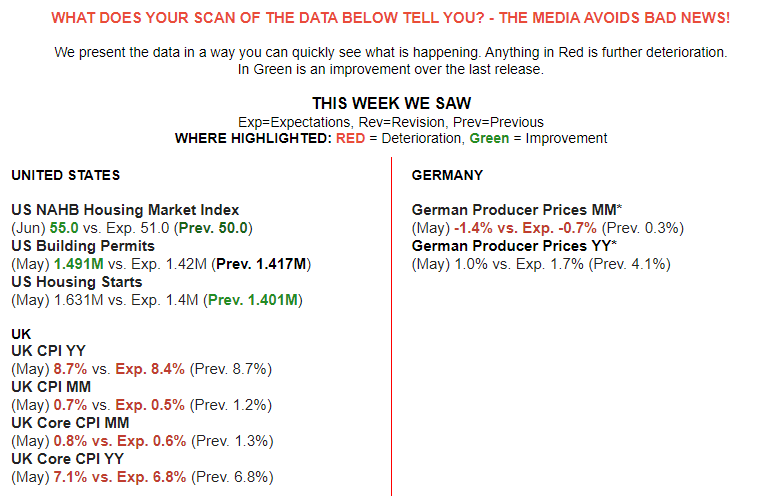
- The Bank of England shocked the market with a 50 bps Rate hike to 5%, the 13th consecutive rate hike of the current cycle and the highest level since 2008. This was in reaction to what can only be termed red hot inflation with CPI at 8.7% Y-o-Y and core CPI at a 31 year high.
- Powell testified before Congress in the Semi-Annual Humphrey-Hawkins Report that he expects more Fed rate hikes ahead as inflation fight “has a long way to go”.
- The views of the entire policy voting Governors of the Federal Reserve clearly show stagflation is ahead with expected slow growth, elevated inflation, higher Fed Funds Rates and a low end chance of achieving the Fed’s stated goal of 2% inflation before 2025.
CHINA DISAPPOINTS – Will Not Soon Come To The Aid of the Global Economy
-
- The Asian giant’s revival is faltering! In the past week, economists at Goldman Sachs, HSBC, Citi and Nomura are among those to have revised their China GDP growth forecasts lower for 2023, doubting that stimulus from Beijing could turn the tide.
- “Expectations have been too high about what China will be able to do on stimulus, as the Chinese government is more constrained compared to previous cycles relative to kick-starting the economy through just cutting interest rates or lowering reserve requirements for banks”
- Chinese banks disappointed the market with a relatively modest reduction in lending rates, with potential catalysts including the Blinken-Xi meeting and China’s State Council meeting largely turning out to be non-events for investors.
FINANCING OUR DEBT – A Falling Standard of Living & Producitivity
-
- Not only is US Productivity falling along with the number of new Patents filed, but that US global competitiveness is rapidly falling. This has fallen globally from first to nineth since the Dotcom Bubble implosion.
- This additonally adds to the overall pressures the US will continue to experience in financing its massive growing government debt.
- Since 2021 the plummetting US Real Disposable Income is destroying the US Standard of living for the middle and lower income class.
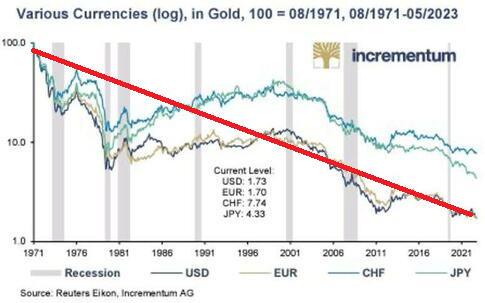
- Since 1971, when the US came off the Gold Standard and adopted a “Fiat Currency”, the US standard of living has also fallen in a stealth fashion, because of the deteriorating real value of the US Dollar (denomiated in real assets).
CONCLUSION
 A “SHORTAGE TO GLUTS” FALLOUT?
-
- The change from shortages to gluts in the global market for goods that took place in mid-2022 may now be shifting to the global labor market of 2023.
- Company communications on earnings calls and shareholder presentations reveal a rising trend of mentions of job cuts (including phrases like reduction in force, layoffs, headcount reduction, employees furloughed, downsizing, personnel reductions) along with a falling trend in mentions of labor shortages, (including phrases like labor shortages, inability to hire, difficulty in hiring, struggling to fill positions, driver shortages).
AS WE BELIEVE AND HAVE BEEN STRESSING,
A RISING TREND INITIAL JOBLESS CLAIMS IS YOUR RECESSION TRIGGER!
WHAT DELAYED THE RECESSION? – Covid Consumer Savings + An Employment Squeeze
 UNDERSTANDING THE DELAY
The recession has been delayed through the first half of 2023 due to two fundamental reasons:
-
- Consumption fostered by the depletion of Personal Savings resulting from Covid Payments, various Forebearance Programs and limited ability to shop due to Covid lockdowns.
- A Strong Labor market and surging wages due to labor shortages resulting from Supply Chain disruptions associated from Covid lockdowns.
 WHAT IS OCCURRING NOW!
The above drivers of the recession delay have run their course. What we are now witnessing is the early emergence of the actual Recession, which we believe will be officially labeled as having occurred in the upcoming third quarter:
-
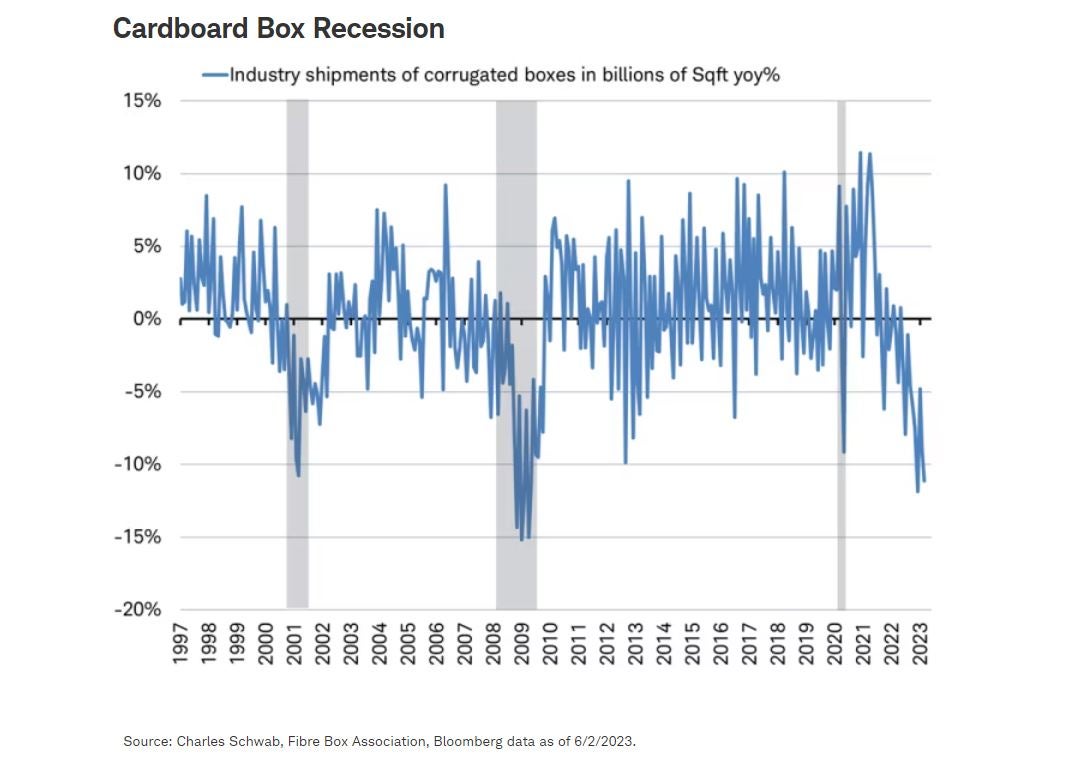
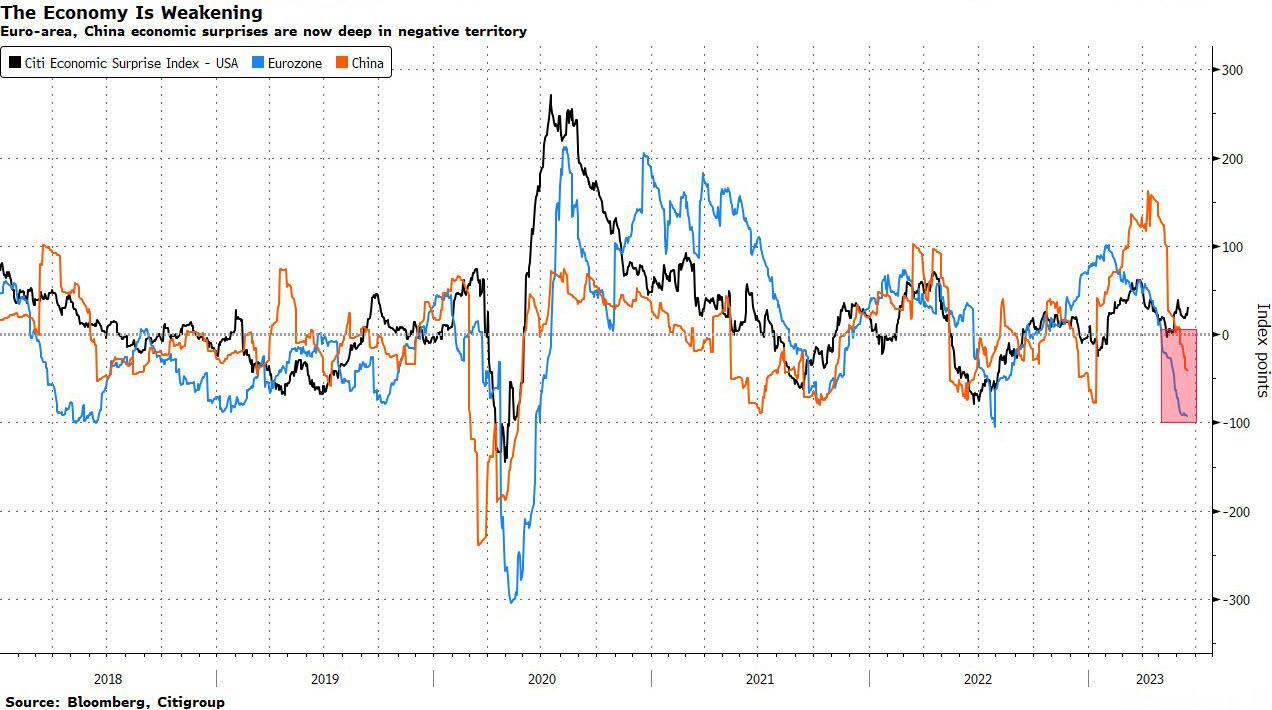
- CANARIES in the Coal Mine are appearing as in a dramtically slowing chemical industry and a Cardboard Box Packaging recession.
- PMIs have been falling but this week shows the industrial slowdown is taking Services with it (US Graphic, EU Graphic).
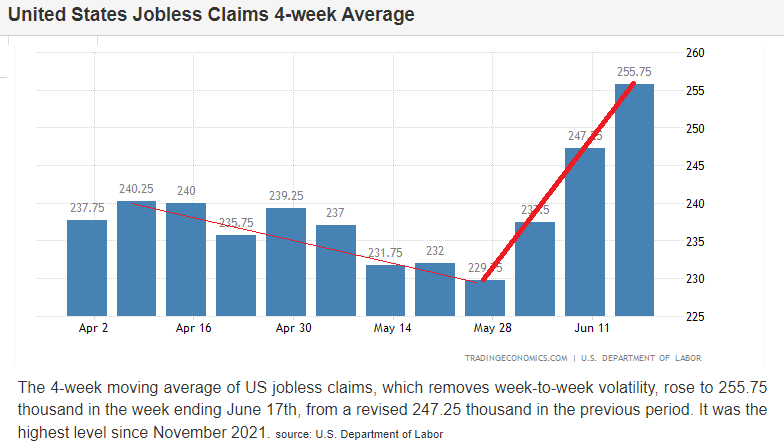
- UNEMPLOYMENT is now accelerating as we see with this week’s Initial Jobs Claims.
CENTRAL BANK RATE ACTIONS – Continues to Crimp Demand & China’s Re-Opening
 Year-to-date, G10 central banks have delivered 21 rate hikes and tightened by a total of 725 bps. That compares with 54 rate hikes in the whole of 2022 and 2,700 bps of rate hikes.
This week we witnessed the following unexpected central bank actions:
-
- The Bank of England shocked the market with a 50 bps Rate hike to 5%, the 13th consecutive rate hike of the current cycle and the highest level since 2008. This was in reaction to what can only be termed red hot inflation with CPI at 8.7% Y-o-Y and core CPI at a 31 year high.
- The Norges Bank’s Monetary Policy Committee voted unanimously to raise the policy rate by 50bp to 3.75%, above consensus and market expectations, stepping up the hiking pace again compared with their prior hikes this year. The Committee guided that “if developments turn out as we now expect, the policy rate will be raised further in August”.
- The Swiss National Bank (SNB) hiked the policy rate by 25bp to 1.75% today, in line with consensus expectations. The SNB revised down its 2023 conditional inflation forecast markedly, but revised up the 2024 and 2025 inflation rates on the back of second-round effects, imported inflation, rent and electricity prices.
- Meanwhile, emerging markets were slightly further advanced in the cycle with some central banks changing tack to easing mode.
Federal Reserve Chairman Jerome Powell was extremely clear in his testimony before Congress in the semi- annual Humphrey-Hawkins Testimony (see 72 page detailed report) that he sees:
-
- The Inflation fight has a long way yet to go.
- The recent pause in rate increases was only to give monetary policy time to catch up since it lags significantly. The increases have been so large and rapid that the Fed is not sure about their effect.
- Further increases are likely.
The graphic below reflects the views of the entire policy voting Governors of the Federal Reserve. Their views clearly show stagflation is ahead with expected slow growth, elevated inflation, higher Fed Funds Rates and a low end chance of achieving the Fed’s stated goal of 2% inflation before 2025 (as calculated by the Personal Consumption Expenditure(PCE) measure.
CHINA DISAPPOINTS – Will Not Soon Come To The Aid of the Global Economy
 The Asian giant’s revival is faltering!
In the past week, economists at Goldman Sachs, HSBC, Citi and Nomura are among those to have revised their China GDP growth forecasts lower for 2023, doubting that stimulus from Beijing could turn the tide.
“Expectations have been too high about what China will be able to do on stimulus, as the Chinese government is more constrained compared to previous cycles relative to kick-starting the economy through just cutting interest rates or lowering reserve requirements for banks.”
Peter Garnry, head of equity strategy at Saxo Bank A/S
Chinese banks disappointed the market with a relatively modest reduction in lending rates, with potential catalysts, including the Blinken-Xi meeting and China’s State Council meeting, largely turning out to be non-events for investors.
What everyone continues to speculate on is “whether policymakers can deliver on their promises in the coming months to boost growth and earnings expectations”.
Ben Luk, senior multi-asset strategist at State Street Global Markets
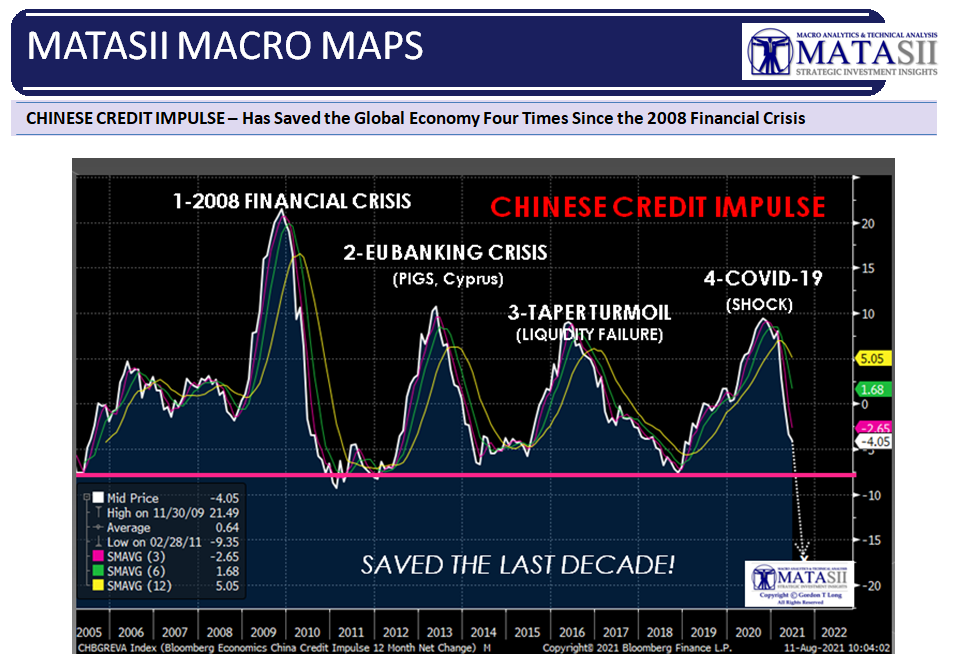
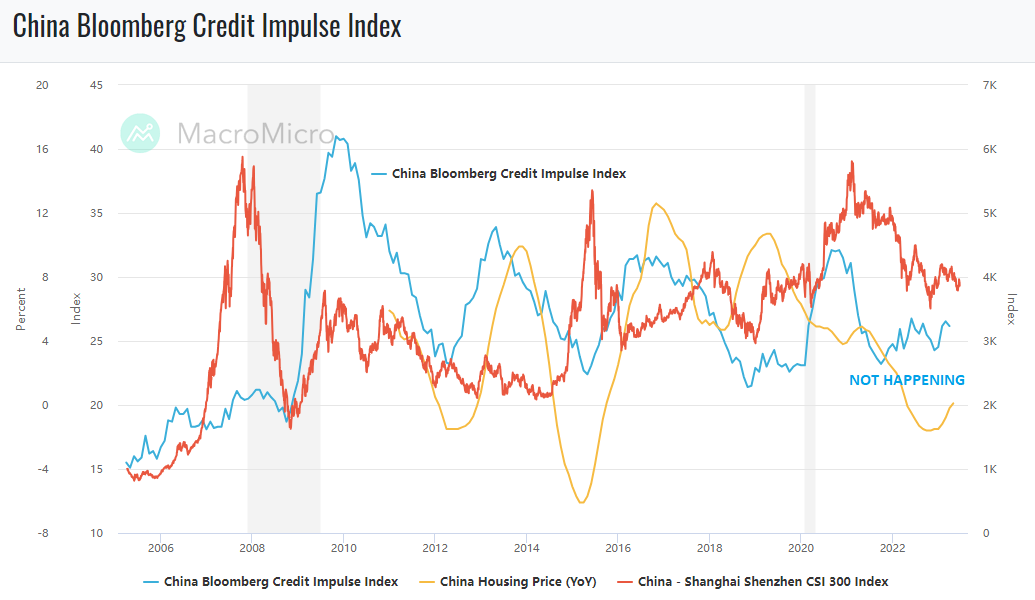
The Chinese Impulse has “saved’ the global economy from downturns on four separate occassions since the 2008 GFC – Will it do it again?
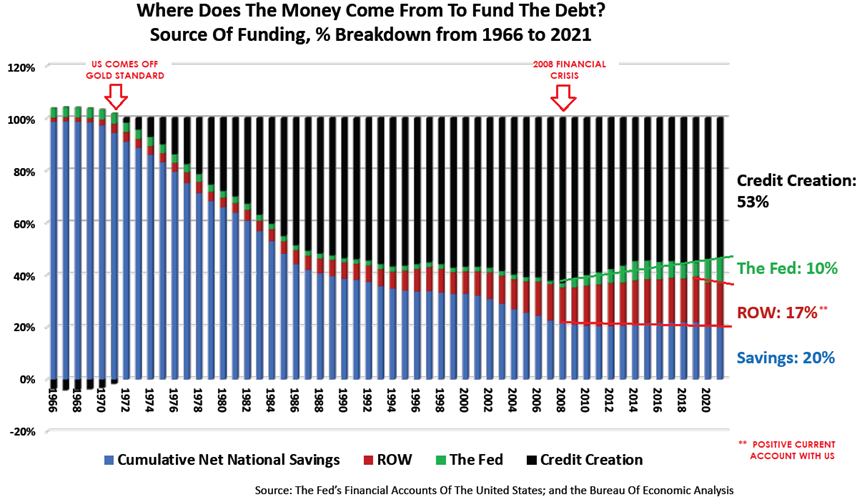
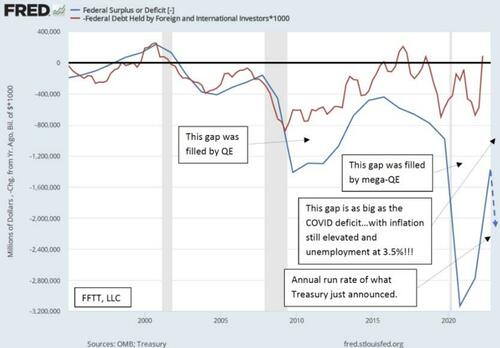
The situation for the US is more perilous than ever, since governmenrt debt financing by foreigners has been falling (RED section above). This must be reversed or the Fed balance Sheet will have to be dramatically increased!
FINANCING OUR DEBT – A Falling Standard of Living & Productivity
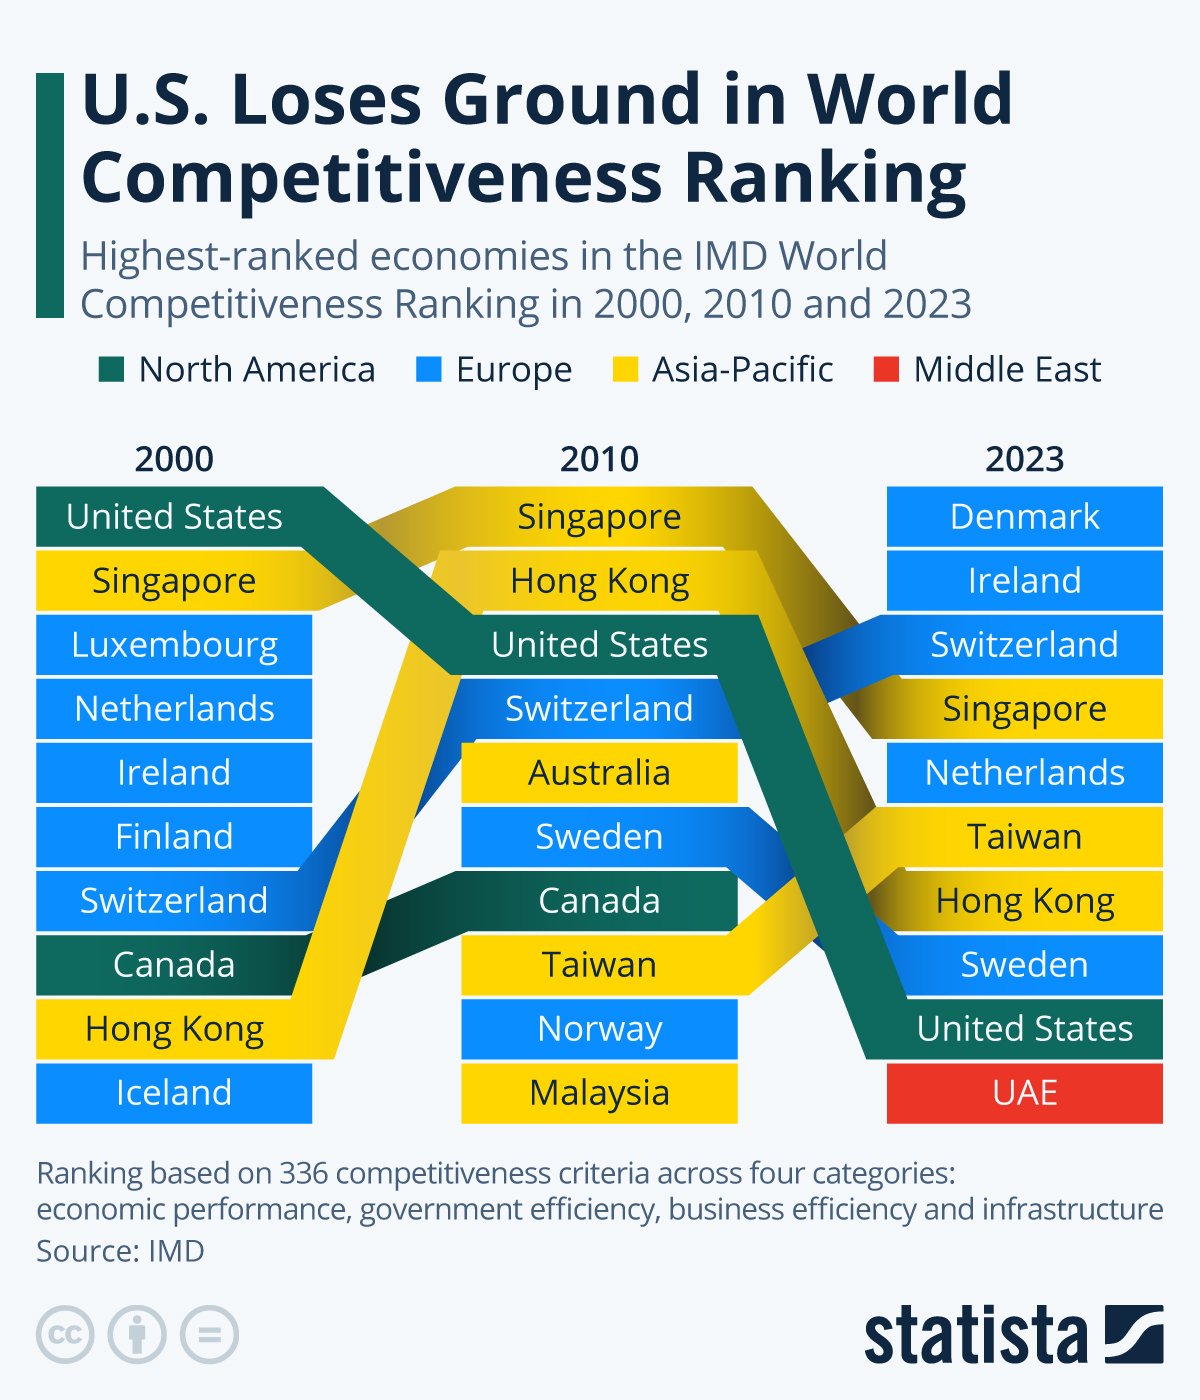 Not only is US Productivity falling along with the number of new Patents filed, but we see to the right that US global competitiveness is also.
This additonally adds to the overall pressures the US will continue to experience in financing its massive growing government debt.
As Matthew Piepenburg at GoldSwitzerland.com states:
Since 2014, it has become harder to export Uncle Sam’s inflation (or launder its debt burdens) by expecting other nations to simply absorb his increasingly unwanted USTs and openly embarrassing bar tab.
As the following graph provided by Luke Gromen makes “clear, all too clear,” the gap between Uncle Sam’s embarrassing deficit (blue line) and the meek level of foreign buyers of his debt (red line) reveals two historical points:
-
- US deficits are appalling, and
- Who or what is going to fill that “gap”? (See also the chart above for the falling ROW financing of US debt)
FALLING STANDARDS OF LIVING
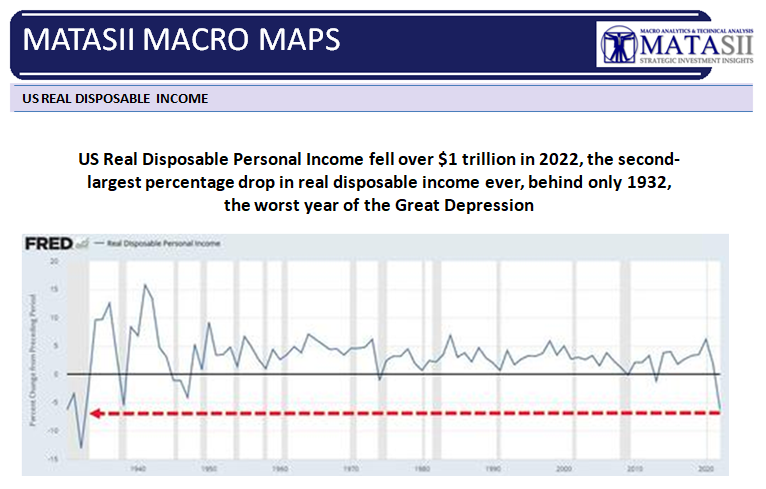 I have highlighted previously (chart right) how the plummetting US Real Disposable Income is destroying the US Standard of living for the middle and lower income class.
CHART BELOW
Since 1971, when the US came off the Gold Standard and adopted a “Fiat Currency”, the US Standard of Living has also fallen in a stealth fashion because of the deteriorating real value of the US Dollar (denomiated in real assets).
GLOBAL ECONOMIC REPORTING: What This Week’s Key Global Economic Reports Tell Us
 SUMMARY HIGHLIGHTS
-
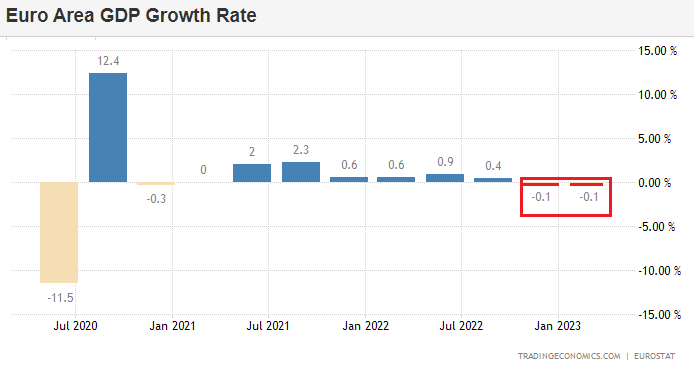
- The EU is in Recession and has been since Q1. This was announced with quietly revised data.
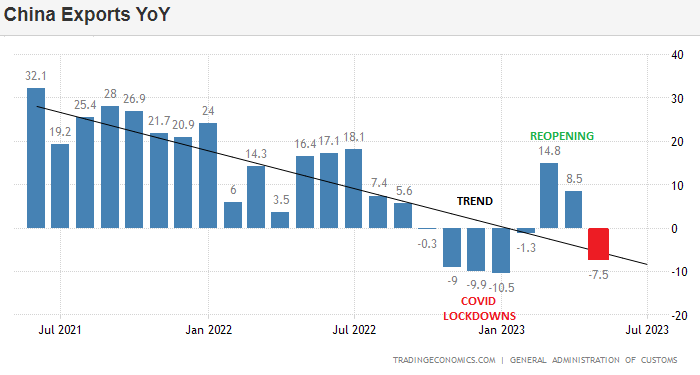
- China’s Exports went negative on a Y-o-Y basis. This is particularly bad, remembering that a year ago China was in full Covid lockdowns!
- The US Jobless Claims numbers surged this week (as we forecasted in this months video – charts below).
- Markets are not buying the hawkish dot plots from the Fed.
CONCLUSION
A MAJOR POTENTIAL CHINA STIMULUS??
 The WSJ is reporting:
“Beijing is planning major steps to revive the country’s flagging economy, including the possibility of billions of dollars in new infrastructure spending, and looser rules to encourage property investors to buy more homes, people familiar with the discussions say.
The push follows a series of interest rate cuts by China’s central bank this week, including one on Thursday that cut a key policy rate for the first time since August, as fresh data showed the country’s economic recovery is flickering out. The moves are a sign that Beijing officials are increasingly uneasy about the economy’s prospects now that a wave of excitement following the country’s abandonment of its draconian Covid-19 controls has receded.
More Detail:
-
- WSJ – 06-15-23: China Plans New Spending Drive, Other Stimulus to Revive Flagging Economy — Beijing officials are stepping up plans to jump-start China’s recovery, some economists worry they may have little impact.
- WSJ – 06-11-23: Fueled by Long Credit Binge, China’s Economy Faces Drag From Debt Purge — Consumers, businesses and local governments are looking to deleverage.
A CARDBOARD BOX RECESSION
“It is also important to note another major input in the manufacturing process: cardboard box demand. FreightWaves was among the first to cover the concerning signs surrounding cardboard box demand in the article, “Cardboard box demand plunging at rates unseen since the Great Recession.” Demand has remained soft ever since, and in a recent article from Charles Schwab’s chief global investment strategist, Jeffrey Kleintop, he proclaimed that the United States is currently experiencing a “cardboard box recession.” This refers to a situation in which manufacturing and trade experience a global recession while services industries continue to grow. Demand for manufacturing and trade-related goods has declined, as indicated by the decrease in demand for corrugated linerboard.”
THE STUDENT LOAN PAYMENT RESTART
“…. there are still a number of downside risks facing consumer spending in the 2nd-half, but one of the largest risks is student loan repayments. FreightWaves CEO Craig Fuller covered this risk at length in his recent article “An unusually terrible freight market may get a lot worse.” The article points out factors that could worsen the freight market, including the potential end of various stimulus programs that have boosted personal income and freight demand, but specifically, it highlights the potential fallout caused by the impending resumption of student loan payments.
The end of the student loan deferment program, which allowed consumers to save an average of over $15,000 since March 2020, will have a significant impact on consumer spending. With 64% of the $1.7 trillion student loan debt remaining in forbearance, the resumption of payments will create a cash flow shock for many households, particularly among the 25 million Americans ages 18-44 who have deferred their payments. This demographic plays a crucial role in driving consumer spending, and the sudden increase of approximately $393 per month in loan payments will likely lead to reduced discretionary income and a potential decrease in spending capacity.”
EVERYONE IS FRONT RUNNING THE FED!
THE WORST “TELEGRAPHING” EVER!
 For much of 2023, the fundamentals have screamed new market lows, while market technicals, positioning and liquidity have – on the contrary – been extremely bullish. (NOTE: The liquidity from the public having been bleeding down “Savings” from Covid & additionally strong labor market as detailed in this week’s newsletter).
A major part of the problem is that no one believes the Fed’s narrative. Frankly, it is the worst job of “telegraphing” their intentions that I recall! As such everyone believes the Fed is trapped and major rate cuts are imminent.
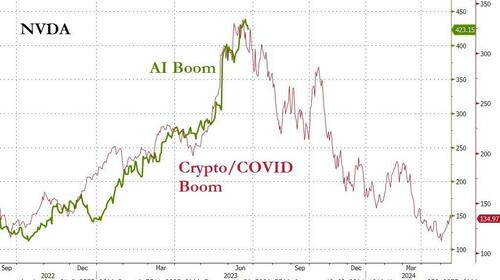
Therefore traders are simply looking through the rate hike “pause” and “front running” the Fed with Risk-On positioning. Additionally, the “AI” story is an easy Wall Street sell to “newbie” investors, greedy to get in early!
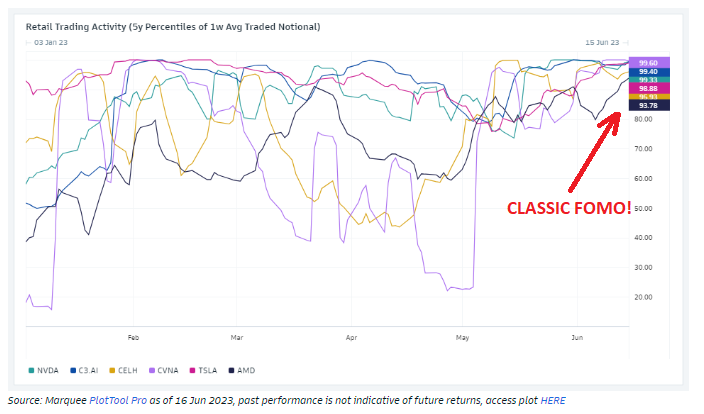 CHART RIGHT: All this can be seen with Meme stock trading. Meme stock trading activity has increased to ~99th percentile in the last 5 years. Sounds like a good time for an equity market stumble?
Additionally, with the March bank failures we saw a huge reserve spike, sparking the year’s big performance chase. This has resulted in:
-
- The highest print in the S&P in over a year
- The longest stretch of weekly gains in the S&P since 2021
- The strongest Nasdaq start to the year in history.
Has this surge come to an end? Last week we stressed that the last 5% is always the most expensive and to SELL GREED!
 Below we show additional data to support this view.
With Dealers Long $3.5BN Gamma, market turmoil is unlikely before Month & Quarter-End. Professional money managers do not want to be seen as having missed this rally.
CHART BELOW:
A MATASII Subscriber this week reminded us of the MATASII subscriber chart below. This trend line is proven to reflect both major support and overhead resistance on a fairly consistent basis. This week we bounced off the underside of this 35 Year trend line!
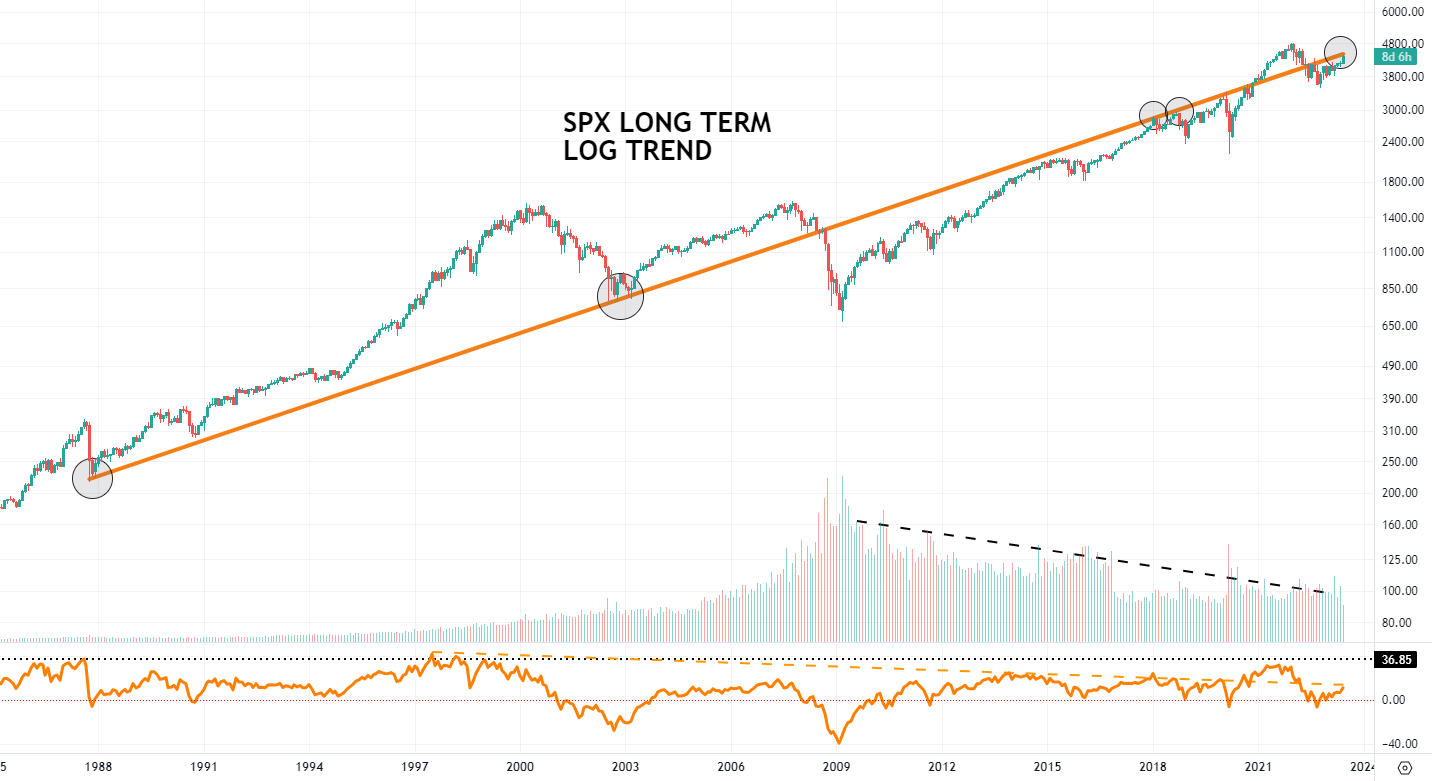
CHART BELOW:
We thought you might find it interesting to see how our proprietary MATASII CROSS AND MOMENENTUM indicator stacks up against this trend line.
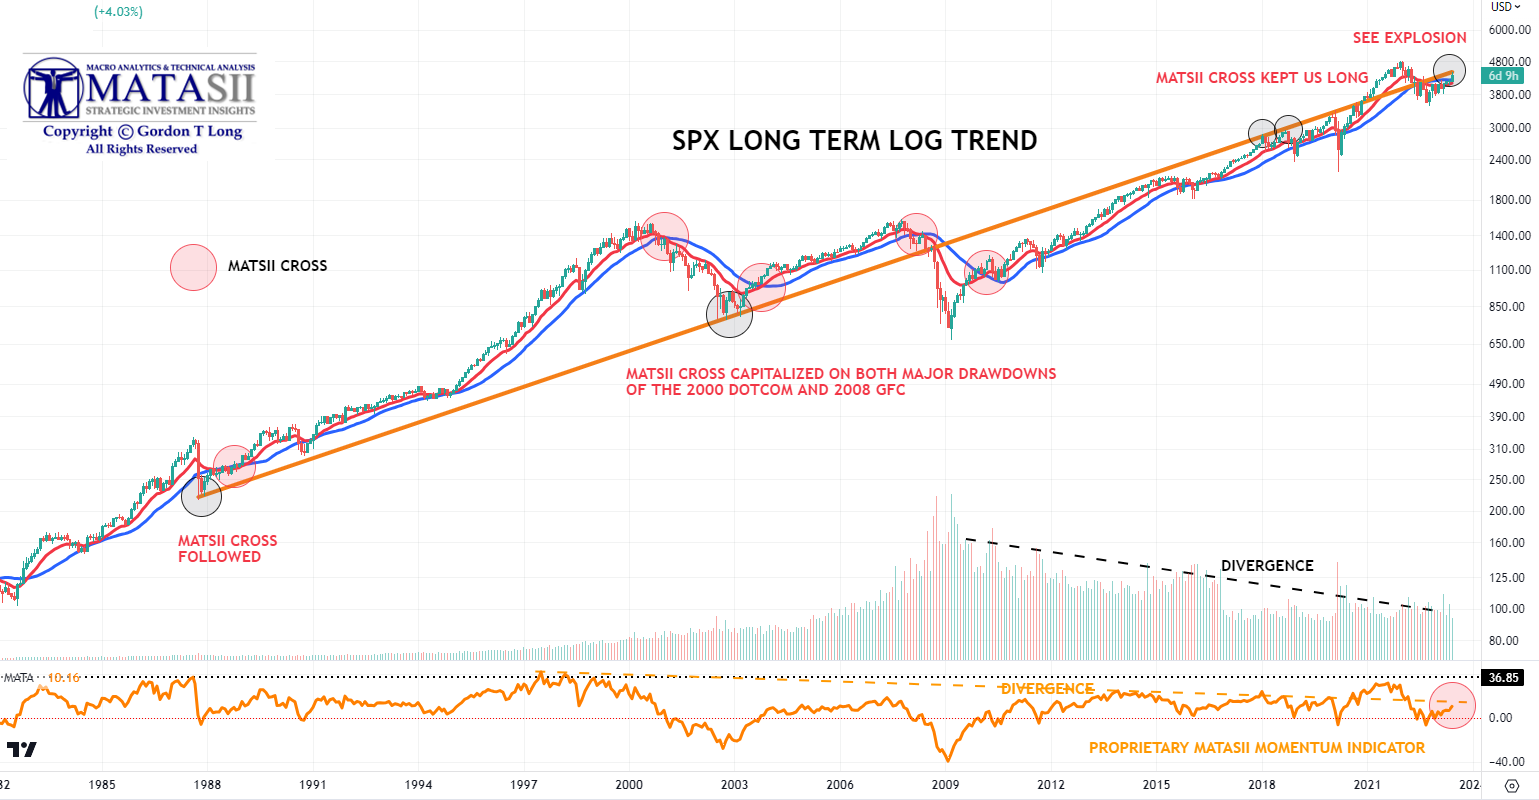
EXPLODED VIEW OF CURRENT MATASII CROSS
 Price action this with the quadruple option witching bounced off the underside of the S&P 500 long term log trend line. This is consistent with what it has been doing since 2008.
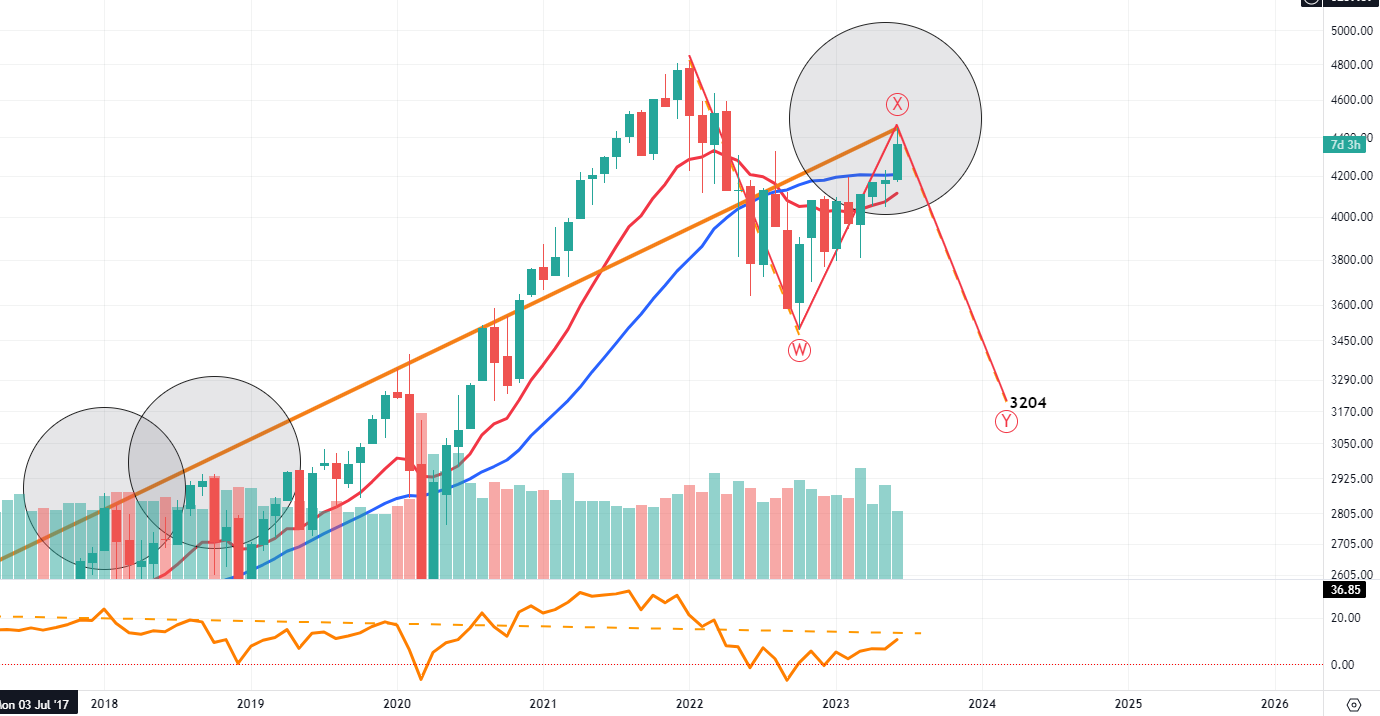
The MATASII CROSS is still on a SELL and sees the “X” leg as simply a consolidation / correction in the Longer-Term secular Bear Market.
The current WXY projection is very close to our long held 3270 projection for this secular Bull Market!
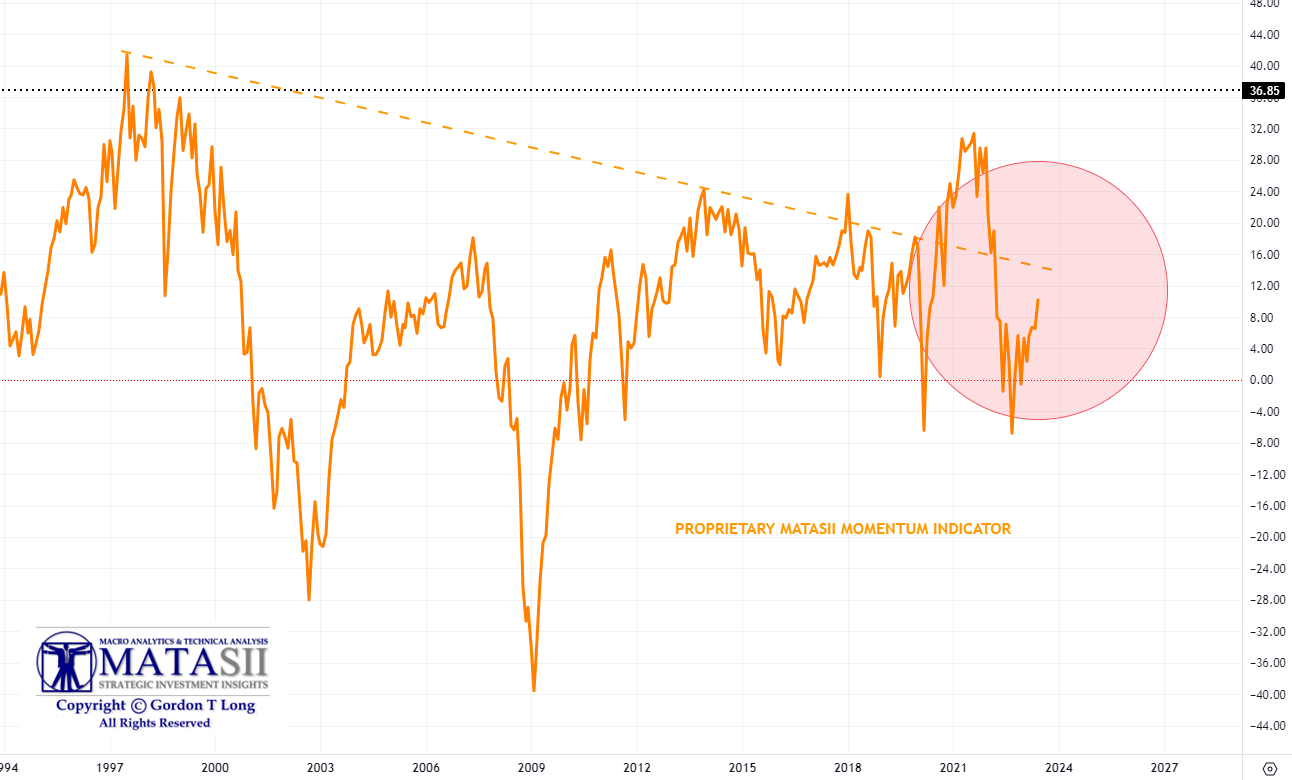
EXPLODED VIEW OF CURRENT MATASII MOMENTUM INDICATOR
There appears to be more work to be done within the strong current Momentum environment.
FAIR USE NOTICE This site contains copyrighted material the use of which has not always been specifically authorized by the copyright owner. We are making such material available in our efforts to advance understanding of environmental, political, human rights, economic, democracy, scientific, and social justice issues, etc. We believe this constitutes a ‘fair use’ of any such copyrighted material as provided for in section 107 of the US Copyright Law. In accordance with Title 17 U.S.C. Section 107, the material on this site is distributed without profit to those who have expressed a prior interest in receiving the included information for research and educational purposes. If you wish to use copyrighted material from this site for purposes of your own that go beyond ‘fair use’, you must obtain permission from the copyright owner.
NOTICE Information on these pages contains forward-looking statements that involve risks and uncertainties. Markets and instruments profiled on this page are for informational purposes only and should not in any way come across as a recommendation to buy or sell in these assets. You should do your own thorough research before making any investment decisions. MATASII.com does not in any way guarantee that this information is free from mistakes, errors, or material misstatements. It also does not guarantee that this information is of a timely nature. Investing in Open Markets involves a great deal of risk, including the loss of all or a portion of your investment, as well as emotional distress. All risks, losses and costs associated with investing, including total loss of principal, are your responsibility.