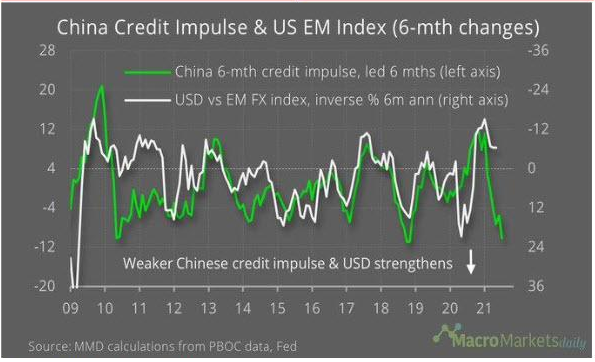
THE CHINESE CREDIT IMPULSE IS LEADING THE WAY!
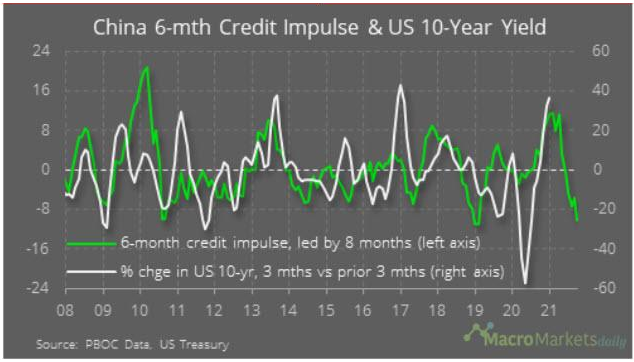
The Chinese Credit Impulse may be the most important indicator investors should currently be watching. Since the 2008 Financial Crisis it has demonstrated an incredible correlation with global moves in commodities and real sovereign bond yields.
The Chinese Credit Impulse (CCI) is the measure of the change in public and private Chinese credit as a percentage of Chinese GDP.
|
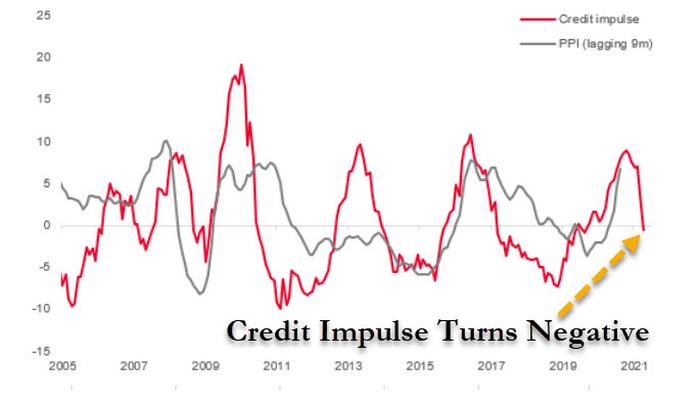
We have discussed the CCI many time before in the context of the US 10 Year Treasury’s Real yield which the CCI leads by approximately 12 months. What we haven’t discussed previously is that the CCI leads the US Producer Price Index by 9 Months as illustrated below:
|
|
|
A SHARP REVERSAL SIGNALS A POTENTIALLY DEFLATIONARY SHOCK
As important as the reversal in the CCI, what may be more critical is the rate at which it is falling since its abrupt reversal. The drop is significant and concerning.
We can also see that though the PPI trend lags, it reverses sooner when the CCI is signalling a reversal of 9 months out. This is to be expected as markets normally price out 6-8 months. The question is has this already occurred?
As we showed in the last newsletter, rapidly rising commodity prices have already been witnessed and many are at extreme historical levels from a year earlier:
- Gasoline: $1.77 now vs. $3 a year ago.
- Lumber: $332 per 1,000 board feet now vs. $1,570 per 1,000 board feet a year ago.
- Home sales: $283,500 now vs. $329,100 a year ago.
- Coffee: $0.96 a pound now vs. $1.50 a pound a year ago.
- Wheat: $5 a bushel now vs. $7.42 a year ago.
- Corn: $3.19 a bushel now vs. $7.22 a bushel a year ago.
- Copper: $2.33 a pound now vs. $4.76 a pound a year ago.
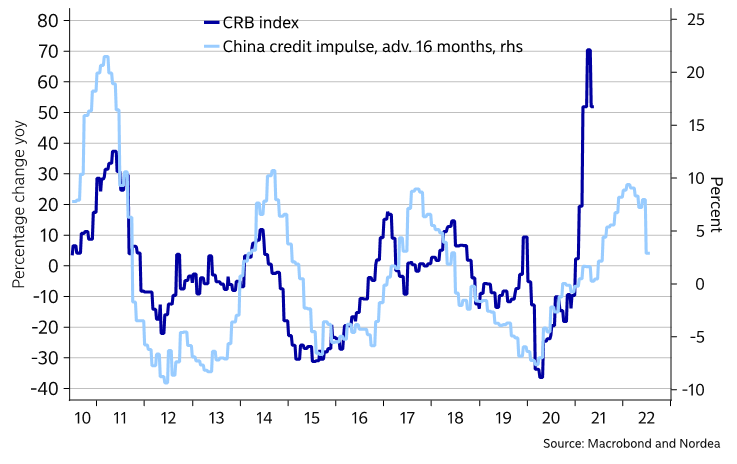
The CCI has a fairly good correlation against the overall US CRB Index but with a 16 month lead (shown below). It is fair to say that commodities have spiked dramatically ahead of the CCI.
|
|
|
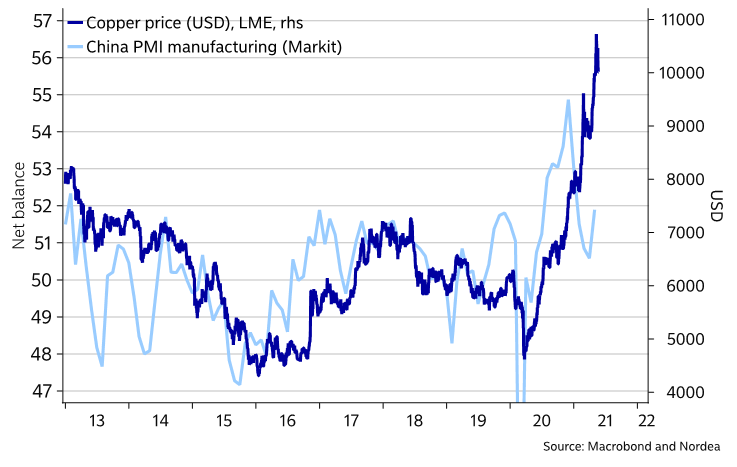 THE COMMODITY SPIKE IS MOST LIKELY PRICED IN THE COMMODITY SPIKE IS MOST LIKELY PRICED IN
We see to the right that even Copper priced in US dollars is significantly ahead of China’s Manufacturing PMI. There appears little doubt that investors with strong risk appetites have aggressively chosen to front run the whole commodity sector. With money so cheap and credit insurance insurance so low (sovereign CDS’), this has been an attractive speculative move.
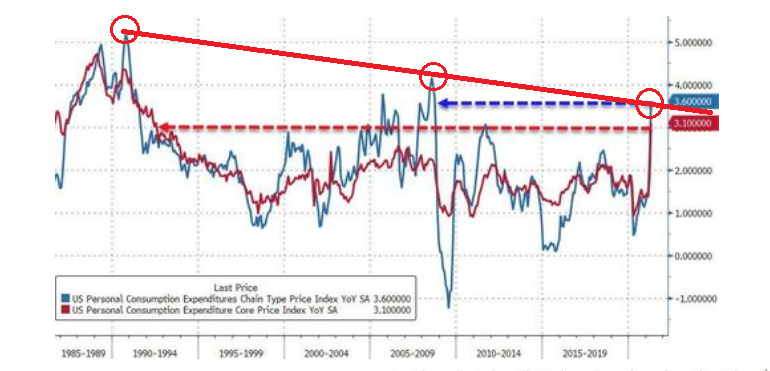
The US inflation rate has tripled from 1.4% in January to 4.2% in April. The headline “PCE Deflator” rose 3.6% Y-o-Y, the fastest rate or price increase since 2008. Even more notably, the Core PCE Deflator soared 3.1% Y-o-Y (hotter than the +2.9% Y-o-Y expected) and the hottest print since May 1992. The red trend line below further suggests that inflation may be already fully priced and due for a consolidation.
|
|
|
A WEAK CHINA BODES POORLY FOR THE GLOBAL ECONOMY
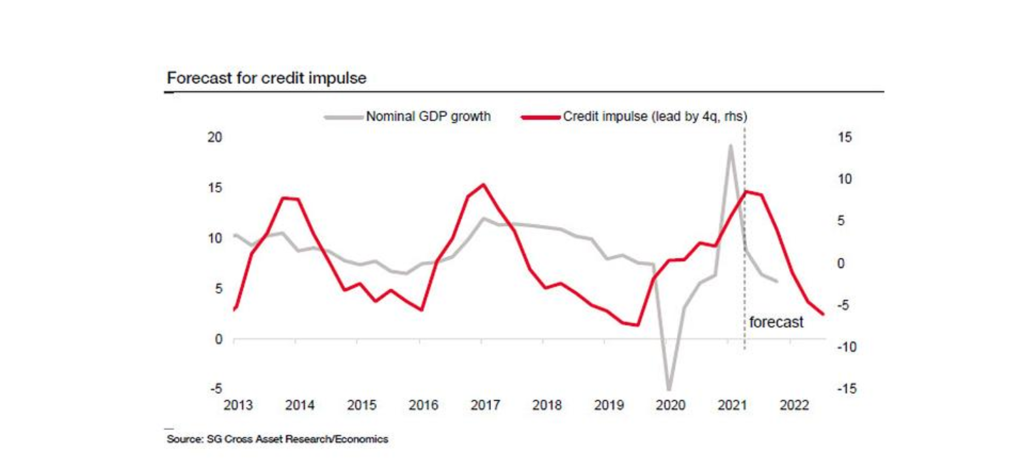
China as the industrial engine for the world and epicenter of global supply chains is signaling problems ahead. Chinese GDP which leads the CCI by four quarters (chart to the right) highlights this.
|
|
|
|
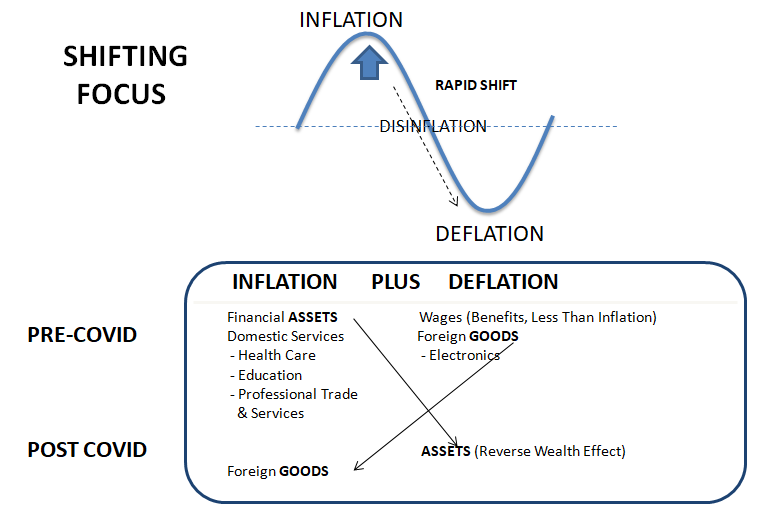 INFLATION PLUS DEFLATION INFLATION PLUS DEFLATION
We have argued for some time that we will see both rising inflation AND deflation concurrently.
Inflation Risk is likely in the following areas:
- RISK #1: A Sharper Rise in Wage Growth,
- RISK #2: A Multi-Year in Home Prices Which Boosts Rent (Shelter) Inflation,
- RISK #3: Temporary Price Spikes Raise Inflation Expectation Substantially,
- RISK #4: Yield Surge as a Market Inflation Reaction Inadvertently Causes Financial Tightening.
Deflation is coming in the way of falling financial assets later in 2021. (See ‘Coming Deflationary Tsunami’ below)
|
|
|
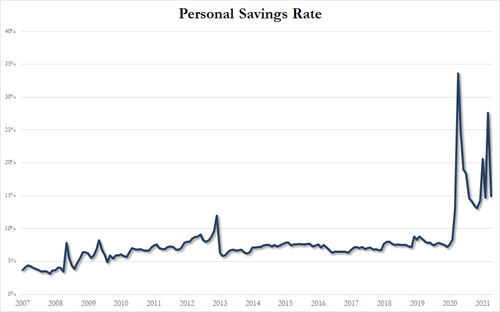 CONCLUSION CONCLUSION
The Chinese Credit Impulse is suggesting we can expect near term rises in the US$ and 10Y UST Yields. This has been consistently mirrored in 2021 by weakness in the equity, gold and silver markets.
In late Q3 we expect this to reverse with the dollar and US 10T Yields falling, while precious metals explode higher as the equity markets attempt to find support at lower levels.
|
|
| |
|
10Y UST YIELD
The 3 Mo over 3 Mo at 40% suggests there is still further to rise in yield before the change becomes negative and the yield reverses.
|
|
|
|
|
US Dollar
A weaker Chinese Credit Impulse and the $$ rises (at least in the near term).
|
|
|
|
|
“the pandemic created some truly “transitory” softness in the rental market last year, and in response, 2021 has seen some of the fastest rent growth we have on record in our data. Nationally, rents have now surpassed the level where they would have been if rent growth had not been disrupted by the pandemic. In markets like San Francisco where rents had been falling fastest, prices have turned a corner and are now rebounding. At the same time, booming markets like Boise continue to see prices climb. More broadly, rental inventory across the nation remains tight, and as vaccine distribution continues to gain momentum, we may be seeing even higher prices as a result of released pent up demand from renters who had been delaying moves due to the pandemic. Whereas last year’s peak moving season was halted by the pandemic, this year’s seasonal spike appears to be making up for lost time.
Apartment List ,
|
|

 THE COMMODITY SPIKE IS MOST LIKELY PRICED IN
 INFLATION PLUS DEFLATION


 CONCLUSION
