Gordon T Long
Global Macro Research | Macro-Technical Analysis
US ECONOMICS
INVESTMENT CYCLE
TIME TO LOOK BROADER THAN US EQUITIES
OBSERVATIONS: TRUMP MUST BEGIN TO RE-INDUSTRIALIZE AMERICA!
I have written endlessly that one of the two central problems America faces and which must be solved is:
THE US CONSUMES MORE THAN IT PRODUCES
The deindustrialization of America is a national crisis and it needs to be treated like one. How can a deindustrialized America have any kind of viable economic future because Services (the US is now a Service Economy) are dominantly local and at best national in scope and therefore contribute little to paying negative trade balances. Every month far more money goes out of the US than comes into it, because we buy far more from the rest of the world than they buy from us. As a result, we have to beg the rest of the world to lend us money just so that we can pay our bills.
Our national debt is now up to 36 trillion dollars, and the total amount of debt in our society is now up to 101 trillion dollars. Think about what the following 12 facts regarding the deindustrialization of America means.
#1. According to Google AI, our nation has lost almost 70,000 factories since the year 2000. This is part of a larger decline in the US manufacturing sector that has also resulted in the loss of over 5 million jobs.
#2. In July 1979, 19.5 million Americans had manufacturing jobs. Today, only 12.8 million Americans have manufacturing jobs, even though our population is much larger than it was in 1979.
#3. According to a survey that was recently conducted by the Pew Research Center, 59 percent of Americans believe that the U.S. has lot more than it has gained from free trade.
#4. In 1959, manufacturing represented 28 percent of all U.S. economic output. At the beginning of the Great Recession in 2008, manufacturing represented only 11.5 percent of all U.S. economic output. Today, manufacturing represents just 10.3 percent of all U.S. economic output.
#5. More than a billion cell phones are sold worldwide each year. Only a few thousand of them are actually manufactured in the United States.
#6. The size of our trade deficit with China in 2024 was $295,000,000,000.
#7. At this point, China produces approximately 4 times as many vehicles each year than the United States does.
#8. In the early days of the industry, 100 percent of all semiconductors were manufactured in the United States. Today, that number is down to just 8 percent.
#9. Russia is producing three times as many artillery shells as the U.S. and Europe combined.
#10. The United States spends approximately $3.00 on Chinese goods for every $1 that the Chinese spend on goods from the United States.
#11. Our stores are absolutely overflowing with products that are made in China. Meanwhile, soybeans are the number one export from the U.S. to China.
#12. More than 36 million Americans are now living in poverty. Homelessness in the U.S. is at an all-time record high, and demand at food banks in the U.S. is at record levels all over the nation.
WHAT YOU NEED TO KNOW!
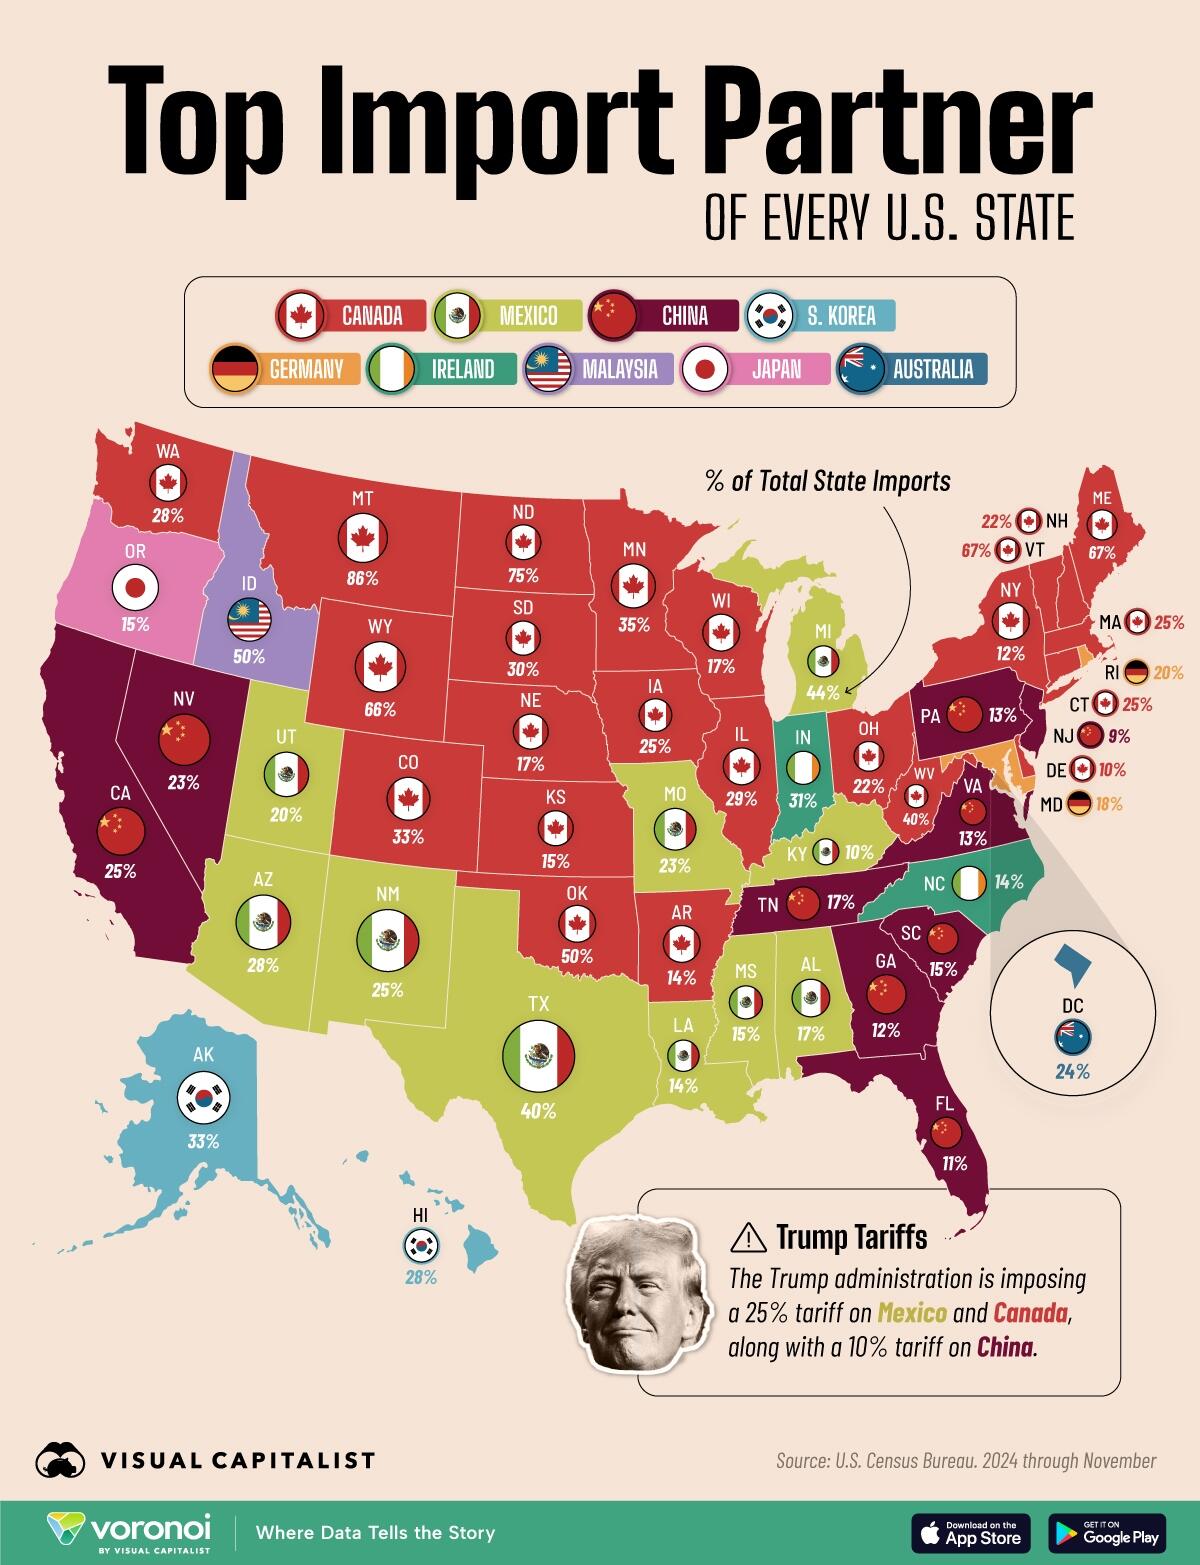 CANADA IS THE TOP US STATE IMPORT PARTNER & HOLDS THE TARIFF TRUMP CARD.
The Trump administration is imposing a 25% tariff on imports from Mexico and Canada, along with a 10% tariff on imports from China.
The U.S. President says he wants strong action to halt the flow of the opioid fentanyl and its precursor chemicals into the U.S. from China via Mexico and Canada, as well as to stop illegal immigration across U.S. borders.
Mexico, Canada and China are the top trade partners for 42 states. Canada is the top import partner for 23 U.S. states.
As expected, the US northeast is dominated by Canadian imports. Canada is the largest supplier of grain, livestock, meat, and poultry to the U.S.
What this chart doesn’t show is how completely dependent the US Northeast is on Canada for electricity needs.
If Canada chose to fight a Trade War with the US, then brownouts in New York & Wall Street would
RESEARCH – MARKET DRIVERS
 1- MATASII INVESTMENT THEMES – Time to Look Outside the US Equity Market
-
- Financial Markets are increasingly shifting towards Gold, Bonds & International Markets.
- GOLD: Periods of big history (such as possibly with the 4th Turning) are marked by big gold bulls (1930s depression, 1970s stagflation, 9/11, GFC, populism in 2020s), while the regime change Trump 2.0 is determined to make history.
- Gold is already frontrunning this.
- US TREASURY BONDS: Analysts are now all calling for Total Returns from Equities to fall in 2026 and for at least the rest of the decade. A ‘low risk’ bond portfolio (20% T-bills, 20% 30-year US Treasury, 20% IG, 20% HY, 20% EM) generates 9-10% if US Treasury yields fall back toward 4%.
- US Treasury yields can be expected to fall below 4% if for no other reason than to save the US Banking sector from over $700B in unrealized losses from their Treasury Bond inventories.
- INTERNATIONAL MARKETS: International Markets are possibly a “Cheap-with-Catalysts” play in 2025.
- China stocks are trading on 10x, UK & Emerging Markets on 12x, Europe on 14x, while US has forward PE of 22x.
- Trade war won’t end in 2025 resulting in a bid for International.
2- INFLATION PUSHES HIGHER – What This Has Meant Historically
-
- A Sustained Rise in Inflation historically upset the whole “Apple Cart” of major market advances.
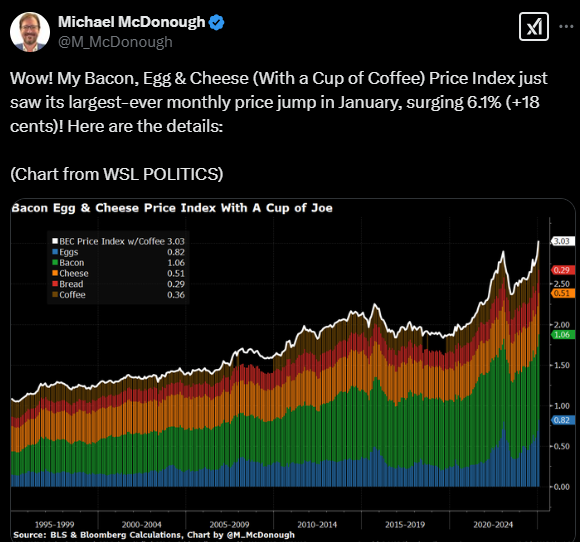
- CPI & PPI Increases this week came as a shock to the market as many begin to wonder if the Second Wave of Inflation is now underway.
- We feature Bravos Research this week, who believes with U.S. corporate profit margins hovering at the highest levels in history, and representing 13% of GDP growth, it means an enormous chunk of the economy is pure profit. Much of this can be expected to be re-invested into financial assets, fueling even higher stock prices.
- This is premised on Inflation staying tame. If however if this week’s CPI & PPI were precursors, then the markets are in for major hurt!!
DEVELOPMENTS TO WATCH – POLICY DRIVERS
 1- COMMODITIES – STEEL & ALUMINUM TARIFFS
-
- Trump ordered a 25% tariff on steel and aluminum imports, escalating efforts to protect politically important US industries with levies hitting some of the country’s closest allies, most notably Canada, which is the source of most steel and virtually all aluminum imports.
- According to Bloomberg, Trump’s decision to include downstream finished products is a significant move that will have broad-reaching price impacts on a massive swath of US consumers.
- Whereas Trump’s 2018 tariffs focused mostly on raw steelmaking and primary aluminum production, these new tariffs will include things like extrusions and slabs that are turned into value-added products needed in everything from automobiles to window frames and skyscrapers.
- The move would fulfill what the most extreme trade protectionists have sought for years.
2- “RECIPROCAL” US TRADE TARIFFS ORDERED
-
- President Trump announced “reciprocal tariffs” which would raise the US tariff on imports to the same level that the exporting country imposes on US products.
- Trump’s tariffs would match the higher duties charged by other countries and would aim to counteract: i) burdensome regulations, ii) value-added taxes, iii) government subsidies and iv) exchange rate policies that can erect barriers to the flow of U.S. products to foreign markets.
- If applied at the product-specific level (e.g., the US tariff on cars from the EU would equal the same rate the EU applies on cars from the US), the US weighted average tariff rate might rise by around 2%. If applied at the country level, the effect could be smaller.
- The risk scenario related to reciprocal tariffs is that the Trump administration could attempt to equalize non-tariff barriers (NTBs) to trade. These are difficult to quantify but could result in a greater increase.
- The main risk is that the Trump administration could consider value-added taxes (VATs) in the calculation, which would raise the average effective tariff rate by 10% further.
GLOBAL ECONOMIC REPORTING – ECONOMIC DRIVERS
 CONSUMER PRICE INDEX (CPI)
-
- US CPI MM, SA (Jan) 0.5% vs. Exp. 0.3% (Prev. 0.4%)
- US Core CPI MM, SA (Jan) 0.4% vs. Exp. 0.3% (Prev. 0.2%)
- US CPI YY, NSA (Jan) 3.0% vs. Exp. 2.9% (Prev. 2.9%)
- US Core CPI YY, NSA (Jan) 3.3% vs. Exp. 3.1% (Prev. 3.2%)
- US Cleveland Fed CPI (Jan) 0.3% (Prev. 0.3%)
PRODUCER PRICE INDEX (PPI)
-
- US PPI Final Demand MM (Jan) 0.4% vs. Exp. 0.3% (Prev. 0.2%, Rev. 0.5%)
- US PPI Final Demand YY (Jan) 3.5% vs. Exp. 3.2% (Prev. 3.3%, Rev. 3.5%)
FAIR USE NOTICE This site contains copyrighted material the use of which has not always been specifically authorized by the copyright owner. We are making such material available in our efforts to advance understanding of environmental, political, human rights, economic, democracy, scientific, and social justice issues, etc. We believe this constitutes a ‘fair use’ of any such copyrighted material as provided for in section 107 of the US Copyright Law. In accordance with Title 17 U.S.C. Section 107, the material on this site is distributed without profit to those who have expressed a prior interest in receiving the included information for research and educational purposes. If you wish to use copyrighted material from this site for purposes of your own that go beyond ‘fair use’, you must obtain permission from the copyright owner.
NOTICE Information on these pages contains forward-looking statements that involve risks and uncertainties. Markets and instruments profiled on this page are for informational purposes only and should not in any way come across as a recommendation to buy or sell in these assets. You should do your own thorough research before making any investment decisions. MATASII.com does not in any way guarantee that this information is free from mistakes, errors, or material misstatements. It also does not guarantee that this information is of a timely nature. Investing in Open Markets involves a great deal of risk, including the loss of all or a portion of your investment, as well as emotional distress. All risks, losses and costs associated with investing, including total loss of principal, are your responsibility.