Gordon T Long
Global Macro Research | Macro-Technical Analysis
MACRO
US MONETARY POLICY
US DEBT IS NOW A SERIOUS SYSTEMIC PROBLEM
OBSERVATIONS: FLEEING POORLY RUN STATES CONTINUES
The latest US census was just released on US population growth which grew by 1.6 million in 2023, with the South accounting for 87% of the growth. Texas and Florida were the fastest-growing states, with populations rising by 1.7% and 1.6%, respectively.
The Census Bureau reported that as of December 30, 2023, eight states lost population in 2023:
-
- New York: -102,000
- California: -75,000
- Illinois: -33,000
- Louisiana: -14,000
- Pennsylvania: -10,000
- Oregon: -6,000
- Hawaii: -4,300
- West Virginia: -4,000
New York, Illinois, and California had also lost the most residents in 2021-2022.
-
- NEW YORK: The population declined 0.52% between July 1, 2022 and July 1, 2023. This is a net loss of just under 102,000 residents.
- ILLINOIS: As of July 1, 2023, the population of Illinois is 12,549,689. This is a 0.26% decline from 2022, when the population was 12,582,515.
- CALIFORNIA: As of 2023, California’s population is 38,965,193, which is a 0.19% decline from 2022. This is the third year in a row that California’s population has decreased. (See more below: “CALIFORNIA – Like The Great Depression The Homeless, Unemployed, Addicts and Illegals Are All Going West!”)
What’s the common denominator? They are dominantly Democratically controlled states that have major cities riddled with Lawlessness and Crime, along with failing state economic policies and predatory taxing for individuals, Small Business and Corporations..
What can we learn? These are generally the most welcoming sanctuary cities for Illegal Immigrants which will overwhelm their social programs. Expect more taxes and continued shrinking net population growth despite 100s of thousands on Illegal immigrants! Then a national ballout program that taxes the rest of us. Not a good prescription to bind a federalist nation together?
WHAT YOU NEED TO KNOW!
THIS CHARADE IS A COMPLETE MESS
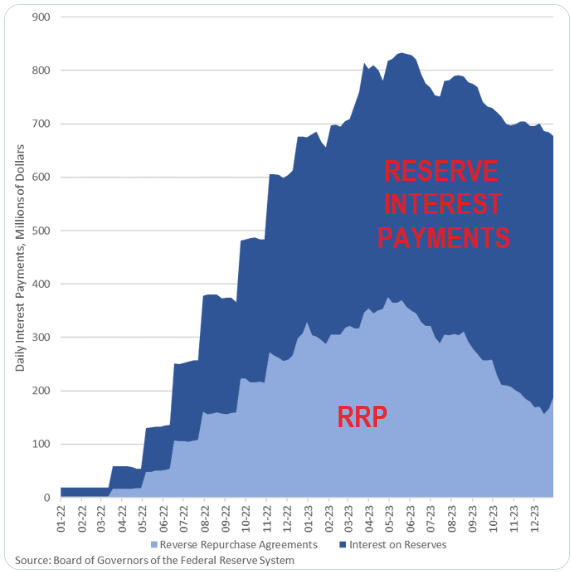 1- Reverse Repos (RRP) are coming down, but are just being replaced with higher reserve balances that the Fed must pay interest on. Unless QT picks up, the drop in RRPs will fuel inflation!
2-The Fed additionally faces a growing gap between the rate on the Federal Reserve’s BTLP funding facility and what the central bank pays institutions parking their reserves. The difference is free money that the banks are now arbitraging at the Fed’s expense to hide mounting losses.
BOTTOM LINE: The Fed is paying $677 million A DAY in interest to keep up the charade of $4.5 trillion in “sterilized cash”. The whole charade is close to being a Ponzi scheme, if it weren’t for the fact the Fed can just create currency with a mouse click!
RESEARCH
US DEBT IS NOW A SERIOUS SYSTEMIC PROBLEM
-
- US debt increased by:
- $1 trillion in the past 3 months
- $2 trillion in the past 6 months
- $4 trillion in the past 2 years
- $11 trillion in the past 4 years
- Every person in America now owes (and is responsible for) more than $100,000 on the US debt.This must be paid by the taxpayer through either taxation or lost purchasing power (taxation).
- “We the People” are now obligated by the policies of a central bureaucracy to borrow over $75,000 every second just to cover expenses – most of which is considered “non discretionary”.
- A budget deficit of $1.7 trillion shows both how this burden grows yearly and how incapable the government is able to live even within its own “crafted” budget.
- Today, the average family of four is paying $14,700 yearly or $1,224 more per month to purchase the same goods and services compared to the day sleepy Joe took office.
- US debt increased by:
THE BTLP ENDS MARCH 1ST – WHAT WILL THE FED DO?
-
- Everyone fully expects the Federal Reserve to extend the BTLP. Unfortunately it isn’t quite that simple.
- There are about 20 banks with $200–900 billion in assets. These are the so-called mid-sized regional banks that are not too big to fail. A Round 2 of the US Banking Crisis should be expected to occur no later than Q4 2024.
- Capital Ratio are being covered by the BTLP to cover the ~$650B in Unrealized losses associated with Treasury holdings. This can currently be rationalized by believing rates will come down and make them whole again. However, rates will likely never go back to where they were, so there are massive losses that must be addressed somehow. There is another Bank Bailout coming.
- Additionally, there are significant Real Estate loans within these Regional Banks that are exposed to “material” write downs and loss reserves.
THE CALIFORNIA ‘HONEY POT’ – Like The Great Depression, The Homeless, Unemployed, Addicts and Illegals Are All Going West!
-
- Even with an influx from homeless, addicts, unemployed and illegal immigrants the net California population growth according to the last Census fell by 75,000 people to 38,965,193. This is a 0.19% decline from 2022 and is the third year in a row that California’s population has decreased.
- Over a quarter-million upper-middle-class taxpayers flee the state each year, unable to endure a 13.3% non-deductible, top state income tax rate on top of the 37% of their income that goes to the IRS.
- There is a catastrophic current 25% drop in California income tax revenues when a single 1% of households pay 50% of all state income taxes—and is stampeding out of state.
- Is California the model, where currently an estimated half of all illegal aliens reside and 27 percent of the resident population was not born in the U.S.?
- Is Governor Newsom federalizing California, or spreading the idea that far too privileged Americans owe the poor of the world massive subsidies as a reward for breaking their laws in coming here?
GLOBAL ECONOMIC REPORTING: What This Week’s Key Global Economic Reports Tell Us?
-
- NON-FARM PAYROLLS: If one believes the headlines, in December the US added 216K payrolls (which included a record number of double-counted multiple jobholders), and yet the number of employed workers actually crashed by 683K, the biggest drop in 4 years.
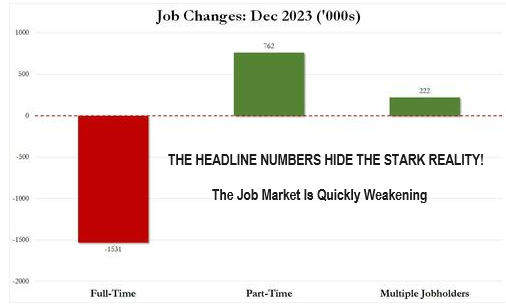
- In December, the number of well-paid, full-time workers collapsed by a near record 1.5 million, offset by a 762K surge in part-time workers.
- 222K people discovered last month that to keep up with the economic miracle that is Budget Busting Bidenomics, they need to work at least one more job.
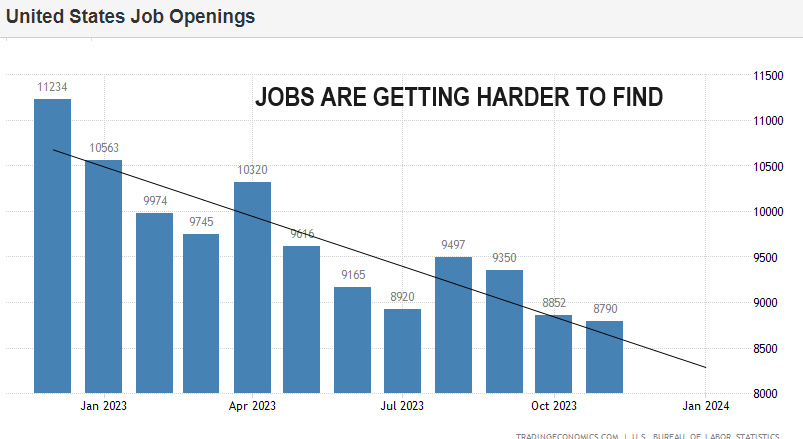
- CONTINUING JOBLESS CLAIMS – JOLTS, HIRING & QUITS: New Hires declined 363k to 5.5m. Quit rate fell to 2.2% from 2.3%.
- FOMC MEETING MINUTES: The Minutes confirmed that members generally viewed the addition of the word “any” to comments on possible additional firming as relaying their judgement that rates were likely at or near the peak of the cycle.
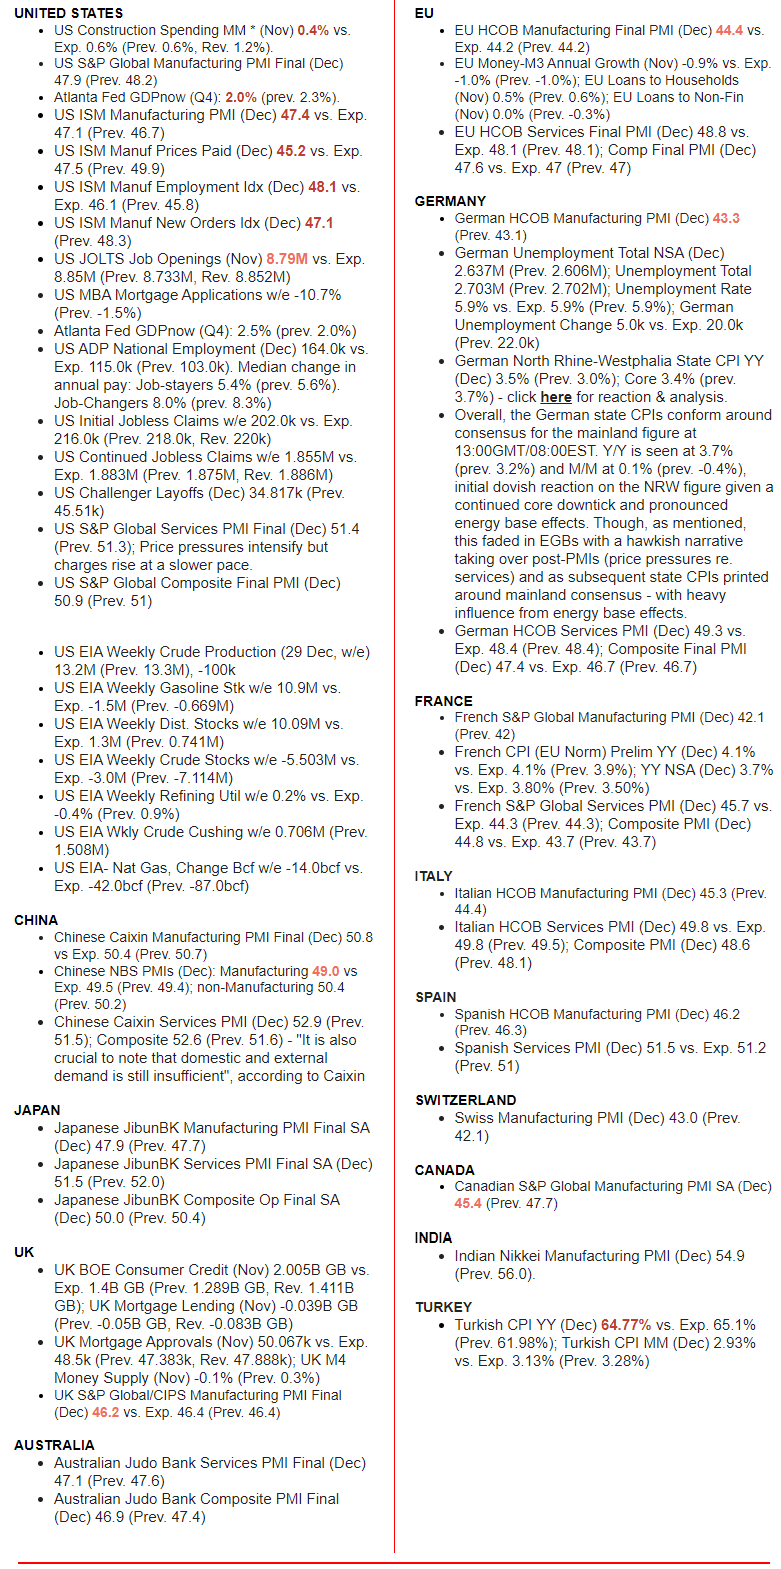
- ISM MANUFACTURING: US ISM Manuf New Orders Idx (Dec) 47.1 (Prev. 48.3), US ISM Manufacturing PMI (Dec) 47.4 vs. Exp. 47.1 (Prev. 46.7), US ISM Manuf Prices Paid (Dec) 45.2 vs. Exp. 47.5 (Prev. 49.9), US ISM Manuf Employment Idx (Dec) 48.1 vs. Exp. 46.1 (Prev. 45.8).
DEVELOPMENTS TO WATCH
STEALTH LIQUIDITY PUMP HAS ONLY $665B LEFT
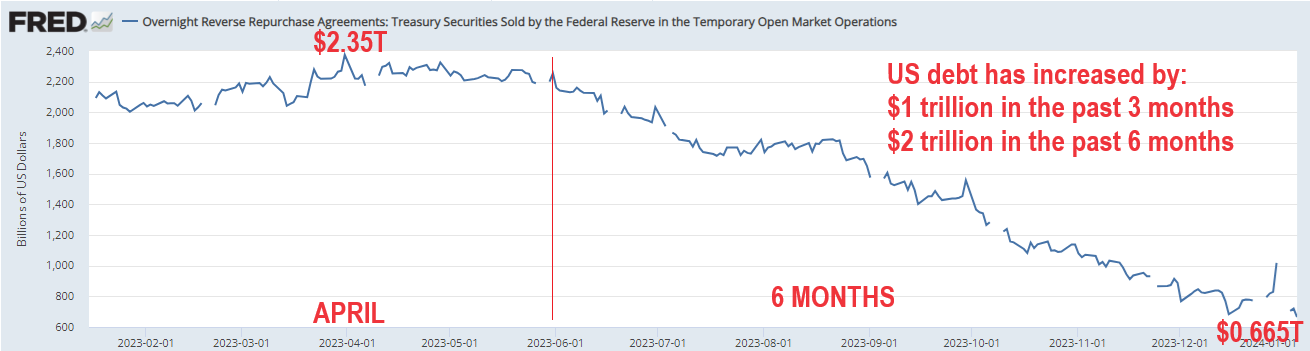
The plunge in the reverse repo facility is once again back on, and we can expect that a reversion to the liquidity draining mean is likely to result in Reverse Repo (RRP) sliding to $500BN in a few weeks and all the way to zero some time in March.
While stocks can and will be buoyant as long as the reverse repo serves as a source of liquidity. But once it is tapped out and bank reserves rediscover gravity (as QT supposedly still has a ways to go), the perverbial sh–t hits the fan and the rubber will hit the road!
THE 2024 STUDENT DEBT DEBACLE
22 million borrowers had payments due in October, but only 13 million settled their bills.
-
- 40% of borrowers failed to make payments.
- Before the pandemic, about one-quarter of student loan borrowers were dodging payments.
- There is no doubt that the road back to loan repayment after more than three years of forbearance was not going to be easy, but Biden’s continuous rhetoric has only seriously manifested the problem.
US DEBT IS NOW A SERIOUS SYSTEMIC PROBLEM
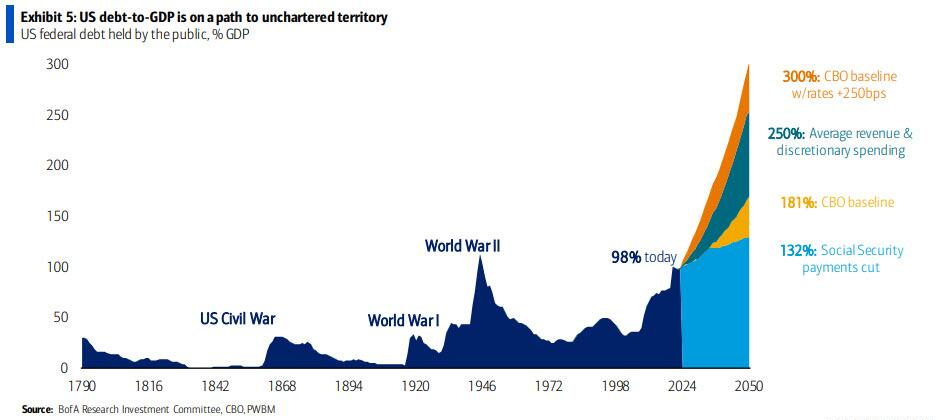 The United States debt has now surpassed $34 trillion at around 120 percent of our GD. Astoundingly, this is larger on a GDP basis than it was even during World War II, with our debt growing at a faster rate than our GDP.
US debt increased by…
-
- $1 trillion in the past 3 months
- $2 trillion in the past 6 months
- $4 trillion in the past 2 years
- $11 trillion in the past 4 years
Also quite troubling is that now a little over $7 trillion of the US debt is held by foreigners. That $7T is the value of the entire U.S. annual budget.
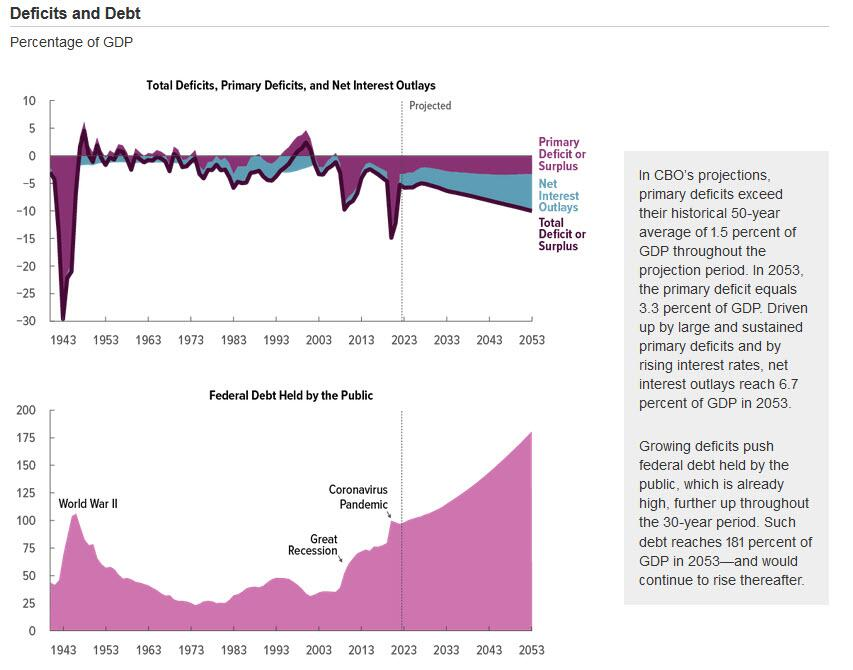
We are now paying over $1 trillion a year in debt service, more than our defense budget.
-
- Interest payments on the debt increased by $177 billion or 33%.
- Medicare spending increased by $126 billion or 18%.
- Medicaid spending increased by $24 billion or 4%.
- Pension Benefit Guaranty Corporation spending increased by $38 billion.
- FDIC spending amounted to $92 billion as the agency dealt with bank failures—an increase of $101 billion.
Meanwhile the purchasing power of the US dollar only falls. As someone recently reflected in a note I read: “That $10 your grandmother stuck in your birthday card that was lost in the commotion of your birthday party in 1971 would, if found today, be worth $1.20.”
-
- Every person in America today owes more than $100,000. They are forced to borrow over $75,000 every second just to cover expenses. The budget deficit of $1.7 trillion shows how this burden grows yearly.
- Today, the average family of four is paying $14,700 yearly or $1,224 more per month to purchase the same goods and services compared to the day sleepy Joe took office.
WHAT DOES THIS MEAN?
MINIMALLY & URGENTLY:
-
- Congress must absolutely get a handle on our spending. We have a spending problem not a revenue problem. We must make vigorous, real, reductions.
- Our elected officials must have the courage to raise taxes principally on its own donor class, so that we get to a balanced budget no later than 2030.
- To grow our way out of debt as we did our World War II debt, we must make our nation more productive and more resilient.
- We must start graduating more chemical engineers and computer scientists and fewer social workers and grievance studies graduates.
- It means fiercely protecting our technology and re-shoring high value-added manufacturing.
- It means making smart policy choices, across the board, to keep our people healthier, our children far better educated and much more physically fit to reduce healthcare costs.
- We need to ensure our family structures and institutions are more resilient so that charities and families—not governments—support our most challenged citizens.
THE BTLP ENDS MARCH 1ST – WHAT WILL THE FED DO?
 Everyone fully expects the Federal Reserve to extend the BTLP. But it isn’t quite that simple.
-
-
- Deposits have fled the banks for higher Money Market Interest Rates. That money is not coming back unless banks pay more competitive rates which they can ill afford to do.
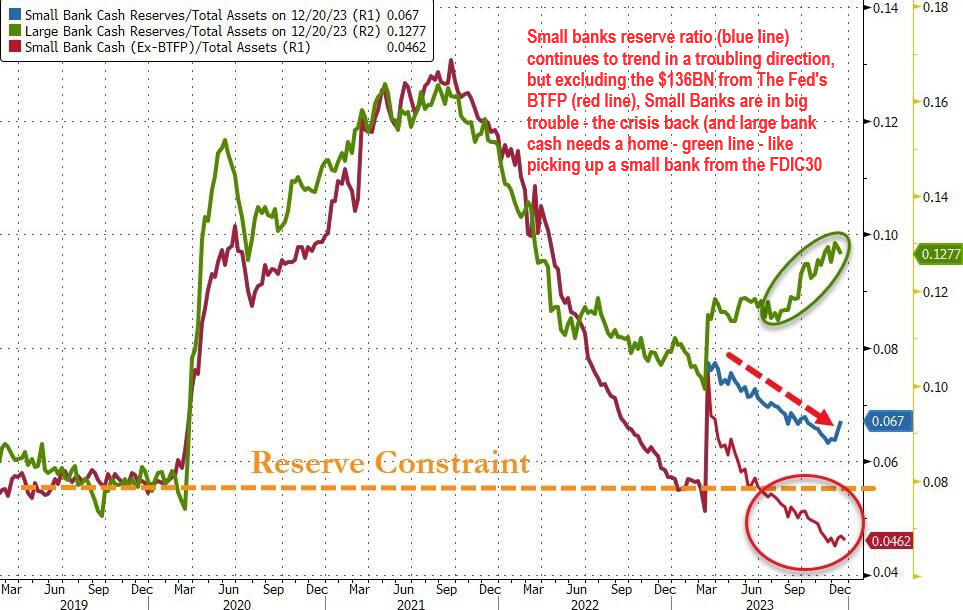
- Reserve Ratio are therefore currently a major problem that must be solved other than by continued bank regulatory forbearance.
- Capital Ratio are being held together by BTLP to cover the ~$650B in Unrealized losses associated with Treasury holdings. That can be rationalized by believing rates will come down and make them whole again. However, rates will likely never go back to where they were, so there are massive losses that must be addressed somehow.
- Additionally, there are significant Real Estate loans that are exposed to write downs and loss reserves.
-
LIKELY SOLUTION
-
-
- The only real solution is bank consolidation. Larger banks must be put in a position to buy the smaller banks quietly through FDIC bank failure management.
- The Fed will eventually have to buy the Treasury paper from Insolvent banks, thereby ending QT and purchasing the Treasury Bonds at a major discount to hold rates from exploding (prices collapsing). The Federal Reserve balance sheet is likely to increase by maybe half a trillion dollars to do this. This will drive duration risk premiums higher.
-
-
- To grow (or at least slow the decline) of deposits, banks are going to have offer rates that are somewhat competitive with money market funds (considering that bank deposits are insured by the FDIC and thus relatively safe), and that offer positive real (i.e., after inflation) returns.
- With inflation persisting in the range of 3–4 percent, this means that banks will have to offer 4–5 percent to be relevant.
- This isn’t going to work for the banks. They won’t be able to maintain profitability.
- It also won’t work for the U.S. Treasury, which itself is committed to trillion-dollar bond issuances each quarter and also must offer a positive interest rate above investor perceptions of inflation and the deteriorating fiscal condition of the U.S. government.
- If funding costs rise further, or if unrealized losses begin to realize, banks will start taking hits to their capital levels. This will spook the markets, including depositors, and we may find ourselves in round two of deposit runs.
ONLY WAY OUT?
-
- To head off these challenges, some banks are looking to merge.
- There have been 78 bank deals announced in the second half of 2023, mostly among the smaller and community banks. But this won’t work in many situations where the result is the proverbial “two drunks holding each other up.”
- Investor optimism is permeating markets going into year-end, with most all asset classes continuing to rise.
- We must not lose sight of the banks. They are not out of the woods yet. While there is a “goldilocks” scenario in which the banking sector makes a soft landing, the risk of another set of bank failures in 2024 remains meaningful.
There are about 20 banks with $200–900 billion in assets,
the so-called midsized regional banks that are not too big to fail.
ROUND 2 OF THE BANKING CRISIS SHOULD BE EXPECTED BY Q4 2024.
CHARTS & DATA TO SUPPORT THE ABOVE CONCLUSIONS:
-
- Fed rate cuts come too late to avert a fresh wave of US bank failures Authored by Ambrose Evans-Pritchard at the Telegraph
- The Banks Are Not OK – Authored by Michael Wilkerson via The Epoch Times
- San Francisco Small-Business Owners Calling For Help Authored by Siyamak Khorrami via The Epoch Times
- “They just gave up on San Francisco,”… a long-time small-business owner in San Francisco is on the verge of losing his business because, he says, no bank will make him a commercial loan. “Six have said [they] are not even willing to make a commercial loan in San Francisco,”
- Bank Bailout Fund Usage Just Keeps Soaring, Money-Market Funds Biggest Inflow Since SVB Crisis Authored by Tyler Durden Zero Hedge
- US Banks Suffer Trillion-Dollar Deposit Loss In 2023, Small Bank Capitalization Remains Problematic Authored by Tyler Durden Zero Hedge – Americans appear to hate giving their money to large banks, but it is small banks that are becoming dangerously under-capitalized as a result of having so many (relatively speaking) deposits.
THE CALIFORNIA ‘HONEY POT’ – Like The Great Depression The Homeless, Unemployed, Addicts and Illegals Are All Going West!
UNLIKE THE GREAT DEPRESSION THEY AREN’T COMING FOR WORK, BUT THE FREE GOODIES!
 Even with an influx from homeless, addicts, unemployed and illegal immigrant, the net California population growth according to the last Census fell by 75,000 people to 38,965,193. This is a 0.19% decline from 2022 and is the third year in a row that California’s population has decreased.
Is California the model, where currently an estimated half of all illegal aliens reside and 27 percent of the resident population was not born in the U.S.?
California, while experiencing hundreds of thousands of new illegal entries and a $70 billion annual budget deficit:
-
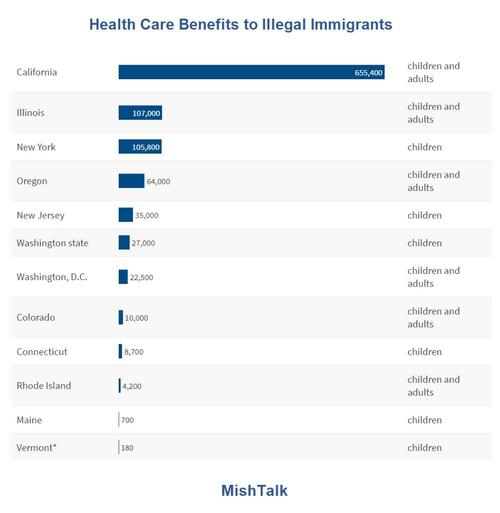
- Just extended free health care services to non-citizens who entered unlawfully.
- More than half of the state’s births are already paid for through Med-Cal.
- One-third of Americans living on assistance live in California.
- A fifth of the population struggles below the poverty line, while the state runs up a $70 billion annual deficit with the nation’s highest income taxes, gas taxes and among the highest sales taxes.
Is It Any Wonder:
- Over a quarter-million upper-middle-class taxpayers flee the state each year, unable to endure a 13.3% non-deductible, top state income tax rate on top of the 37% of their income that goes to the IRS.
- There is a catastrophic current 25% drop in California income tax revenues when a single 1% of households pay 50% of all state income taxes—and is stampeding out of state.
- According to the Federation for American Immigration Reform (FAIR), a nonprofit organization that pushes for changes in immigration policy, the cost of health care for illegal immigrants in California through Medi-Cal was approximately $4.8 billion per year in 2022.
- The total cost of illegal immigration in California was around $22.8 billion annually for education, health care, law enforcement, criminal justice system costs, welfare and other expenditures. By comparison, the annual cost of illegal immigration in Texas in 2022 was $9.9 billion. In California, the taxpayer cost per immigrant in 2023 was $7,074 compared to Texas at $4,466.
Is Governor Newsom federalizing California, or spreading the idea that far too privileged Americans owe the poor of the world massive subsidies as a reward for breaking their laws in coming here?
NOTE: NATIONAL
With a National $34 trillion in debt and budget deficits normalizing at near $2 trillion a year, where does America find the hundreds of billions, if not eventually trillions of dollars, to welcome in millions of the unaudited illegal immigrants? All of them in need of immediate no-questions-asked entitlements for years to come.
-
- FAIR estimated the total federal medical costs for illegal immigration at more than $23.1 billion in 2022 and pegged the costs to cover unpaid hospital bills for uninsured illegal migrants at about $8.2 billion.
- The FAIR study estimates the gross cost of illegal immigration in the United States is $183 billion annually, up more than 35.7 percent since 2017.
- The cost incurred for each illegal migrant, including their U.S.-born children, has increased to $8,776 annually.
READ MORE:
California Hospitals Slammed As Illegal Immigration Costs Soar – Authored by Brad Jones and John Fredricks via The Epoch Times.
-
- Government, Social Assistance, & Health Is Over 100% Of Job Creation In These 3 ‘Progressive’ States -The welfare state is booming, especially in the sanctuary states.
GLOBAL ECONOMIC INDICATORS: What This Week’s Key Global Economic Releases Tell Us
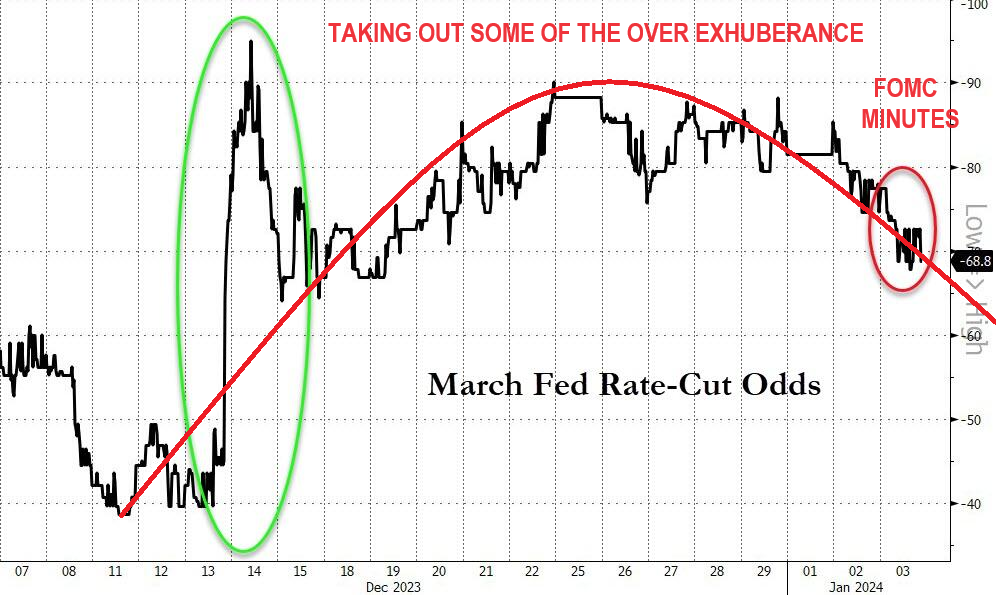
“So Much for the March Rate Cut!”
 LABOR REPORT – DECEMBER 2023
If one believes the headlines, in December the US added 216K payrolls, (which included a record number of double-counted multiple jobholders), and yet the number of employed workers actually crashed by 683K, the biggest drop in 4 years. Furthermore, taking a closer look at the composition we find that in December, the number of well-paid, full-time workers collapsed by a near record 1.5 million, offset by a 762K surge in part-time workers. As for the balance, it was the 222K people who discovered last month that to keep up with the economic miracle that is Bidenomics. They need to work at least one more job.
1- HOUSEHOLD SURVEY EMPLOYED WORKERS: -683K
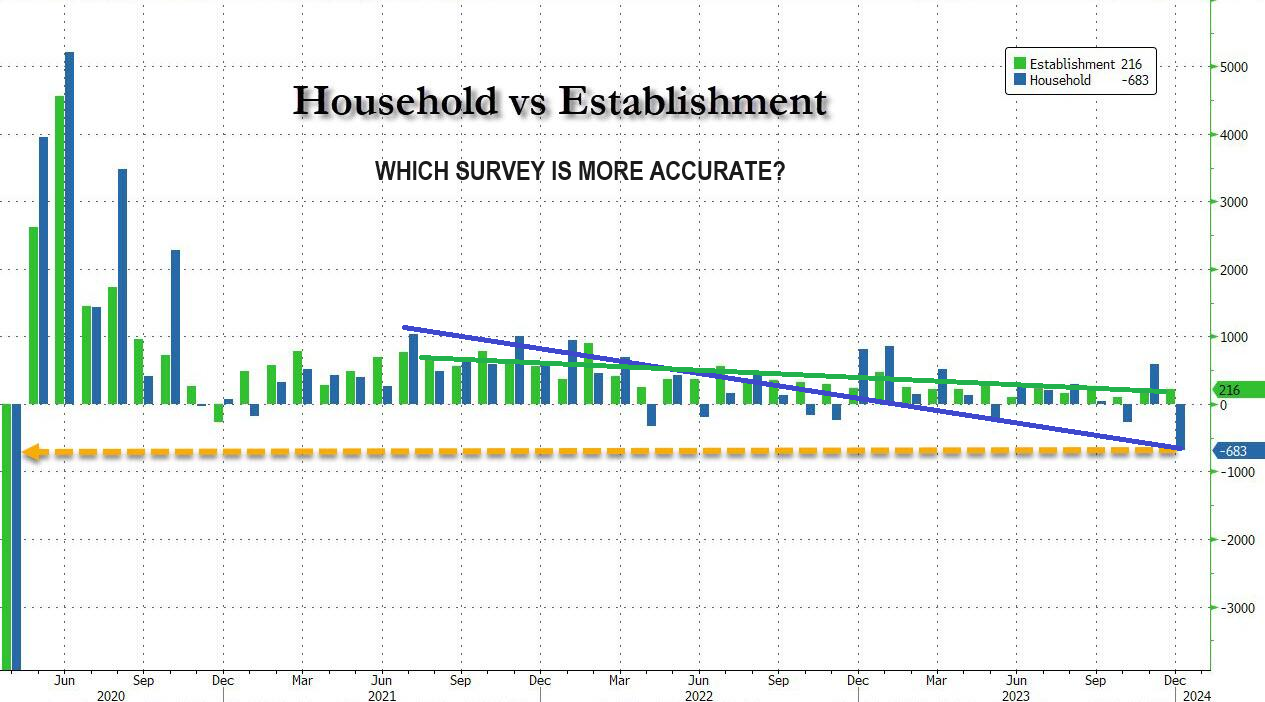 The monthly nonfarm payrolls (from the Establishment Survey) may have been weak at 216K, but the far more accurate Household Survey showed that the number of Employed workers actually collapsed by an unprecedented 683K, the biggest drop since the US economy was shutdown by Covid!
The BLS reported that in December the number of full-time jobs plunged by 1.531 million to 133.2 million, the biggest monthly drop since the record Covid crash of 14.7 million jobs! Off-setting the plunge, and sure enough, it was all in the surge of part-time workers.
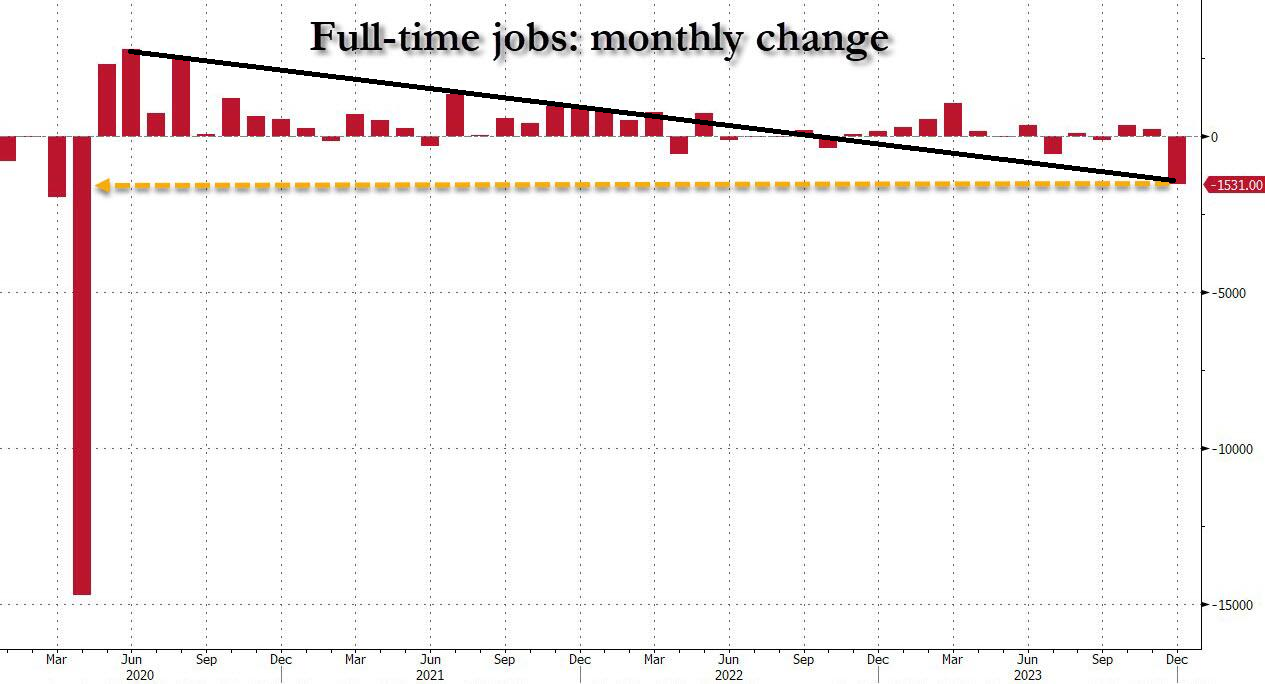 2- LOST FULL TIME WORKERS
SINCE 2023: – 34K
Since February of 2023, the US has not added a single full-time job, (in fact it has lost 34,000), while adding 774 part-time jobs!
3- PART TIME WORKERS: +762K
In December, the number of part-timers soared by a whopping 762,000, the second highest monthly increase since the Covid lockdowns, to 27.794 million, the highest print since March 2018!
4- MULTIPLE JOB HOLDERS: +222k
Looking at the number of multiple jobholders – those workers who have to work more than one job at a time to make ends meet. In December, that number surged by 222K, and at 8.565 million was the highest print on record!
OFFICIALLY REPORTED
NFP:
The US labour market added 216k jobs in December, up from the prior 173k (revised down from 199k), a surprise gain with expectations for a fall to 170k. In the household survey, the unemployment rate was unchanged at 3.7%, despite expectations for a rise to 3.8%, but the labour force participation saw a notable decline to 62.5% from 62.8%.
-
- Meanwhile, the number of those employed in the household survey tumbled 683k.
- The wages metrics were also on the hotter side, with M/M earnings rising 0.4% (exp. 0.3%), maintaining the pace in November while Y/Y earnings rose 4.1%, above the 3.9% forecast and accelerating from the 4.0% prior.
- On the face of it, the report was hotter than expected with the NFP and wages above expectations, while the unemployment rate remained the same, albeit accompanied by a drop in the participation rate.
- However, some dovish aspects are the downward revision to the headline (again) and while government payrolls were strong, some suggest this is unsustainable.
- Also, WSJ’s Timiraos highlights the latest revisions to payrolls show the three month average for private sector hiring was 115k in December, matching the lowest level since the economy reopened in 2020.
- The sharp drop in the household survey employment also received a lot of attention. Markets have been leaning towards favouring a March cut, but the implied probability has decreased slightly since the data.
- At pixel time, markets are assigning a c. 60% probability of a 25bp cut in March, vs c 70% pre-data.
- The Fed will likely continue to hammer home that markets are ahead of themselves in Fed pricing, but there is still plenty of data due with attention now turning to the US CPI next Thursday 11th Jan.
EXPECTATIONS
Headline Nonfarm Payrolls are expected to rise by 170k, easing from the prior 199k, which was buoyed by the return of striking auto workers.
-
- However, analyst expectations are wide, varying between 80k and 225k.
- The unemployment rate is seen rising to 3.8% from 3.7%, with ranges between 3.6-3.9%.
- On earnings, the M/M is seen rising 0.3%, easing from the 0.4% prior, with expectations between 0.1 and 0.4% while the Y/Y is expected to ease to 3.9% from 4.0%, with analyst forecasts ranging between 3.8% and 4.2%.
- The NFP data will be used by both Fed and market participants to gauge when it will be appropriate for the Fed to first cut rates. Markets are currently leaning towards the first cut in March, but the Fed has been attempting to dial back these expectations.
CONTINUING JOBLESS CLAIMS – JOLTS, HIRING & QUITS
-
 Labor market proxies saw jobless claims hot around 206k, while the 4wk average for December was 208k vs the 220k average in November.
- The ISM Manufacturing Employment print was above expectations, but still in contractionary territory,. This is closer to neutral than what was seen in November.
- Challenger layoffs eased while the ADP report was hotter than expected on the headline, but the wages metrics had cooled.
- Meanwhile, the November JOLTS report showed a cooling labour market.
JOBLESS CLAIMS:
-
- Initial jobless claims for the week ending 30th December fell to 202k from the prior, upwardly revised, 220k and shy of the expected 216k.
- Meanwhile, the 4wk jobless claims average dipped to 207.75k from 212.5k, with continued jobless claims (w/e 23rd Dec.) declining to 1.855mln (exp. 1.883mln, prev. 1.886mln).
- Note, the seasonal factors had expected an increase of 17,136 (or 6.2%) from the prior week.
- As always, the usual caveats apply to the volatile holiday season figures and any potential distortions in addition to the fact it is the last reading of 2023 figures.
- Pantheon Macroeconomics further highlights the point noting “Claims numbers are always volatile around the turn of the year, so doubt that the latest numbers are indicative of the underlying trend.”
JOLTS
-
- Job Openings in November fell to 8.79mln from an upwardly revised 8.852mln, beneath expectations of 8.85mln, the third consecutive decline.
- New Hires declined 363k to 5.5m.
- Quit rate fell to 2.2% from 2.3%.
- Analysts at Oxford Economics highlight that the ratio of job openings to unemployed workers rose to 1.4 from 1.36.
- However, the consultancy looks at the three-month average as the denominator of the ratio using the number of unemployed in the household survey, which can be quite volatile M/M.
- The 3 month average fell to 1.41 from 1.44 in October, the lowest since September 2021, but notes that it is still elevated. OxEco highlights a ratio of 1.0 is more consistent with a balanced labour market, “but the decline is consistent with weakening labor demand and a slower pace of hiring in the months ahead.”
- Overall, the report is a dovish one and adds to signs of a cooling labor market after remarkable strength throughout the Fed’s tightening cycle.
- OxEco suggest the data should allow the Fed to bring its first rate cut forward to May or June this year. Currently, the market is pricing in the first rate cut in March with a c. 80% probability.
ADP:
-
- The ADP national employment report saw the headline beat at 164k (exp. 115k), accelerating from the prior 101k and towards the top end of the forecast range between 60-175k.
- Meanwhile, the wages components saw the median change in annual pay for job stayers ease to 5.4% from 5.6%, while for job changers it eased to 8.0% from 8.3%.
- The report also added that “While wages didn’t drive the recent bout of inflation, now that pay growth has retreated, any risk of a wage-price spiral has all but disappeared.”
CHALLENGERS LAYOFFS:
- Challenger layoffs for December fell to 34.817k from 45.51k, ahead of the US payrolls report on Friday.
- Andy Challenger, workplace and labor expert and Senior Vice President of Challenger, Gray & Christmas, Inc said “Layoffs have begun to level off, and hiring has remained steady as we end 2023.”
- Challenger added, “That said, labor costs are high. Employers are still extremely cautious and in cost-cutting mode heading into 2024.
- The hiring process will likely slow for many job seekers and cuts will continue in Q1, though at a slower pace.”
FOMC MEETING
 The December Meeting Minutes had both dovish and hawkish aspects. The Minutes confirmed that members generally viewed the addition of the word “any” to comments on possible additional firming as relaying their judgement that rates were likely at or near the peak of the cycle.
HIGHLIGHTS:
-
- FOMC Minutes stated that participants viewed the policy rate as likely at or near its peak. A number of participants highlighted uncertainty around how long restrictive policy would need to be maintained.
- Several participants observed that circumstances might warrant keeping the policy rate at the current level longer than they currently anticipate. Participants generally reaffirmed it would be appropriate for policy to remain restrictive until inflation was ‘clearly moving down sustainably’.
- Several participants remarked that the Committee’s balance sheet plans indicated that it would slow and then stop the decline in the size of the balance sheet, when reserve balances are somewhat above the level judged consistent with ample reserves. These participants suggested that it would be appropriate for the Committee to begin to discuss the technical factors that would guide a decision to slow the pace of runoff, well before such a decision was reached in order to provide appropriate advance notice to the public.
NOTES;
-
- A number of participants highlighted uncertainty around how long restrictive policy would need to be maintained with participants pointing to downside risks the economy faces with an overly restrictive stance.
- Meanwhile, participants also noted that their outlooks were associated with an unusually elevated degree of uncertainty, and it was possible that the economy could evolve in a manner that would make further increases in the target range appropriate. Several observed that circumstances might warrant keeping the policy rate at the current level for longer than currently anticipated.
- On the balance sheet, several suggested it would be appropriate to begin discussing the technical factors about slowing the balance sheet run-off, well before such a decision was reached.
- On the economy, participants forecast that upside risks to inflation have diminished, and several observed the ongoing rebalancing of labor supply and demand would help reduce core services inflation.
- Several also assed that housing services inflation would fall further over time.
- Several on the FOMC noted that longer-term inflation expectations remained well anchored, and that near-term inflation expectations of households had declined recently.
- Many highlighted the decline in job openings and a few remarked on the lower quits rate. Several said that the risk is if the labor market could transition quickly from a gradual easing to a more abrupt downshift in conditions.
- Meanwhile, the staff economic outlook was broadly similar to the projection prepared for the prior meeting.
- There was little within the minutes to suggest when rate cuts could start to occur, aside from what the SEP showed in December that almost all participants indicated their baseline implied a lower FFR would be appropriate by the end of the year.
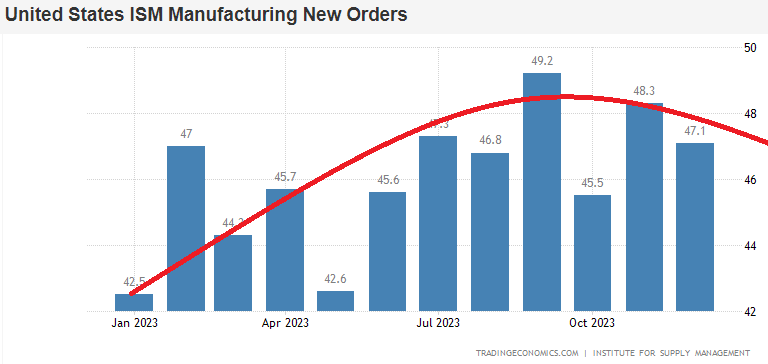 ISM MANUFACTURING
-
- US ISM Manuf New Orders Idx (Dec) 47.1 (Prev. 48.3)
- US ISM Manufacturing PMI (Dec) 47.4 vs. Exp. 47.1 (Prev. 46.7)
- US ISM Manuf Prices Paid (Dec) 45.2 vs. Exp. 47.5 (Prev. 49.9)
- US ISM Manuf Employment Idx (Dec) 48.1 vs. Exp. 46.1 (Prev. 45.8)
GLOBAL MACRO
WHAT DOES YOUR SCAN OF THE DATA BELOW TELL YOU? – THE MEDIA AVOIDS BAD NEWS!
We present the data in a way you can quickly see what is happening.
THIS WEEK WE SAW
Exp=Expectations, Rev=Revision, Prev=Previous
DEVELOPMENTS TO WATCH
STEALTH LIQUIDITY PUMP HAS ONLY $665B LEFT
NOTE: LIQUIDITY BEGINS TIGHTENING WHEN BELOW $700B
The plunge in the reverse repo facility is once again back on, and we can expect that a reversion to the liquidity draining mean is likely to result in Reverse Repo (RRP) sliding to $500BN in a few weeks and all the way to 0 some time in March.
While stocks can and will be buoyant as long as the reverse repo serves as a source of liquidity, but once it is tapped out and bank reserves rediscover gravity (as QT supposedly still has a ways to go), the perverbial sh–t hits the fan and the rubber will hit the road!
This may be especially a problem,if as some speculate, the Fed will be unable to extend the BTFP program which matures in March. It is presently being gamed by banks to arb a risk-free revenue stream courtesy of the Fed. This normally would be expected to guarantee major political pushback against its extension in the coming months. However the completely dysfunctional US Congress might have bigger fish to fry by then?
No matter, the RRP stealth liquidity well is about to run dry!!!
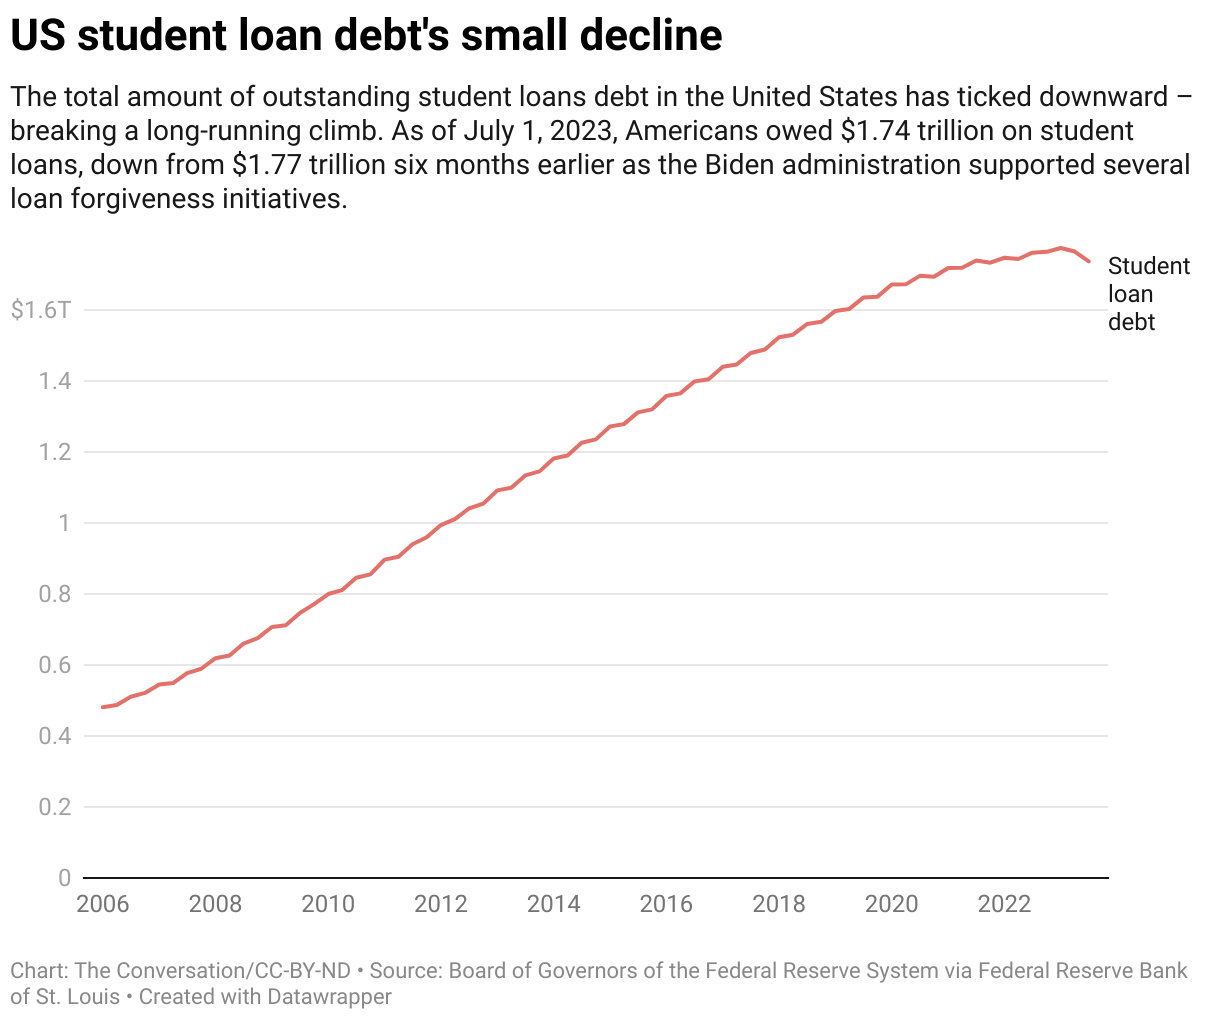
THE 2024 STUDENT DEBT DEBACLE IS COMING
 It’s been three months since the federal government resumed student loan payments, but many borrowers have refused to pay a single penny. It appears student borrowers are staging an unofficial massive student debt strike. They are waiting for, and fully expect, progress on the White House’s student loan forgiveness program. Biden has consistently signaled it is coming, but only to be halted by court action.
22 million borrowers had payments due in October, but only 13 million settled their bills. 40% of borrowers failed to make payments. Before the pandemic, about one-quarter of student loan borrowers were dodging payments. There is no doubt that the road back to loan repayment after more than three years of forbearance was not going to be easy, but Biden’s continuous rhetoric has only seriously manifested the problem.
President Biden initially proposed a $400 billion bailout program that would erase up to $20,000 in federal debt for roughly 40 million borrowers. The Supreme Court struck down the plan in June, claiming that the president overstepped his authority.
Student loans went into forbearance in March 2020 just as Covid-era lockdowns forced millions out of work. Over that period, Americans grew accustomed to not paying back their loans and used the money to tackle other expenses like rent or grocery bills.
Reallocating up to $500 a month to student loan payments was always going to be difficult—especially with high inflation and elevated borrowing costs.
But according to Persis Yu, deputy executive director at the Student Borrower Protection Center, it wasn’t just borrowers who were unprepared for the October shock.
“Neither borrowers nor the student loan system were prepared to resume repayment,” Yu told CNBC. Servicers are overwhelmed and are failing to help struggling borrowers navigate the options that are available to them,”
Carolina Rodriguez of the nonprofit Education Debt Consumer Assistance Program agrees. “Servicers are having a very hard time getting people back into repayment,” she said.
2024 is an election year, and student loan forgiveness is a hotly debated issue, with several conservative lawmakers promising to block any attempts to erase student loans with taxpayer dollars.
ROTATION & RE-BALANCING UNDERWAY
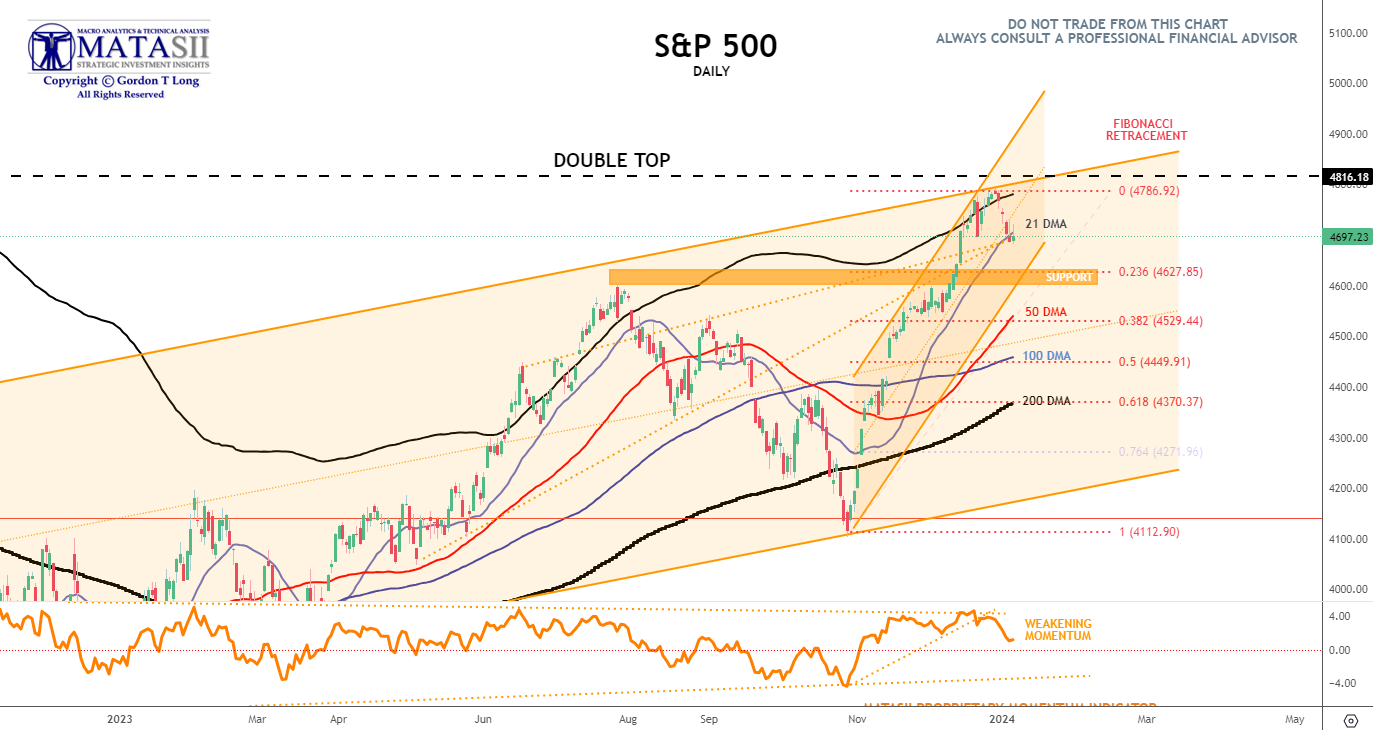
MARKET CONSOLIDATES AS IT LOOKS FOR NEAR TERM SUPPORT
Click All Charts to Enlarge
1 – SITUATIONAL ANALYSIS
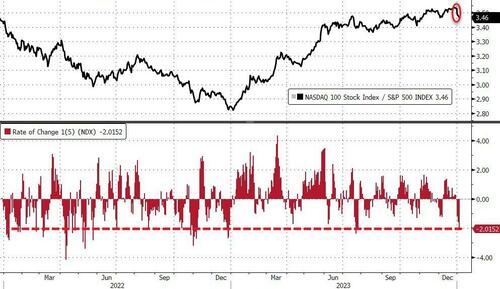 The S&P is down almost 2% – the worst start to a year since 2008. The 200bps underperformance of Nasdaq relative to the S&P 500 in the last 5 days is among the largest in the last two years.
As we expected and previous wrote about, we forecasted arly January to be about two factors:
-
- Capital Gains Selling
- Sector Rotation and Re-Balancing from prior big gains areas, (ie Magnificent Seven) to expectant 2024 Investment Themes
This is now clearly evident.
MAGNIFICENT SEVEN
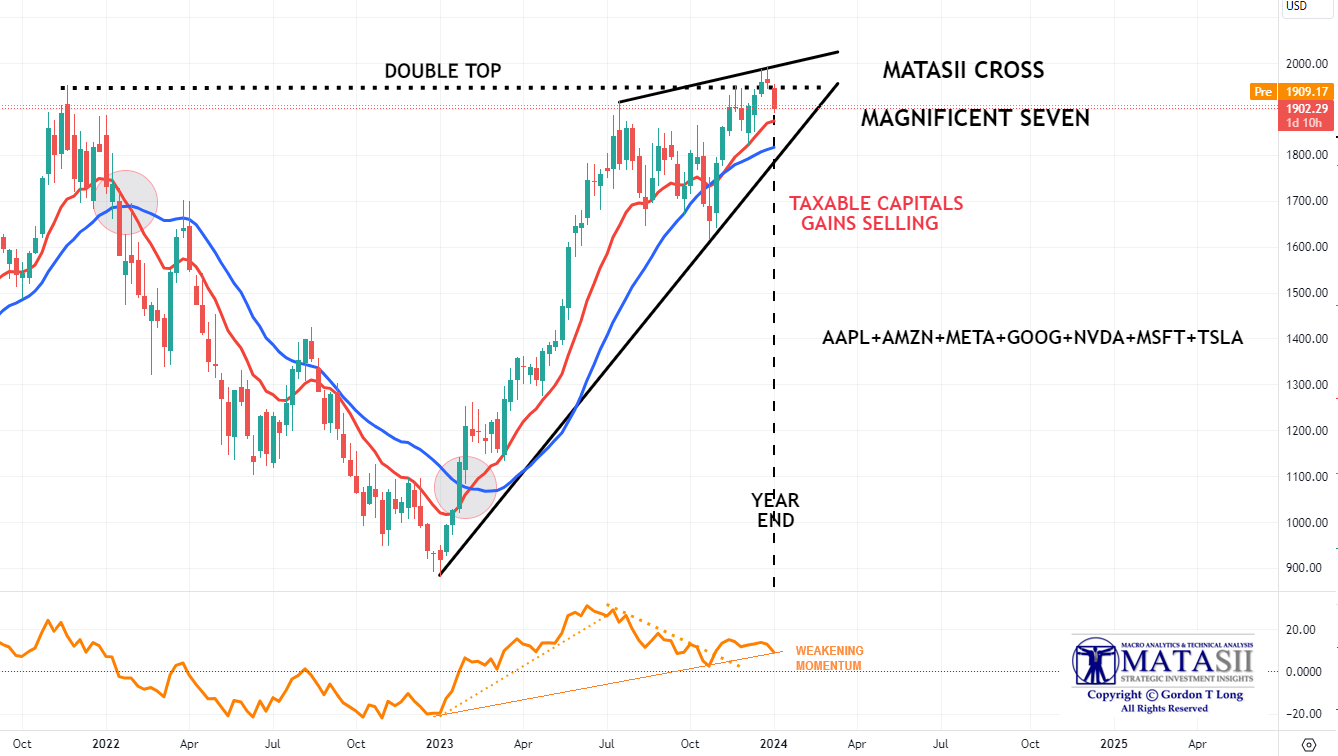 The weakness in the Magnificent Seven is already being interpreted as a prognosis for the S&P 2024 returns with a negative SKEW now reflected in the option futures market.
The Magnificent 7 are showing some noticeable weakness (chart right) as we had expected, with year beginning repositioning and sector rotation. This is likely not yet finished. Like the S&P 500, a touch of the red MATASII CROSS signal indicator (currently a BUY) is likely. Watch the MATASII Proprietary Momentum Indicator for further weakness.
AI (NVDA) & SEMICONDUCTORS
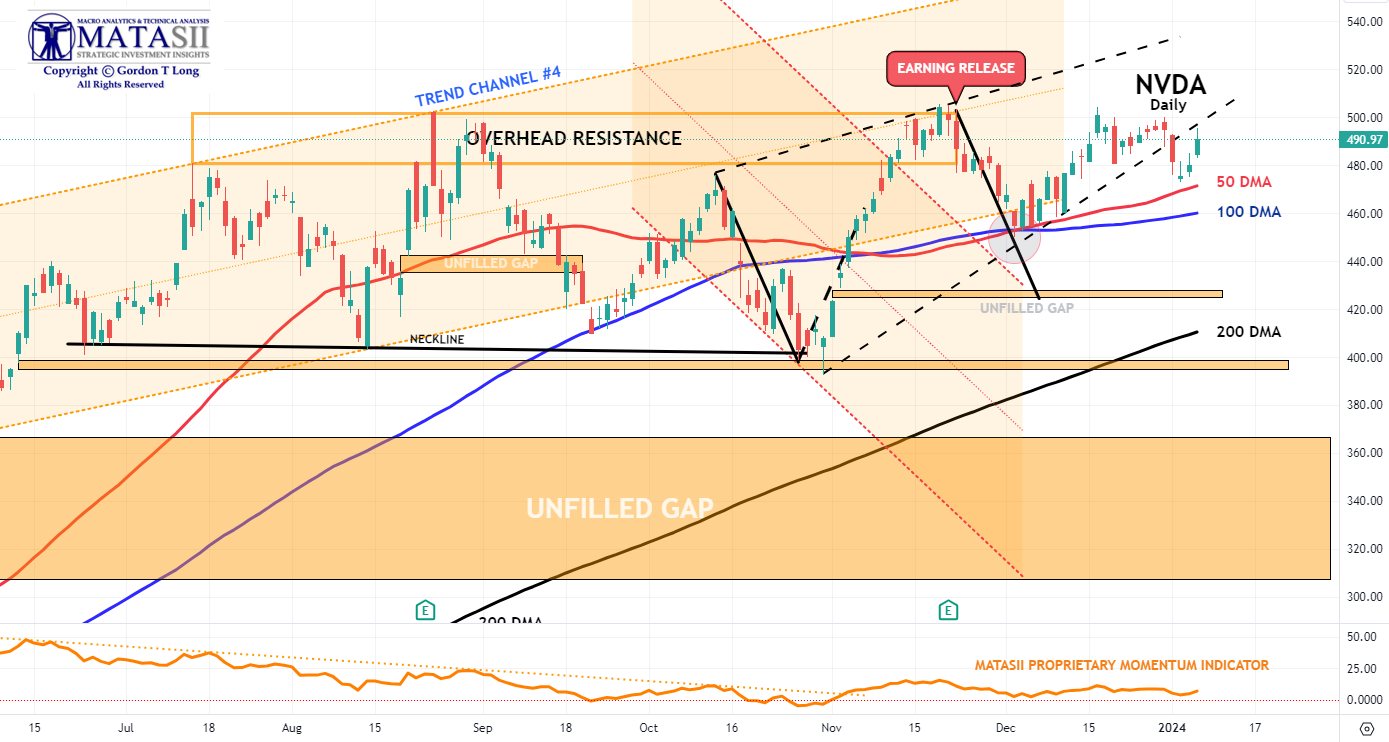 The AI sector can’t paper over semiconductor weakness.
As an example Mobileye, which makes semiconductors for driver-assistance systems in vehicles, plunged ~25% after its revenue outlook missed estimates. Meanwhile ASML shares fell as Netherlands blocked some Chip-Making machine exports, as a global semiconductor tariff and protectionism shows its trade disrupting face. The revocation of export licenses impacts a limited number of Chinese customers, which analysts note could include SMIC, a producer for Huawei among others.
Nvidia appears to looking for support at the 50 / 100 DMA level. We believe the major unfilled gap needs to be filled before NVDA can potentially significantly achieve further gains. Remember the analogy our LINK .
APPLE
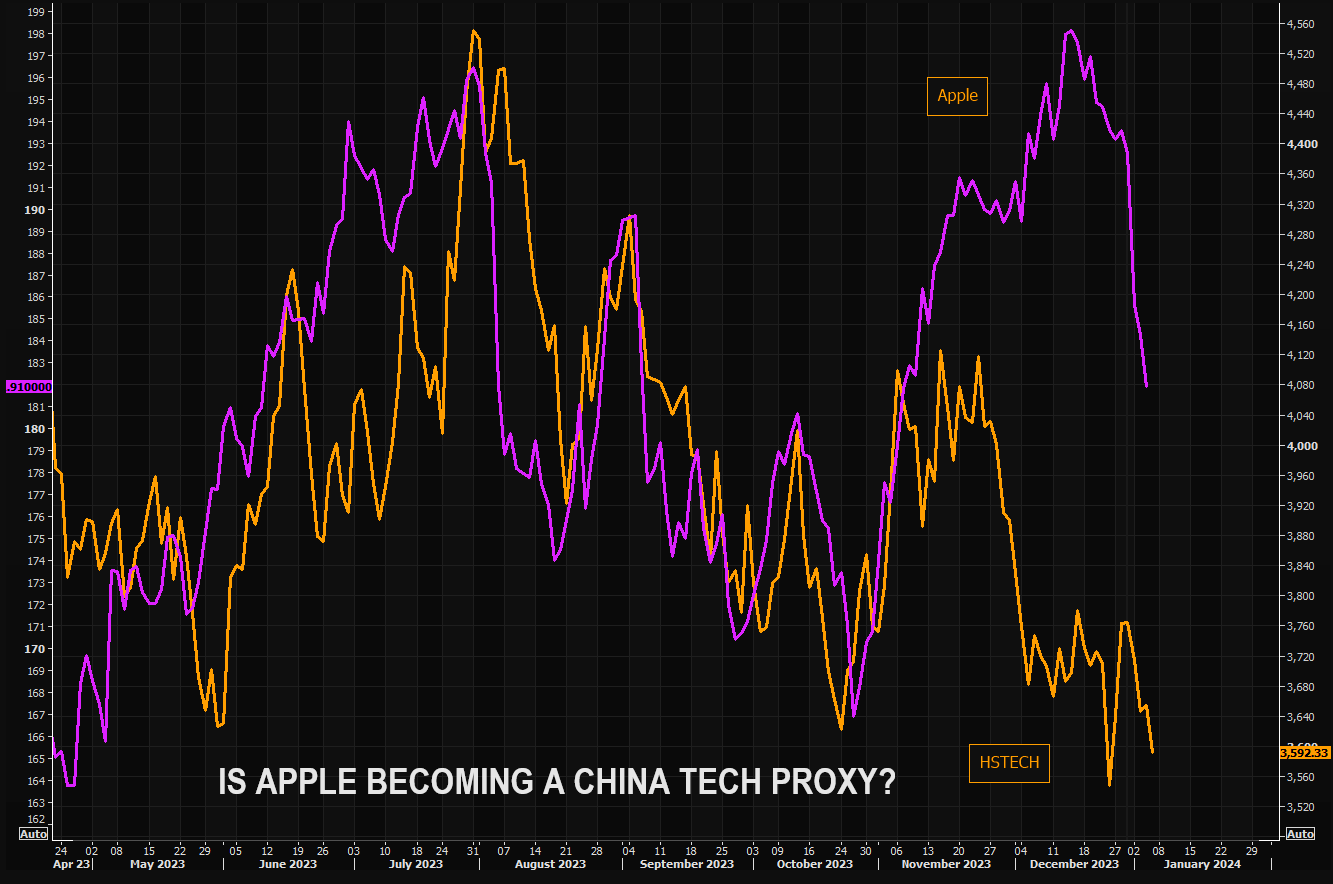 Apple is facing strong headwinds:
-
- Apple tumbled on Barclays downgrade based on cooling iPhone demand. “A continued period of weak results coupled with multiple expansion is not sustainable.”
- Apple was hit with a second downgrade by Piper Sandler on iPhone demand worries saying:
- “We are concerned about handset inventories entering into
- Cited valuation concerns and broader handset and macro weakness in H1 ’24.
- The “Sentimentor” for Apple is approaching must hold levels of “make or break”.
- Analyst concerns are appearing with Apple becoming “a China tech proxy”, seeing this as a more important indicator than fully appreciated.
- Apple’s ugly 2024 start is plagued not only with the downgrades but also muted Foxconn demand. Apple (AAPL) was under pressure amid Foxconn reporting poor sales figures and demand woes.
- To further add to Apple worries, there is a NYT report that the DoJ is nearing an antitrust case against Apple.
2 – FUNDAMENTAL ANALYSIS
 CREDIT ALWAYS LEADS
Long time readers are no doubt familiar with my strong belief that Credit always leads the markets. Like a dog, its tail (the equity market) continues to wag as its nose, ears and eyes detect danger. It is only then that its tail SUDDENLY stops wagging.
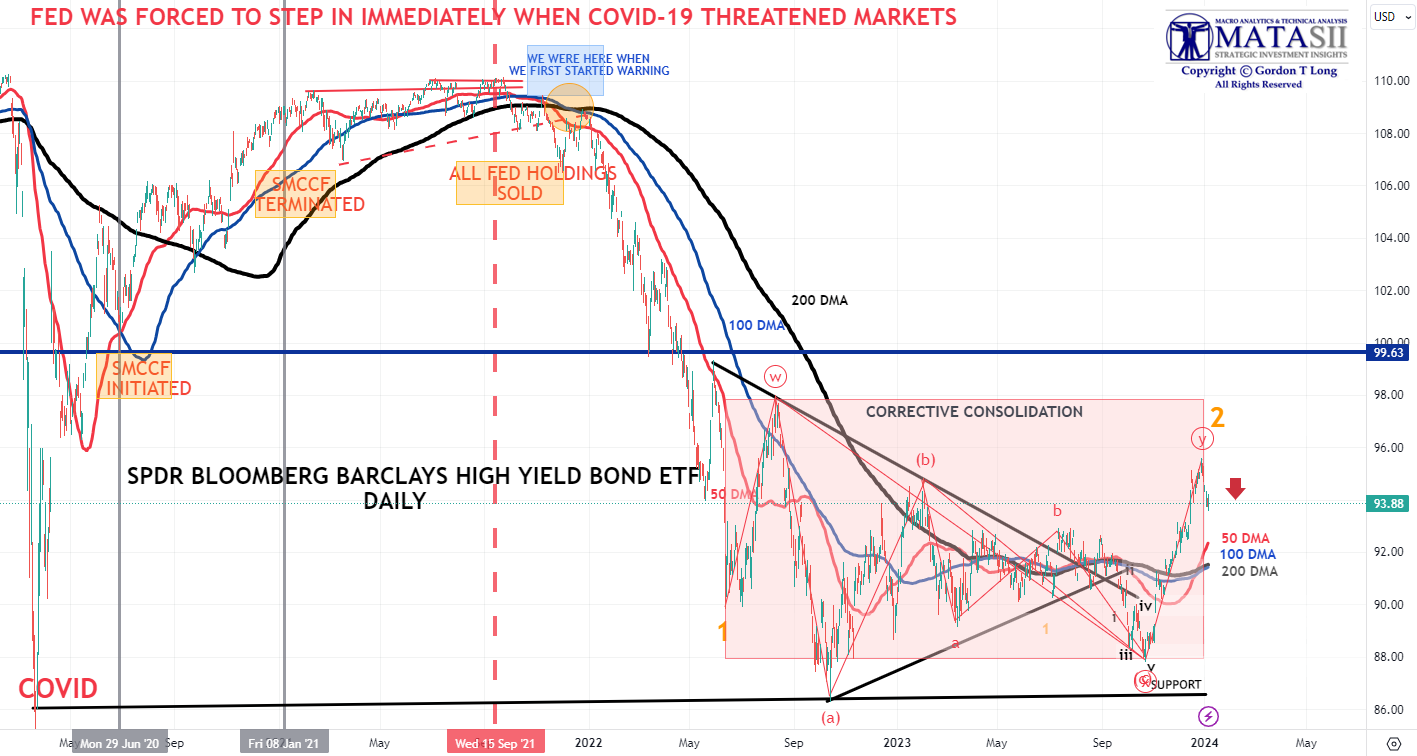
One effective measure of credit problems is through the changing trend of the High Yield Corporate Bond Market or what is often referred to as Junk Bonds.
RISK-OFF
The Junk Market, as represented by the JNK ETF (chart below), is signalling a potential new trend of “Risk Off”.
YOUR DESKTOP / TABLET / PHONE ANNOTATED CHART
Macro Analytics Chart Above: SUBSCRIBER LINK
NOTE: For those wanting to see more on this, I suggest you read Graham Summer’s recent update on the changing JNK Trend. I interviewed Graham Summers years ago and recall introducing him to “Credit Always Leading” in our off-air discussion.
3 – TECHNICAL ANALYSIS
The Equity Markets are reacting to:
-
- When YIELDS RISE stocks normally FALL
- When the US$ RISES stocks normally FALL
- When BOTH YIELDS and US$ RISE together, stocks almost always FALL
US TREASURY MARKET – YIELDS
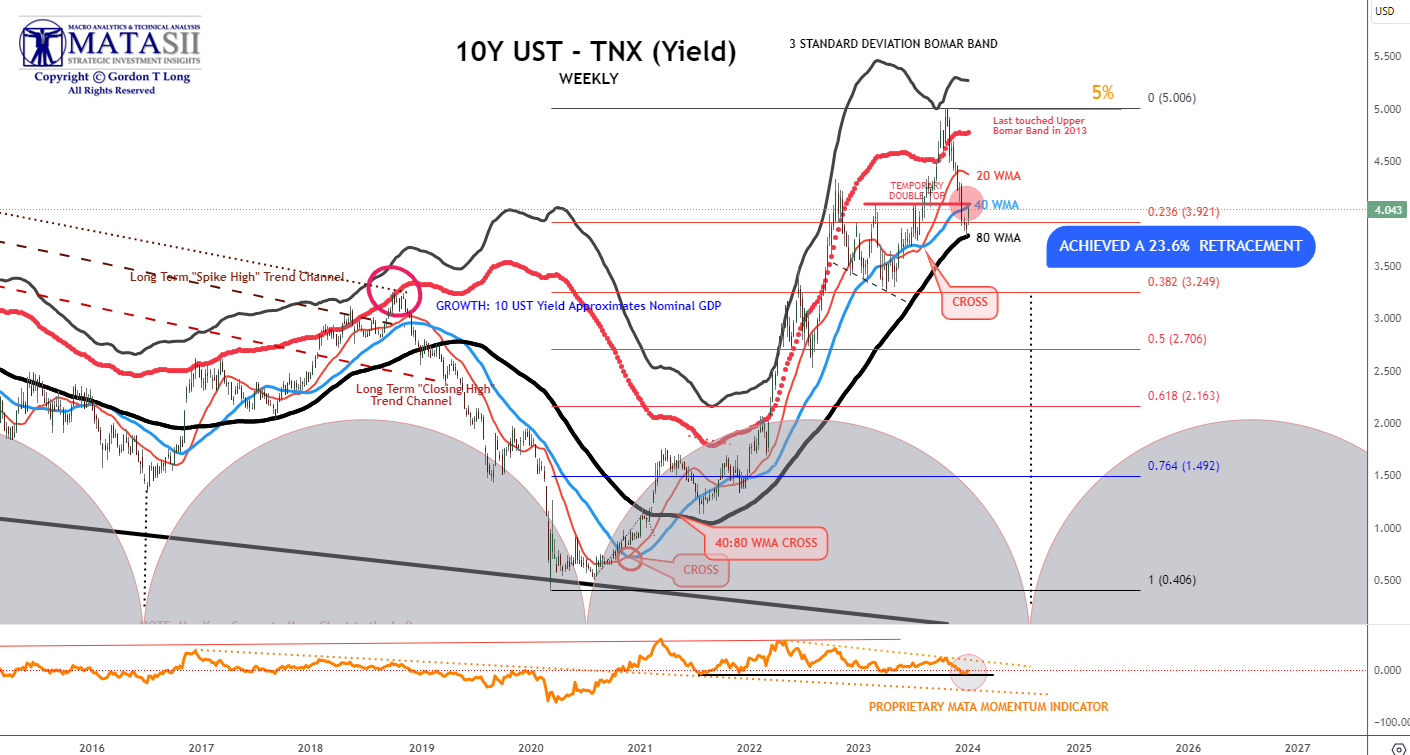
10Y US TREASURY YIELD – “TNX” – WEEKLY
 The Weekly 10Y Treasury Yield found initial support at its 80 WMA. The expected consolidation lifts have taken yields back to the 40 WMA overhead resistance. This level also matches the double top we experienced in early 2023.
CHART RIGHT: The 10 year is well above the negative trend channel and the 21 day post the NFP numbers. 50 day at 4.30%. Swaps pricing March rate cut back to 50/50 odds post the NFP.
YOUR DESKTOP / TABLET / PHONE ANNOTATED CHART
Macro Analytics Chart Above: SUBSCRIBER LINK
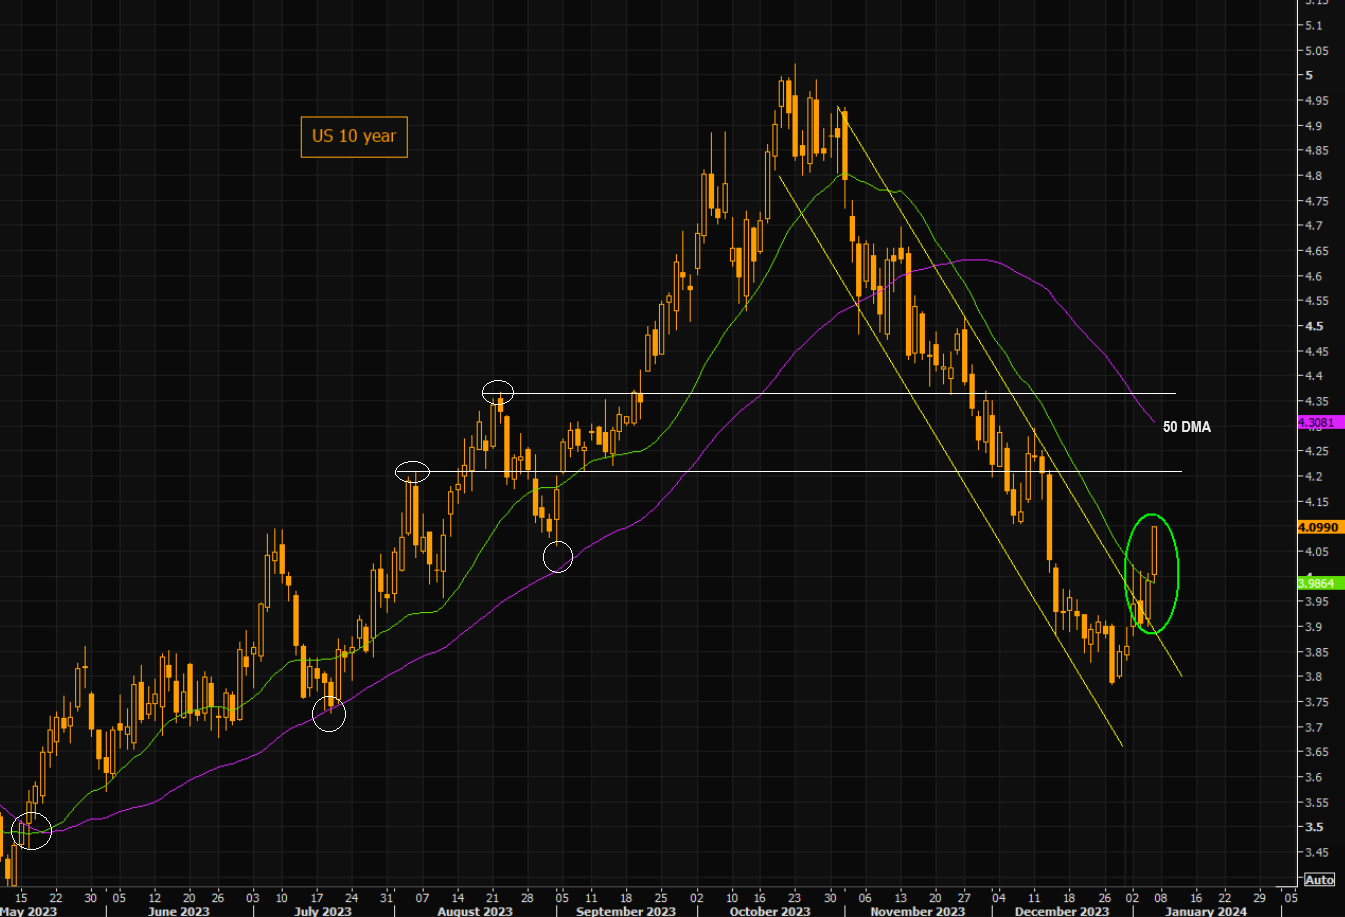
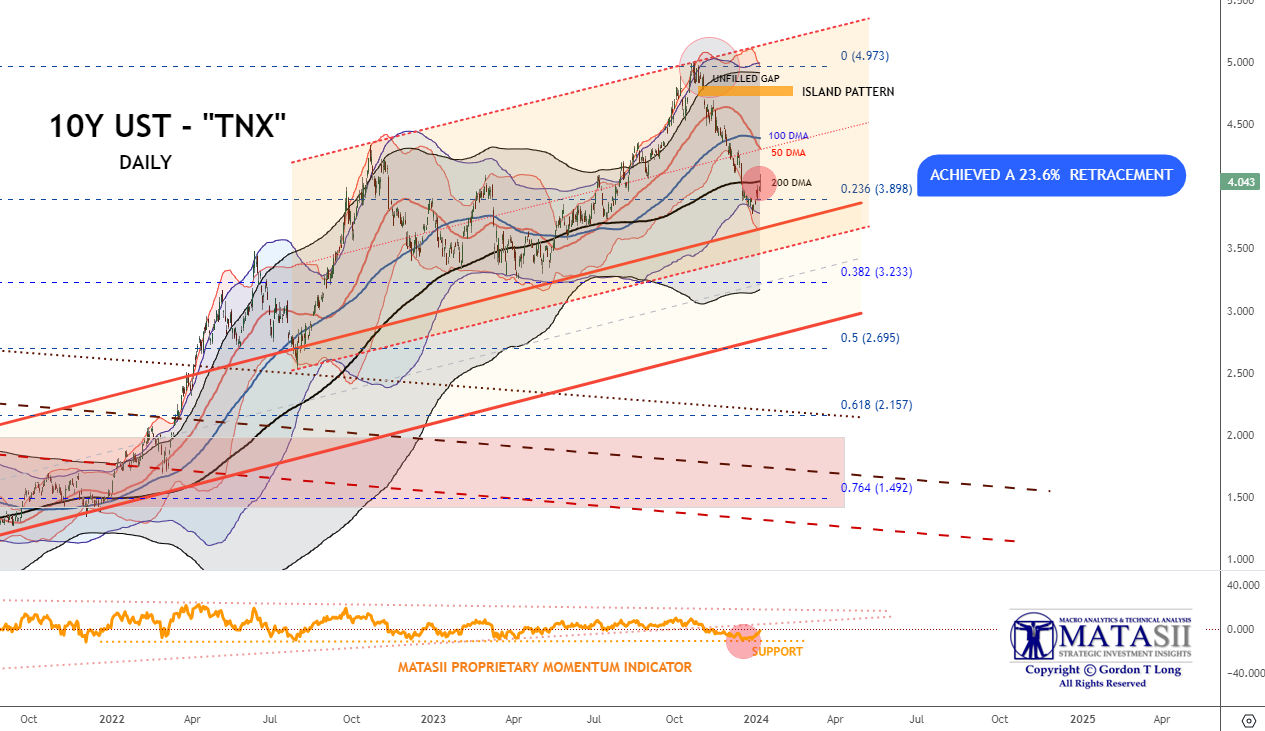
10Y US TREASURY YIELD – “TNX” – DAILY
The TMX on a Daily basis has bounced back towards overhead resistance at the 200 DMA. This consolidation is likely not complete until the rapidly falling 50 DMA is touched by rising yields. We suspect the merging will likely be in the 4.20-4.25% range.
YOUR DESKTOP / TABLET / PHONE ANNOTATED CHART
Macro Analytics Chart Above: SUBSCRIBER LINK
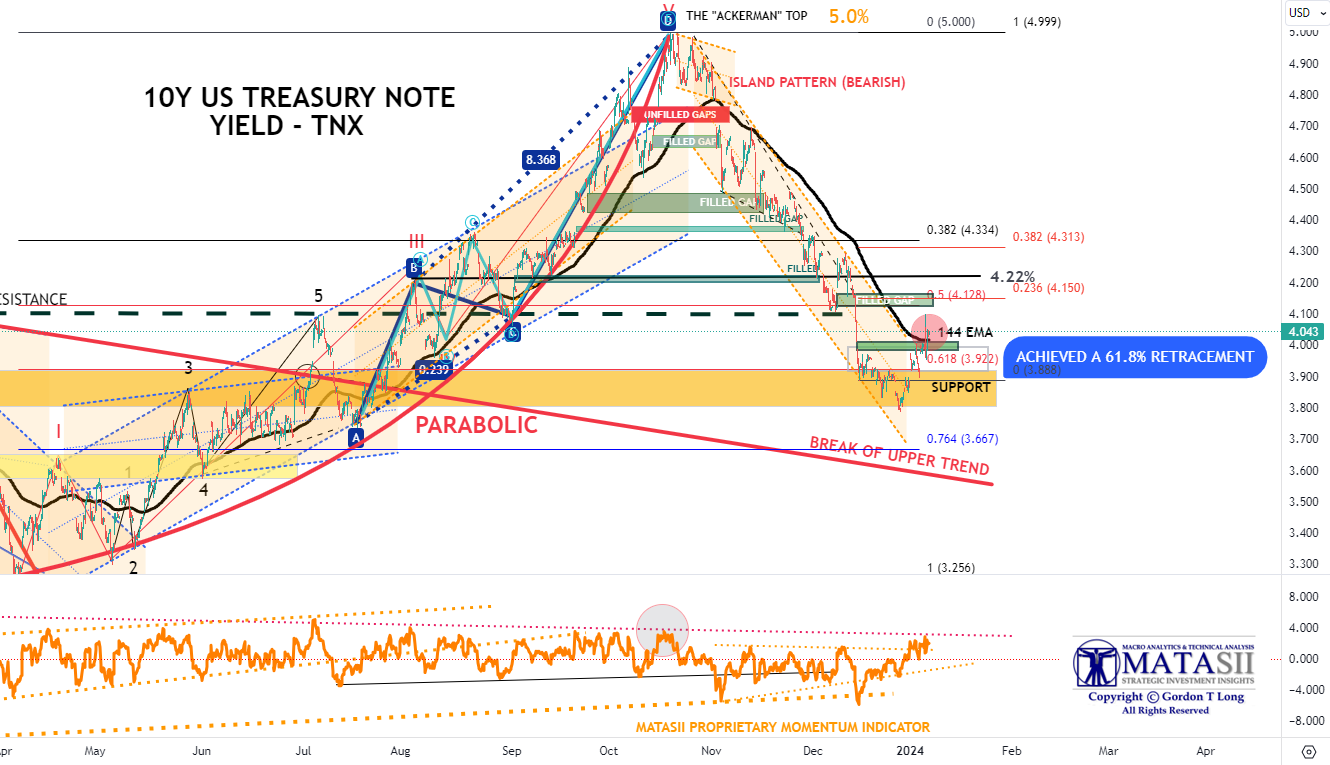
10Y US TREASURY YIELD – “TNX” – HOURLY
The TNX Hourly reached up to touch the falling 144 EMA (black line), which we had previously suggested was highly likely and filled the previously unfilled gap (now shown in green). Since then, Yields have risen further and would appear a reach upward to 4.22% (black horizontal line from a previous major resisting top & a bottom support) is likely.
NOTE: Our sense is that an Unemployment level of 4.0% would break yields strongly lower. A 3.7 to 3.8% is likely to see yields crawl higher.
YOUR DESKTOP / TABLET / PHONE ANNOTATED CHART
Macro Analytics Chart Above: SUBSCRIBER LINK
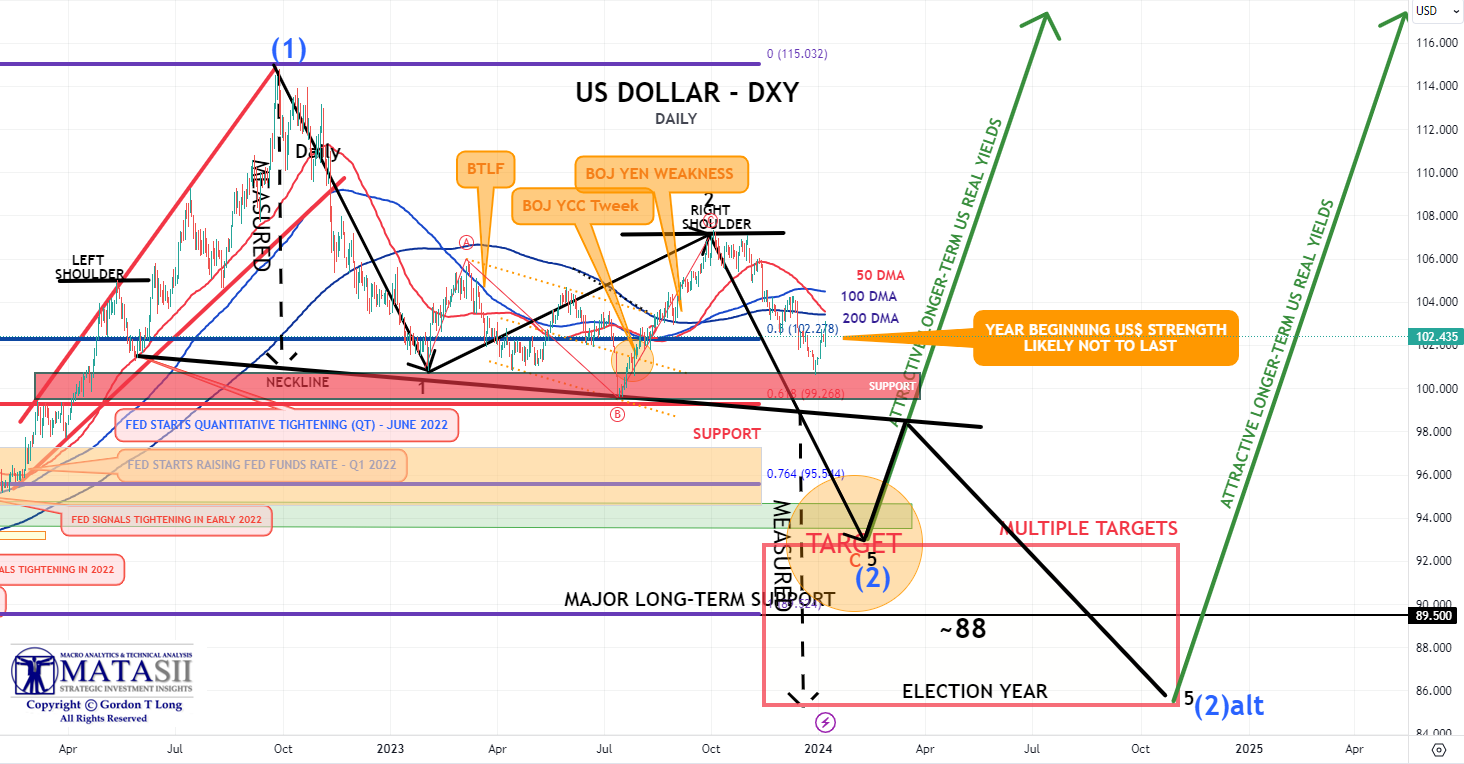
CURRENCY – US$
The US Dollar is showing year beginning strength. THIS IS LIKELY NOT TO LAST.
A Break of the 50 DMA (red) through the 200 DMA (black) is a strong BEARISH signal for institutional position players.
YOUR DESKTOP / TABLET / PHONE ANNOTATED CHART
Macro Analytics Chart Above: SUBSCRIBER LINK
US EQUITY MARKETS
CONTROL PACKAGE
There are FIVE charts we have outlined in prior chart packages that we will continue to watch closely as a “control set” over the next 10 days.
-
- The Russell 2000 through the IWM ETF (CHART LINK),
- Nvidia (NVDA) (CHART LINK)
- The DJIA (CHART LINK)
- The S&P 500 (CHART LINK)
- The MAGNIFICENT SEVEN (CHART ABOVE WITH MATASII CROSS – LINK)
YOUR DESKTOP / TABLET / PHONE ANNOTATED CHART
Macro Analytics Chart Above: SUBSCRIBER LINK
FAIR USE NOTICE This site contains copyrighted material the use of which has not always been specifically authorized by the copyright owner. We are making such material available in our efforts to advance understanding of environmental, political, human rights, economic, democracy, scientific, and social justice issues, etc. We believe this constitutes a ‘fair use’ of any such copyrighted material as provided for in section 107 of the US Copyright Law. In accordance with Title 17 U.S.C. Section 107, the material on this site is distributed without profit to those who have expressed a prior interest in receiving the included information for research and educational purposes. If you wish to use copyrighted material from this site for purposes of your own that go beyond ‘fair use’, you must obtain permission from the copyright owner.
NOTICE Information on these pages contains forward-looking statements that involve risks and uncertainties. Markets and instruments profiled on this page are for informational purposes only and should not in any way come across as a recommendation to buy or sell in these assets. You should do your own thorough research before making any investment decisions. MATASII.com does not in any way guarantee that this information is free from mistakes, errors, or material misstatements. It also does not guarantee that this information is of a timely nature. Investing in Open Markets involves a great deal of risk, including the loss of all or a portion of your investment, as well as emotional distress. All risks, losses and costs associated with investing, including total loss of principal, are your responsibility.