Gordon T Long
Global Macro Research | Macro-Technical Analysis
MACRO
US MONETARY POLICY
STEALTH LIQUIDITY STAGE II – THE ELECTION YEAR SET UP
OBSERVATIONS: Americans Will Soon Be Asking Whether They Are Better Off Come This Election.
From his first hours in office, Biden has waged a relentless war against American energy, canceling pipelines, leases and permits, while throwing up countless regulatory barriers. That has greatly elevated the cost of energy, which has increased costs throughout the economy.
If Biden had simply done nothing upon taking office and allowed the one-time emergency spending from COVID to expire, the budget would be balanced by now. Instead, he has constantly pushed for more spending, creating war-time level spending and institutionalized multi-trillion-dollar annual deficits.
To pay for this runaway spending spree, the Federal Reserve created trillions of dollars out of nothing, which quickly devalued purchasing power in less than three years as inflation hit 40-year-highs.
So, though Government, Healthcare & Corporate employed Americans earn more today, their larger paychecks actually buy them less. The rest are using their food stamps at Dollar Store.
-
- For 28 of the last 32 months, inflation has outpaced the growth of average weekly earnings.
- Compared to when Biden took office, the public is paying 20 percent more for food and 38 percent more for gasoline.
- It costs 28 percent more to keep your home warm this winter. (These are the Biden administration’s own figures).
- Credit-card debt is at a record $1.1 trillion, and 25 percent of Americans haven’t paid off the debt they acquired from Christmas shopping—in 2022.
- The monthly mortgage payment on a median price home has doubled under the Biden Administration. It costs a family an extra $12,000 per year for the same house.
- For the typical American family, the combination of falling real earnings and higher borrowing costs has been equivalent to losing $6,800 in annual income.
- Just two years of regulatory rulemaking under Biden have cost the average American household about $9,600, compared to about $8,300 for the same time under Obama. Conversely, regulatory costs went down $11,000 for the average American household over the four years of Donald Trump’s presidency.
Unable to make ends meet, a record number of Americans have resorted to getting second or third jobs. That’s also making the touted employment statistics look better than they are by increasing the number of payrolls without increasing the number of people employed.
Americans, have depleted their savings and gone deeply into debt to keep the lights on. So as elections loom, Americans will ask the question whether they are better off than they were before Bidenomics. I wonder what the answer will be???
WHAT YOU NEED TO KNOW!
 CREDIT LEADS: Why The Risk-On Exuberance?
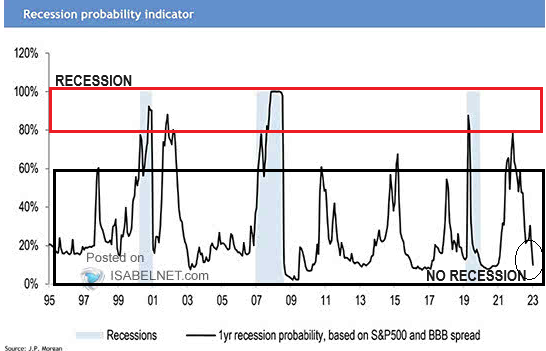
Long time readers are well aware that I have found that Credit historically always leads the markets. There are many ways of measuring credit, so it is about the ‘preponderance’ of the evidence. That said, a typically reliable metric is the spread between the S&P 500 and “BBB” corporate credit rate (chart right). It is pretty clear that this credit metric is now not even close to pricing in a recession after retreating heavily throughout 2023, primarily from stealth liquidity being pumped into the system! Corporate lenders & borrowers have taken full advantage!
You should also note this metric has a history of changing direction violently! Markets translate this as a Risk-On in the short to Intermediate term.
REMINDER: Soft Landings are an extremely rare event.
RESEARCH
STEALTH LIQUIDITY – Stage II Set-Up
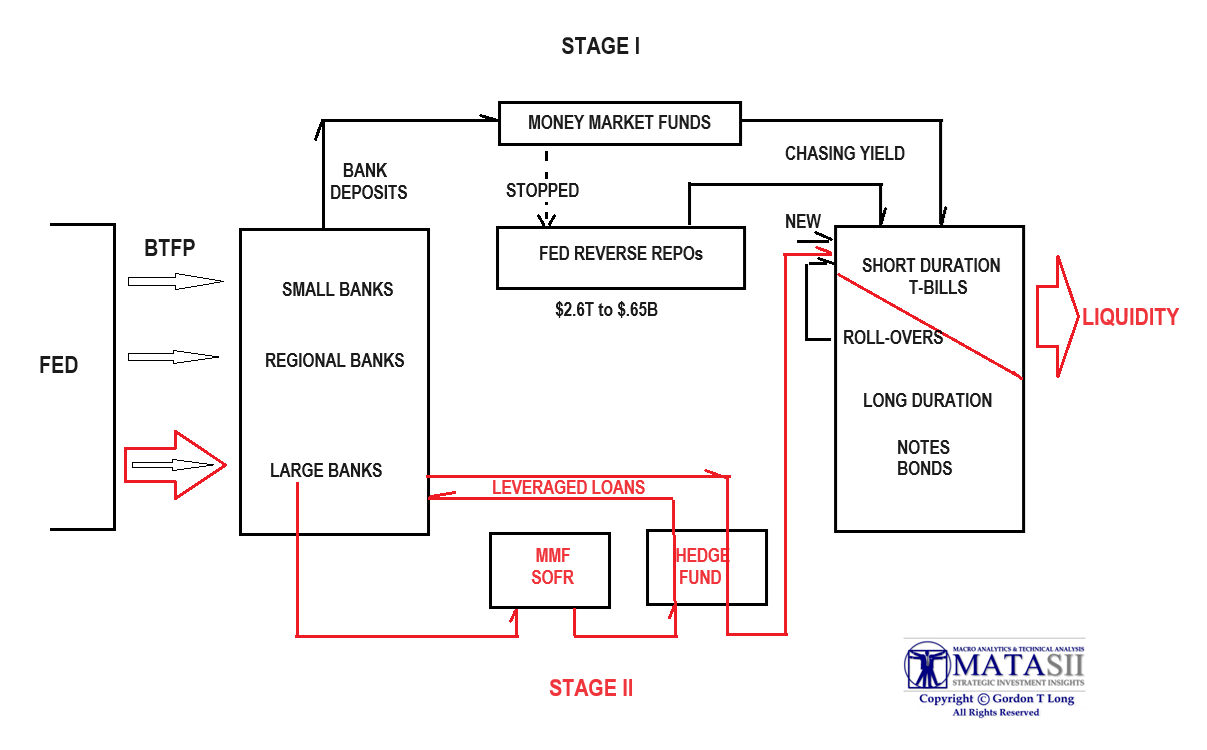
STAGE I – Post BTFP
-
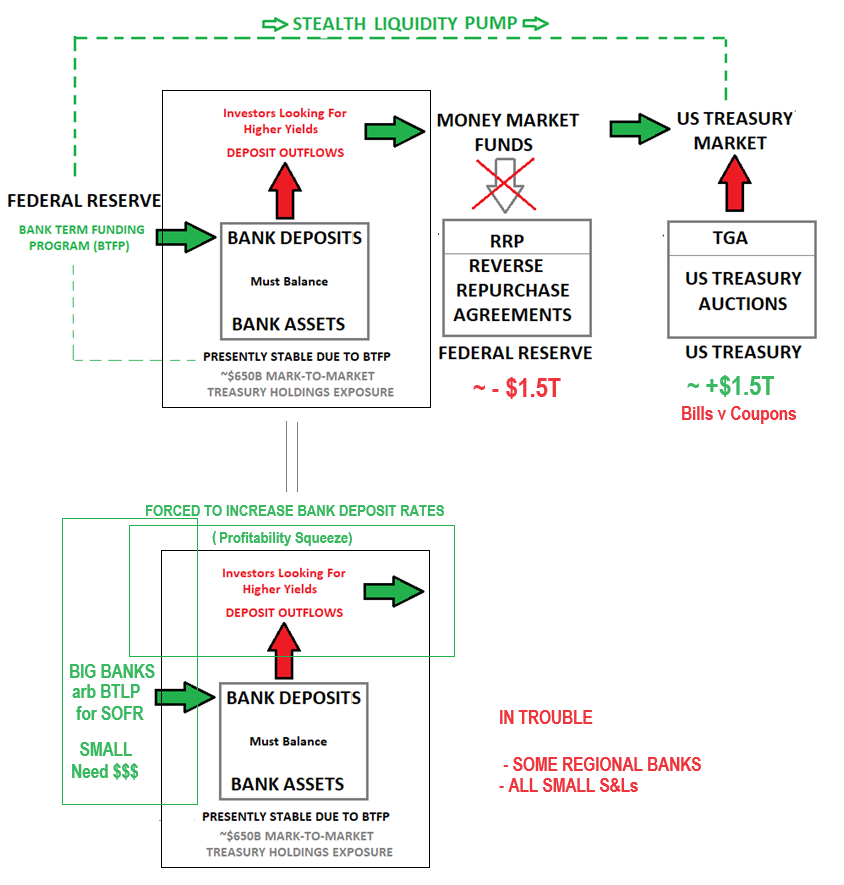
- By maintaining the issuance of high yielding short term T-Bill paper, this has become the dominant means of paying government deficit funding and rollovers. By doing this, Secretary Yellen has kept long duration coupons from rising. The cost is high government interest costs. Powell and Yellen are using US debt interest payment to fund “stealth” liquidity.
-
- Deposits fleeing the Banks to Money Funds was used by MMF to buy short term US Treasury T-Bills.
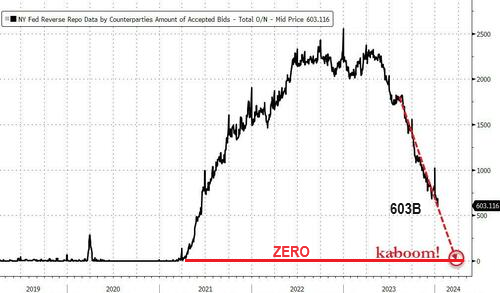
- RRP’s are sold to fund higher paying short term US Treasury T-Bills. RRP depletes from $2.6T to $650B and is still falling
- Yellen by employing T-Bills versus Long Term Coupon Notes/Bonds to fund the government, is effectively using excess US Government debt interest payments to fund the government and stealth liquidity.
STEALTH LIQUIDITY II – Yellen’s Political Role
STAGE II – Recent Surge in BTFP Lending By Large Banks
-
- Banks Using the BTFP – IOFR Spread allows banks to pocket the spread (free money).
- Banks place the earned spread Asset on deposit with Hedge Funds (a liability), who then leverage that deposit with the bank for further leverage to buy T-Bills versus Coupons from the US Treasury Auction pocketing the now leveraged yield.
- Yellen continues to Issue high paying T-Bills (versus lower paying longer duration notes/bonds) with
-
-
- the Taxpayer paying the difference in the form of government debt interest expense,
- the Fed Funding the BTFP (this cost results in reduced annual returns to the US Treasury),
- The Fed paying a higher IOFR (this cost results in reduced annual returns to the US Treasury).
-
GLOBAL ECONOMIC REPORTING: What This Week’s Key Global Economic Reports Tell Us?
-
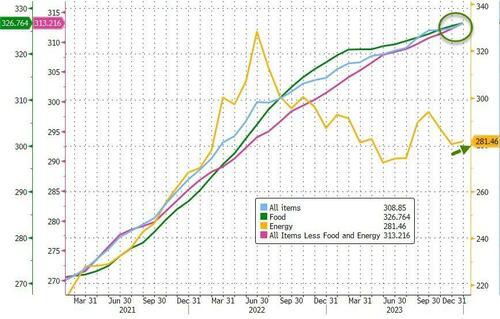
- CPI: Forget the shifting rates of change and simply look at what the consumer is paying in disposable income and not what the economic statisticians fail to report:
- Headline costs at record highs
- Core costs are record highs
- Food costs at record highs
- Fuel costs on the rise again
- SUPERCORE: Core CPI Services Ex-Shelter rose 0.4% MoM, up-ticking the YoY rise to +4.09%.
- PPI: Headline PPI declined 0.1% MoM; +0.1% MoM was expected; This is the 3rd straight month of ‘deflation’;
Headline PPI was up +1.0 YoY, Ex Food and Energy; The core PPI was unchanged MoM in December – the third month of unchanged in a row. Core PPI was down YoY to +1.8% (the lowest since Dec 2020).
DEVELOPMENTS TO WATCH
 CORPORATE PROFITS: What Is the 50% Post Pandemic Surge about??
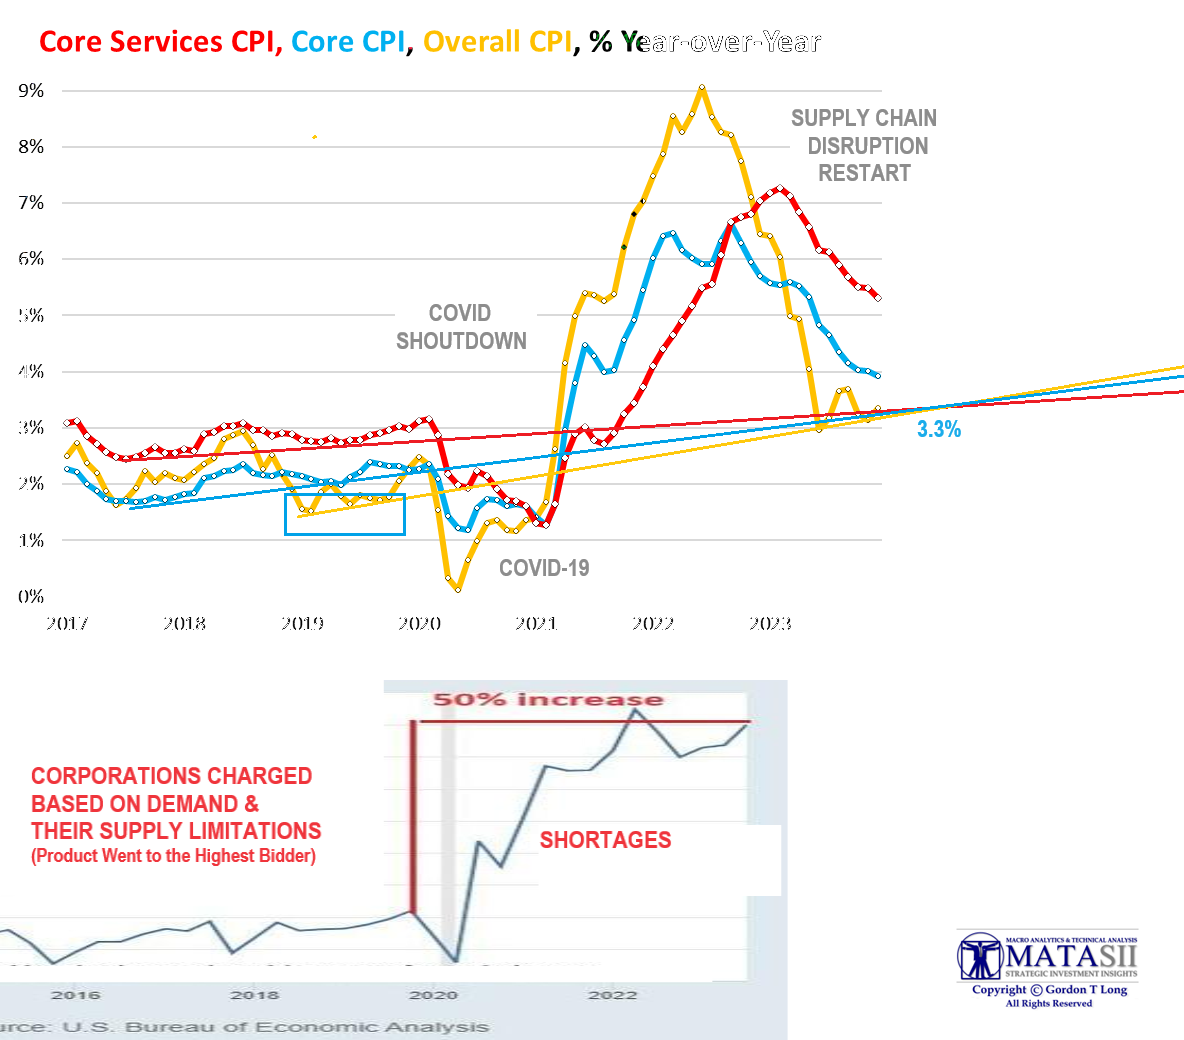
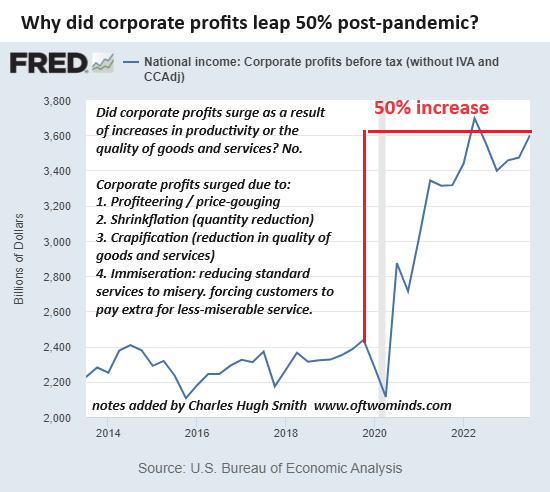
My Macro Analytics colleague Charles Hugh Smith recently pointed out the 50% leap in corporate profits (bottom pane right), from $2.4 trillion (pre-tax) pre-pandemic lockdown to $3.6 trillion (pre-tax) in the years since the lockdown ended (chart right).
Charles attributes it to:
-
- MONOPOLIES & CARTELS – Pricing Power
- SHRINKFLATION – Brand Buying & Limited Choices
- CRAPIFICATION – Reduced Quality & Shortened Product Life Cycle
I think we can determine a lot more from this corporate behavior when we overlay it with Thursday’s CPI report and extended trend lines. Corporate “Brand” pricing power push is running out of runway! (see below)
RECESSION INDICATORS: Which of the Indicators Are Right??
-
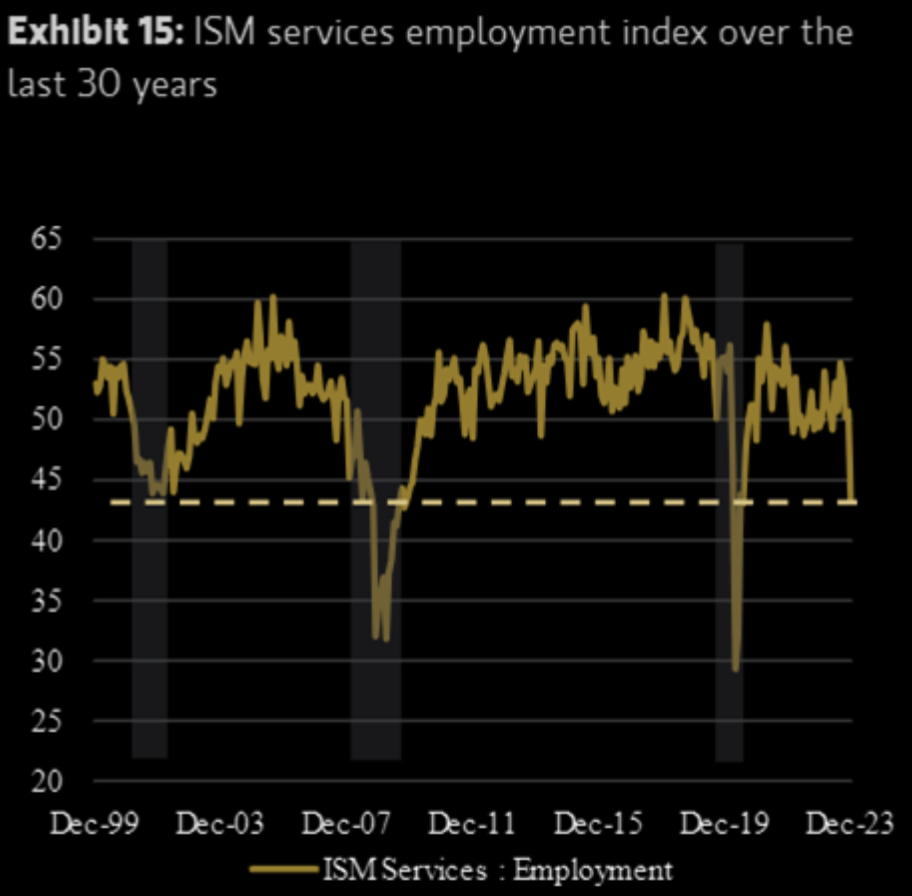
- The ISM employment for December is at a level rarely seen outside recessions.
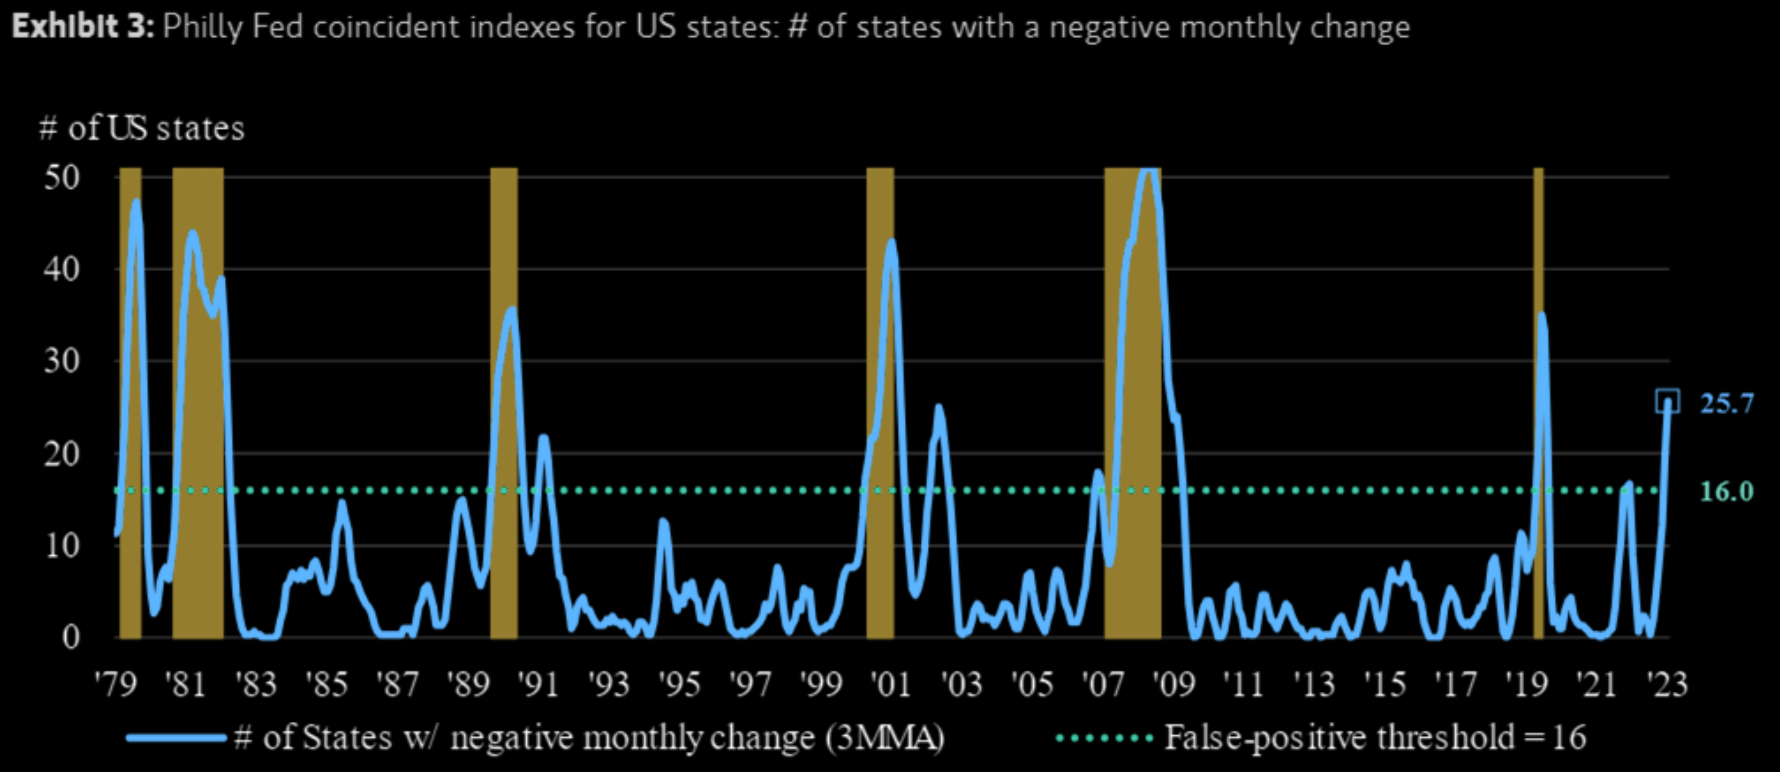
- In November 2023, monthly activity slowed in 30 of the 50 states, according to the Philly Fed Coincident indexes for all states:
- Over the 3 months ending in November, activity slowed in 26 states on average each month.
- The National Bureau of Economic Research (NBER) declared a recession each time more than 16 states experienced a slowdown.
STEALTH LIQUIDITY – Stage II Set-Up
Fed Chairman Jerome Powell & Treasury Secretary Janet Yellen. are constantly finding new ways to inject liquidity into an economy that otherwise would be running on fumes.
 STAGE I – Post BTFP (Chart Right)
By maintaining the issuance of high yielding short term T-Bill paper, this has become the dominant means of paying government deficit funding and rollovers. By doing this, Secretary Yellen has kept long duration coupons from rising. The cost is high government interest costs. Powell and Yellen are using US debt interest payment to fund “stealth” liquidity.
-
- Deposits fleeing the Banks to Money Funds was used by MMF to buy short term US Treasury T-Bills.
- RRP’s are sold to fund higher paying short term US Treasury T-Bills. RRP depletes from $2.6T to $650B and still falling.
- Yellen issues employs T-Bills versus Long Term Coupon Notes/Bonds to fund the government. She is effectively using excess US Government debt interest payments to fund the government and stealth liquidity.
This time, they’ve juiced the Bank Term Funding Program (BTLP), effectively sweetening the deal a bank can get on these emergency loans.
The Fed is offering loans at rates below
what it pays to banks who park money in its vaults!?
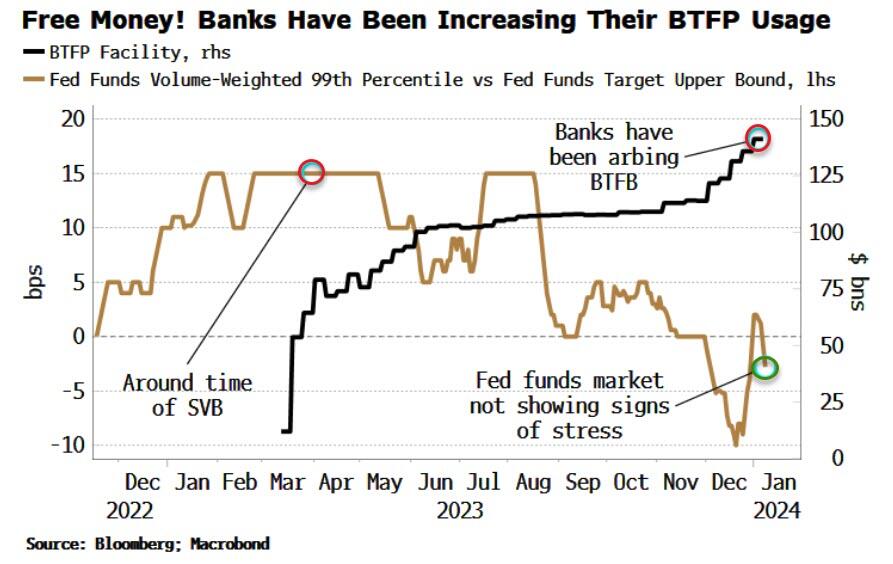
A financial institution can theoretically borrow from the Fed at 4.94% as of Friday, January 5, and then earn interest on that money from the same Fed at 5.40%. At first glance, that sounds like the secret to alchemy, and one wonders why every bank is not storming the BTFP to convert every last asset they own into fresh cash that they can turn into bank reserves. Is the recent surge in borrowing from the BTFP merely this magical arbitrage that Wall Street is taking advantage of at our expense?
STAGE II – Recent Surge in BTFP Lending By Large Banks
-
- Banks Using the BTFP – IOFR Spread allows banks to pocket the spread (free money).
- Banks place the earned spread Asset on deposit with Hedge Funds (a liability), who then leverage that deposit with the bank for further leverage to buy T-Bills versus Coupons from the US Treasury Auction pocketing the now leveraged yield.
- Yellen continues to Issue high paying T-Bills (versus lower paying longer duration notes/bonds) with:
-
-
- the Tax payer paying the difference in the form of government debt interest expense,
- the Fed Funding the BTFP (This cost results in reduced annual returns to the US Treasury),
- The Fed paying a higher IOFR (This cost results in reduced annual returns to the US Treasury).
-
THE MECHANICS OF THE BTFP
To understand why, (before the US Banking Crisis hits the Evening News), we first need a brief overview of the BTFP’s mechanics.
-
- The Fed lets banks take loans while posting devalued assets as collateral. The Fed created this facade of normalcy to paper over the massive interest rate risk they created by forcing interest rates to zero and then promising rates would stay there for years. Promise made, promise broken.
- When rates rose, banks found themselves loaded down with fixed rate loans at low interest rates, (think 30-year mortgage at fixed 2.125%), but liabilities at variable rates have quickly exceeded the income from their assets (think deposits paying 4%).
- The BTFP allows a bank to take its assets that lost value in the wake of interest rate hikes and post them as collateral, as long as they’re eligible for purchase in Open Market Operations. The bank can then eat current (higher) market rates, but now it takes on the risk of this new loan too.
- Let’s put some numbers into the narrative to make things easier to understand.
- Imagine a bank has an asset earning 3% – it can be a mortgage or any fixed rate loan. The bank also has a liability paying 4% which we’ll assume is deposits. In our example it doesn’t matter whether there’s $1 million in assets and liabilities or $100 million, just that they’re equal.
- We can immediately see that the bank has negative cash flow: its average interest on liabilities exceeds its average interest on an equal amount of assets. Why wouldn’t the bank liquidate its asset? That would give it cash that could then be loaned at today’s higher interest rates.
- Because no one would pay par for it, precisely because interest rates are higher. The bank can only entice a buyer to take the asset if it sells at a loss. In other words, this is just like SVB…
- So, the bank goes hat in hand to the Fed, showing that it has a 3% asset in a world of 6% interest rates on similar loans. The bank posts its 3% asset as collateral, and the Fed gives it cash, while charging the bank interest for the loan, say 4%.
- The bank has now doubled its liabilities (all at 4%), while it still has an asset paying 3%, but now it also has a cash asset: the money lent by the Fed.
- As fast as it can, the bank loans out this cash at the going rate of 6%. Now, we have liabilities (deposits and loan from the Fed) averaging 4%, and an equal amount of assets (loans to bank customers) averaging 4.5%. The bank’s back in the black.
- St. Jerome has saved the day.
- Of course, this simplified example assumes away things like risk that complicate the problem for banks and make the margins much thinner than they appear. The Fed also charges 10 basis points above the overnight index swap rate, so banks pay a premium to use this facility.
WHAT CHANGED?
What’s changed recently to turn the BTFP into an apparent cash cow for banks is that the interest rate the Fed charges on these loans has fallen below the interest rate on reserves.
-
- Suddenly, our hypothetical example above becomes much closer to reality. On top of that, it opens a whole new door for banks that are not in financial straits to make money on this arbitrage.
- Previously, this happened 3 other times last year, but it was a product of the Fed raising rates, which made it difficult for banks to take advantage of the rate differential. What’s different this time is that interest rates on reserves haven’t budged since July, so it’s open season on the BTFP.
- Banks can theoretically post all of their devalued assets (hundreds of billions in aggregate) as collateral, then simply park their loans at the Fed as reserves, earning a cool 46 basis points on the interest rate spread, 100% risk free. Or is it?
- There may not be default risk, but there’s a huge opportunity cost in most instances. Instead of a 5.40% rate at the Fed, a bank can earn over 7% on mortgages with relatively low risk. Auto loans and then credit cards represent additional steps on the risk/reward ladder.
- You also have default risk associated with the devalued assets themselves. While that may not be an issue with Treasuries, we already saw what rising interest rates can do to mispriced MBS in the late 2000s.
THE BAD BANKS
If a bank with a lousy balance sheet gets additional loans and then its collateralized asset goes belly up, it’s in real trouble.
-
- Troubled banks, therefore, likely can’t take advantage of this arbitrage because the margin is just too thin. They need to not only make money on the loan to/from the Fed, but the profit needs to also exceed the losses on their higher interest rate liabilities.
- Let’s go back to that simple example we used earlier. We start with the same 3% rate on the asset and 4% rate on the liability. The rate to borrow from the Fed is still 4%, but now the rate paid by the Fed for bank reserves is 4.5%.
- The bank will have liabilities with an average interest rate of 4% and an equal amount of assets with an average interest rate of 3.75% – it’s still operating in the red.
- Sure enough, when we look at bank reserves, there wasn’t a noticeable change in the 2023 trend when this arbitrage opportunity appeared, indicating banks are not taking advantage of it ‘en masse’.
- (N.B.: The plunge last week in this chart is just the typical year-end drop.)
THE GOOD BANKS
But what about those banks that are not in financial straits that we mentioned earlier?
-
- These are almost exclusively big banks like JP Morgan Chase and Wells Fargo, but probably not BoA, since the latter has admitted to $114 billions in unrealized losses and probably has the highest ratio of unrealized losses to total assets among the big banks.
- With his ample cash reserve, Jamie Dimon can put those unrealized losses to work and increase his bank’s reserves at the Fed. A few basis points on a billion dollars are nothing to scoff at.
- But doesn’t that tie up JP Morgan Chase’s position for the year term of the loan? Nope – because there are no prepayment penalties with the BTFP.
- So, when another troubled regional bank goes under, Dimon can simply cash out his chips but keep the money earned from the arbitrage, adding it to his massive cash reserve to buy that distressed bank…
- If this is so obvious, why isn’t the Fed doing anything about it?
- Because they want it to continue.
THEY ARE SETTING UP FOR A MASSIVE US BANK CONSOLIDATION
As long as the BTFP rate is below the IOR rate, the program is supercharged in terms of its ability to inject liquidity into the banking system, which is the whole reason the Fed created it in the first place.
-
- At first, it only made sense for a bank to use the BTFP if its balance sheet was so underwater, that it felt like Ted Kennedy drove the bank home. Now, banks with enough cash on hand to ride out their unrealized losses can turn them into gains while they wait to gobble up a smaller fish.
- That’s not a workable strategy for distressed banks, since they need a better rate of return than they can get parking reserves at the Fed, even though the BTFP rate has come down.
- That’s because what’s brought the BTFP rate down is other market rates coming down first, meaning bank assets (loans) created today have lower rates, on average, than in November.
- This is problematic because rates on loans have come down more than rates on deposits, which regional banks are still struggling to attract. The 50-or-so basis point spread at the Fed just isn’t enough for banks still loaded down with 2% loans.
- So, while the BTFP hasn’t quite turned into a universal money-making machine for every institution with primary credit privileges at the Fed, it is growing its clientele – massively.
Remember that at the end of the day, the Fed doesn’t care how the crisis is “resolved,” just as long as there are no riots in the streets.
If the bomb can be diffused by the three biggest banks swallowing everyone else, the Fed is happy
to make that happen and supercharging the BTFP helps that along.
After all, Treasury Secretary Janet Yellen has explicitly said further “consolidation” in the banking sector would be a good thing. Maybe it’s all “part of the plan”?? Can anyone say “CBDC” Small Banks and Small Regionals which employ the use of tellers and cash.
STEALTH LIQUIDITY II – Yellen’s Political Role
Yellen’s use of the US Treasury Auction “Mix” has kept the Economy Running Hot by effectively having the Taxpayer pick up the costs in the form of increased interest on the US debt. Yellen not only again leans on “more Bills” with “less Coupon” increase than currently anticipated…but then also too clearly provides guidance to markets that this is the final Coupon increase moving-forward.
Yellen continues to Issue high paying T-Bills (versus lower paying longer duration notes/bonds) with:
-
- The Taxpayer paying the difference in the form of government debt interest expense,
- The Fed Funding the BTFP,
- The Fed paying a higher IOFR,
- The cost for both #2 and #3 results in reduced annual returns to the US Treasury and therefore a cost to the tax payer, which must eventually be paid by the taxpayer as either tax or inflation.
RECAP
STAGE I – Post BTFP
By maintaining the issuance of high yielding short term T-Bill paper, this has become the dominant means of paying government deficit funding and rollovers. By doing this, Secretary Yellen has kept long duration coupons from rising. The cost is high government interest costs. Powell and Yellen are using US debt interest payment to fund “stealth” liquidity.
-
- Deposits fleeing the Banks to Money Funds was used by MMF to buy short term US Treasury T-Bills.
- RRP’s are sold to fund higher paying short term US Treasury T-Bills. RRP depletes from $2.6T to $650B and is still falling.
- Yellen issues employs T-Bills versus Long Term Coupon Notes/Bonds to fund the government. She is effectively using excess US Government debt interest payments to fund the government and stealth liquidity.
STAGE II – Recent Surge in BTFP Lending By Large Banks
-
- Banks Using the BTFP – IOFR Spread allows banks to pocket the spread (free money).
- Banks place the earned spread Asset on deposit with Hedge Funds (a liability), who then leverage that deposit with the bank for further leverage to buy T-Bills versus Coupons from the US Treasury Auction, pocketing the now leveraged yield.
- Yellen continues to Issue high paying T-Bills (versus lower paying longer duration notes/bonds) with:
-
-
- The Taxpayer paying the difference in the form of government debt interest expense,
- The Fed Funding the BTFP (This cost results in reduced annual returns to the US Treasury),
- The Fed paying a higher IOFR (this cost results in reduced annual returns to the US Treasury).
-
 MARCH IS CRUNCH TIME
1. Reverse repo likely out of money,
2. BTFP scheduled to expire,
3. Fed cuts (current expectations), and
4. QT ends (current expectations),
“the distribution of reserves is more uneven this cycle, so the FOMC probably sees a higher risk of dysfunction in money markets as its balance sheet shrinks.”
GENERAL NOTES:
-
- “All reserves are shifting to big banks” and that without access to the BTFP “small banks toast.”
- The rapidly shrinking liquidity across the banking sector – and especially small banks – resulted in a sudden spasm in funding markets, which pushed the SOFR – RRP spread to the highest since Jan 2021…
- would lead to both an early end of QT… as well as an early restart of QE.
- If repo continues to exhibit large jumps, it may reflect a lack of excess cash in the system, potential SRF (Standing Repo Facility) use, and a Fed that may question an earlier end to QT.”
- The Sept 2019 repo market crisis, which came out of nowhere and led to an almost overnight paralysis in the market’s key repo plumbing (and led to the Fed starting QE, or as the Fed called it “Not QE”),
- Here are likely to be more frequent signs of upward SOFR pressure as cash drains and UST collateral builds. And yes, those pointing out that this suggests we suddenly have reserve scarcity when reverse repo still has over $700 billion in availability and with over $3.4 trillion in Fed reserves… you are right, and the implications are of course, staggering and for those looking for the spoiler alert, here it is: it means not only that the Fed will end QT much sooner than expected, but it will have to launch QE shortly after.
- The staggering divergence in not only funding and liquidity between large and small institutions, but also the growing solvency gap between the two, means that in Q3 the delinquency rate on the smallest US banks (those not in the top 100) hit an all time high!
- The Fed (Lorie Logan) was starting to freak out about the decline in systemic liquidity in general and the upcoming bank crisis among small regional banks in particular.
- “The Fed learned in 2019 that there is a functional limit to how small the balance sheet can be”, a limit which is now approaching as he explains:
- Too small is when available cash is insufficient to meet O/N financing for the securities market – the plumbing stops working. What has gotten the FOMC to sit up now and take notice about the current QT is the return of month-end spikes in the repo rate for GC that are growing larger.
- If you are a small US bank: after all, a substantial portion of your liquidity is coming from the BTFP facility, which will mature in – drumroll – March.
- In other words, March is when everything happens:
- The BTFP is pulled (which the Fed has no choice now that it is giving away “free money” via the BTFP arbitrage, something which will soon become a major political scandal) and
- The Reverse Repo facility hits 0.
- When push comes to shove and we get a little market turmoil in the weeks that follow, in addition to the markets realizing that QT is still taking place too fast and too many reserves are being drained relative to how much liquidity was being injected previously via reverse repo, the start of the next QE begins.
- In the end, if we are sitting in summer with a growing economy and rising private credit demands that have helped turn the curve positive, the Fed will recognize (to the extent it does not already), that where they set IOR (Interest On Reserve balance) is their most critical policy choice.
GLOBAL ECONOMIC INDICATORS: What This Week’s Key Global Economic Releases Tell Us
 CPI
CPI
Forget the rate of change and look at what the consumer is experiencing and not what the economic statisticians report (chart right):
-
- Headline costs at record highs
- Core costs are record highs
- Food costs at record highs
- Fuel costs on the rise again
HEADLINE & CORE
-
- Headline Consumer Price Inflation printed hotter than expected in December,
- Headline CPI MoM +0.3% vs +0.2% expected and +0.1% in the prior month,
- Headline CPI YoY up +3.4% from +3.1% prior and hotter than the +3.2% expected,
- Core CPI rose 0.3% MoM as expected,
- Core YoY 3.93% and below 4.00% for the first time since May 2021,
- Core CPI Services Ex-Shelter (SuperCore) rose 0.4% MoM, upticking the YoY rise to +4.09%.
SUPER CORE
-
- All the subsectors of SuperCore rose MoM, with the shelter index increased 6.2% over the last year, accounting for over two thirds of the total increase in the all items less food and energy index.
- Services (Shelter mostly) costs re-accelerated and energy deflation stalled in December.
- Goods deflation stalled as used cars and trucks index rose 0.5% over the month, after rising 1.6% in November.
SHELTER inflation is slowly slowing:
-
- Shelter inflation was up 6.15% YoY in Dec, down from 6.51% in Nov and the lowest since July 2022.
- Rent inflation was up 6.47% YoY in Dec, down from 6.87% in Nov and the lowest since July 2022.
FOOD
-
- Four of the six major grocery store food group indexes increased over the month.
- The index for meats, poultry, fish and eggs rose 0.5% in December, led by an 8.9% increase in the index for eggs.
- The index for food away from home rose 5.2% over the last year.
- The index for limited service meals rose 5.9% over the last 12 months and the index for full service meals rose 4.5% over the same period.
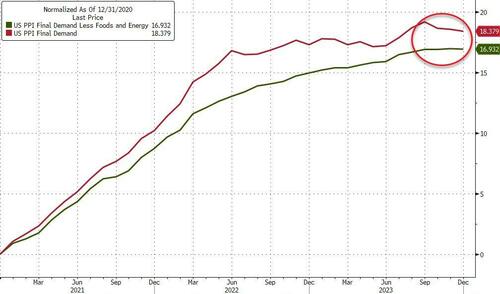 PPI
PPI
HEADLINE & CORE
-
- Headline PPI declined 0.1% MoM. +0.1% MoM was expected.
- This is the 3rd straight month of ‘deflation’.
- Headline PPI was up +1.0 YoY.
- Ex Food and Energy, the core PPI was unchanged MoM in December – the third month of unchanged in a row,
- Core PPI was down YoY to +1.8% (the lowest since Dec 2020).
Core producer prices are up 16.9% since President Biden came into office (and headline PPI up over 18%). This is the cost of Trillion dollar spending bills for Biden’s new America, pushing the national Net to +$34T and December’s budget deficit up 50% after only 4 months into Biden’s new budget.
GLOBAL MACRO
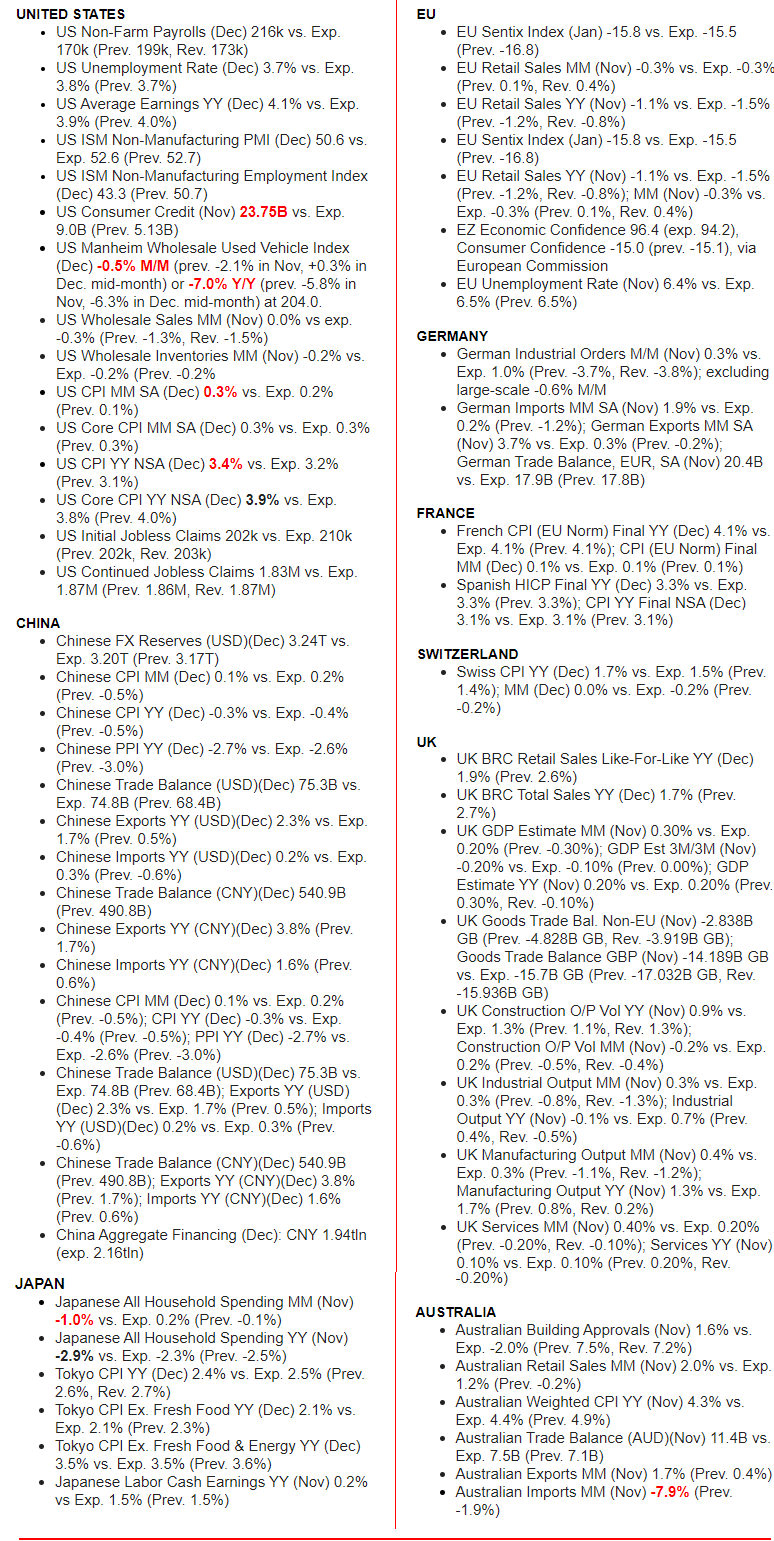
WHAT DOES YOUR SCAN OF THE DATA BELOW TELL YOU? – THE MEDIA AVOIDS BAD NEWS!
We present the data in a way you can quickly see what is happening.
THIS WEEK WE SAW
Exp=Expectations, Rev=Revision, Prev=Previous
DEVELOPMENTS TO WATCH
CORPORATE PROFITS: What Is the 50% Post Pandemic Surge about??
 My Macro Analytics colleague Charles Hugh Smith recently pointed out the 50% leap in corporate profits, from $2.4 trillion (pre-tax) pre-pandemic lockdown to $3.6 trillion (pre-tax) in the years since the lockdown ended (chart right).
Charles attributes it to:
-
- MONOPOLIES & CARTELS: This is what happens when you allow your economy to be dominated by quasi-monopolies and cartels. They all raise prices and diminish quality as a unified concentration of financial and political power.
- SHRINKFLATION: The relentless reduction in the quantity of product in the packaging. One wonders how thin the can of tuna will eventually be–the thickness of a pancake? Or how thin can they make the box of cereal before the container can no longer stand upright?
- CRAPIFICATION: The reduction of the quality of goods and services, a.k.a. crapification, is a key source of soaring corporate profits. As the unhappy buyer of three replacement appliances this year alone, all replacements for failed name-brand appliances that lasted 7 years or less–I can attest that crapification/ planned obsolescence is a core source of higher profits.
NOTE: I could tell Charles finally had enough when he wrote me at Christmas containing this note: “By the way, we just had our fourth appliance failure of 2023: the digital controls of our 7-year old Samsung stove-oven gave up the ghost in Christmas week, while we were roasting a turkey. Our almost-new water heater needed a repair, our 5-year old washer’s control board died, and the fridge in our rental studio broke down. None were older than 7 years!”
CHART BELOW
Thursday’s CPI is shown in the top panel below. I am a big believer in trends based on “rate of change”. As such, I have taken the pre-covid trends and extended them. A number of interesting observations can be made:
-
- The major CPI metrics all converge at exactly the same point.
- The point of convergence aligns with the likely bottoming level of the current covid downward trends at ~3.3%.
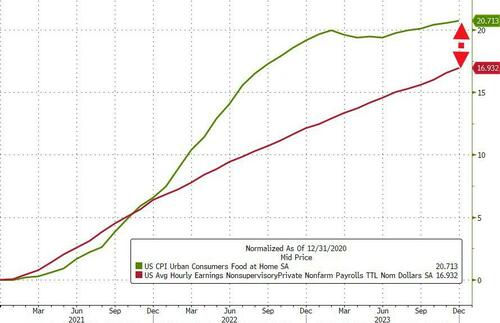
- The lower panel overlays the profit surge made by corporations during the covid supply shortages due to stay at home workers and plant closures. Clearly corporations used their pricing power associated with shortages matching demand to their full advantage. Though that period is behind us, these corporations have not taken down the prices, but rather have only slowed their rate of steadily “pushing” their pricing power!
If we drill down to the ‘average joe’ – production and non-supervisory jobs – their wages are up 17% since Biden was elected… The only problem is, the cost of food since then has surged almost 21%.
How long can corporations keep inflating at even a 3.3% inflation rate (above) before they must start layoffs to shore-up their elevated profit levels – i.e create a degree of artificial scarcity?
Forget the rate of change of inflation and look at what the consumer is experiencing and not what the economic statisticians report. Consumers are seeing (as I mentioned above):
-
- Headline costs at record highs
- Core costs are record highs
- Food costs at record highs
- Fuel costs on the rise again
RECESSION INDICATORS: Which Indicators Are Right??
 In our “WHAT YOU NEED TO KNOW!” section at the top of the page, we pointed out that the typically reliable metric of the spread between the S&P 500 and “BBB” corporate credit rate is pretty clear that we are now not even close to pricing in a recession. This after retreating heavily throughout 2023 primarily from stealth liquidity being pumped into the system, where corporate lenders & borrowers have taken full advantage!
We think it is a temporary distortion and what is more representative can be seen by the following:
CHART RIGHT
Some data point to a weakening economy. The ISM employment for December is at a level rarely seen outside recessions.
CHART BELOW
In November 2023, monthly activity slowed in 30 of the 50 American states, according to the Philly Fed Coincident indexes for the US.
-
- Over the 3 months ending in November, activity slowed in 26 states on average each month.
- The National Bureau of Economic Research (NBER) declared a recession each time more than 16 states experienced a slowdown.
Q4 EARNING SEASON BEGINS
Option Expiration Friday 01-19-24
Click All Charts to Enlarge
1 – SITUATIONAL ANALYSIS
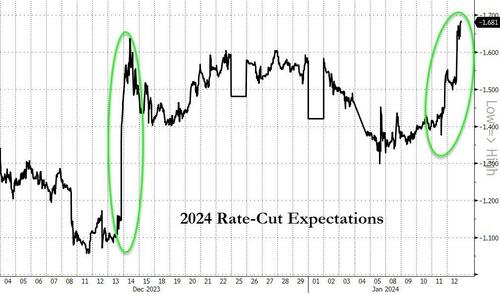 The odds of a cut in March have soared above 80%. ‘Cooler-than-expected’ PPI (along with lower inflation expectations from NYFRB’s survey) trumped ‘hotter-than-expected’ CPI this week. This opened the floodgates for traders to bet on. The Fed is seen to be forced into a more dovish reaction than they had been expected to be in 2024. (Chart Right)
Expectations for 2024 rate-cuts exploded to new highs at 170bps. Traders are now fully pricing in 6 cuts and a 65% odds of a 7th cut in 2024.
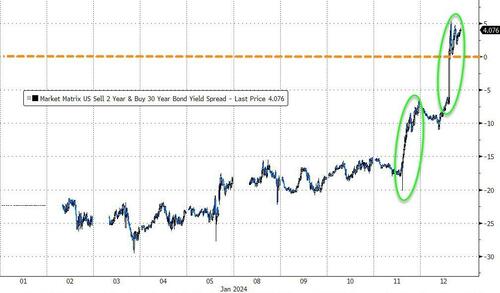 We witnessed a massive bull-steepening in the curve – dis-inverting the 2s30s segment (chart right). This is the ‘steepest’ and most un-inverted the (2s30s) curve has been since July 2022.
Meanwhile the 2y Yield hit its lowest since May ’23 (and the same level as it was in Sept ’22), with the10Y UST back below 4.00% closing at 3.93%.
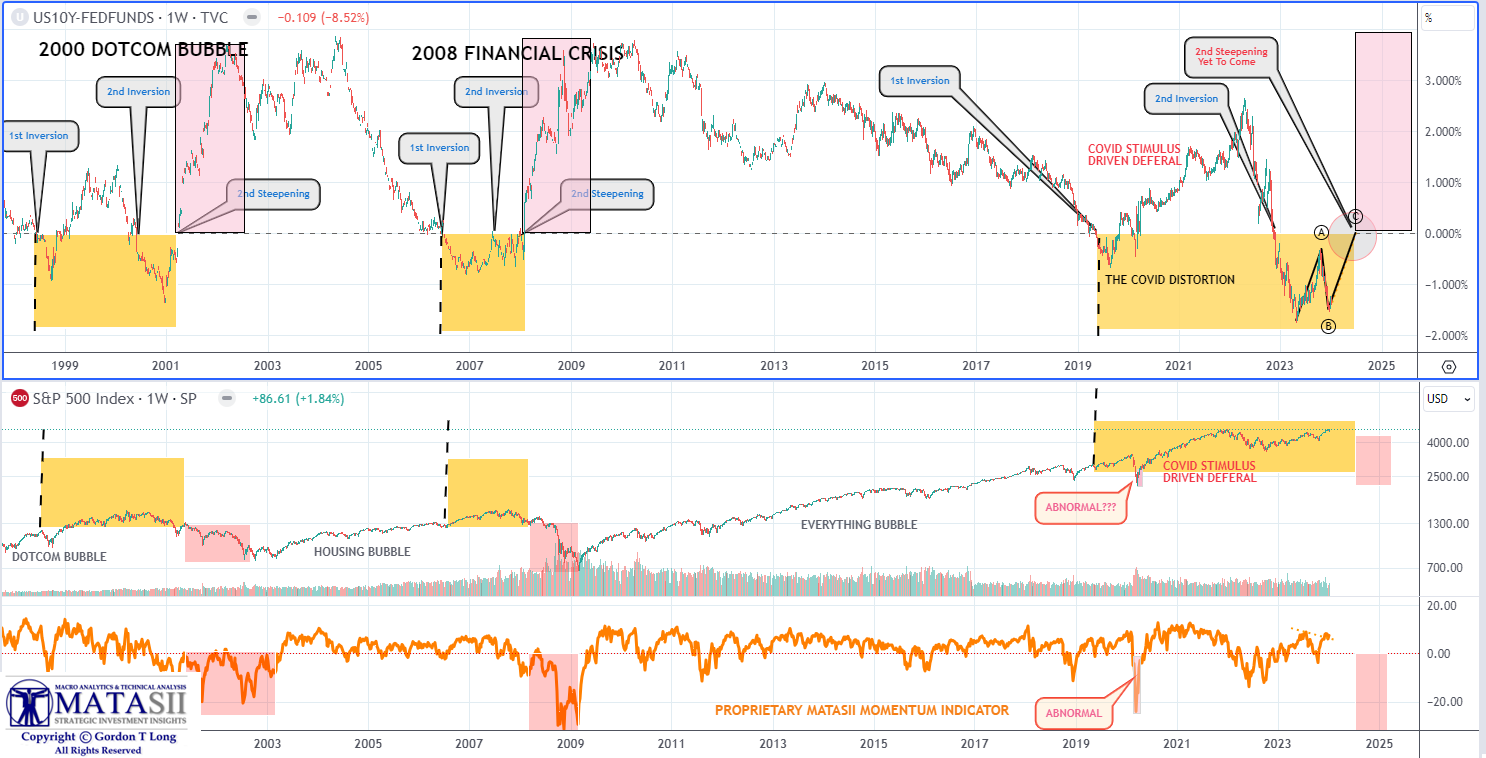
MATASII YIELD CURVE CONTROL TRACKER
These actions in the yield curve further supports the MATASII Proprietary Yield Curve shown below.
We have completed leg AB and are starting on leg C. With leg C=A, we arrive at exactly our June target for the the yield curve to go positive. We expect the equity markets (middle pane) to track closely to the 2000 and 2008 10Y-FFR Yield Curve. Equity markets will show overall weakness in H1, but the real damage begins in H2. This precludes some extraordinary Election Year chicanery by the Fed &/or the US Treasury.
YOUR DESKTOP / TABLET / PHONE ANNOTATED CHART
Macro Analytics Chart Above: SUBSCRIBER LINK
2 – FUNDAMENTAL ANALYSIS
 OBSERVATIONS:
-
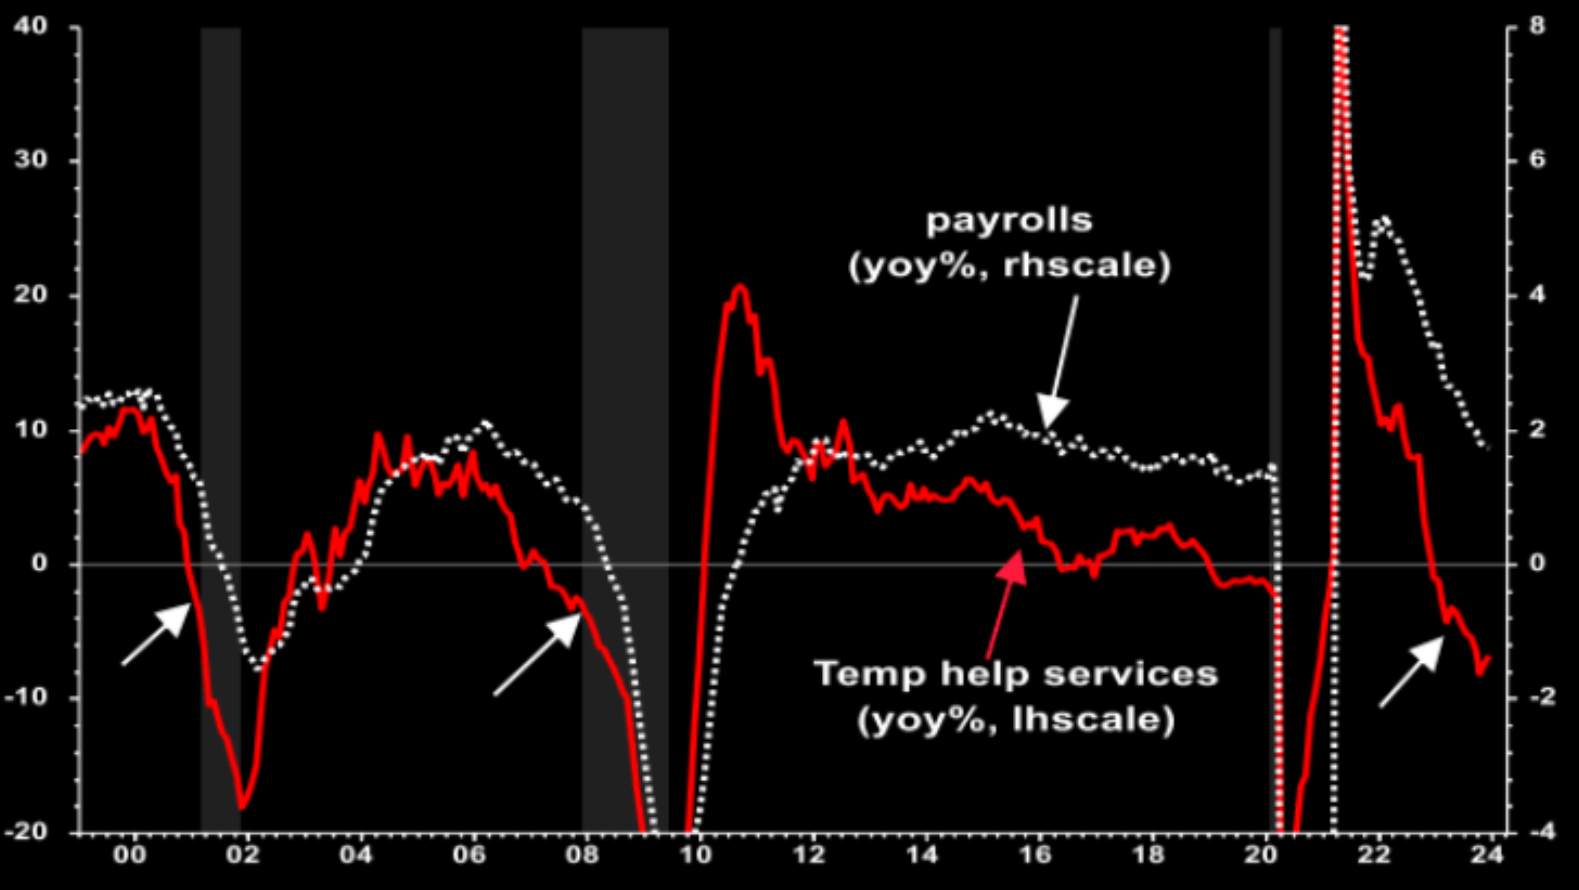
- Ask temps how the US economy is doing – The answer is “awful! (CHART RIGHT)
- Temporary hiring is normally the “Canary in the Coal Mine!”
- A steep Y-o-Y fall in Payroll growth is also a bad omen.
- These are not short term trade indicators, but do suggest Corporate Margins will soon be under stress! (See this week’s newsletter for why 50% surge in corporate profits since Covid-19).
 Data Trek Quote:
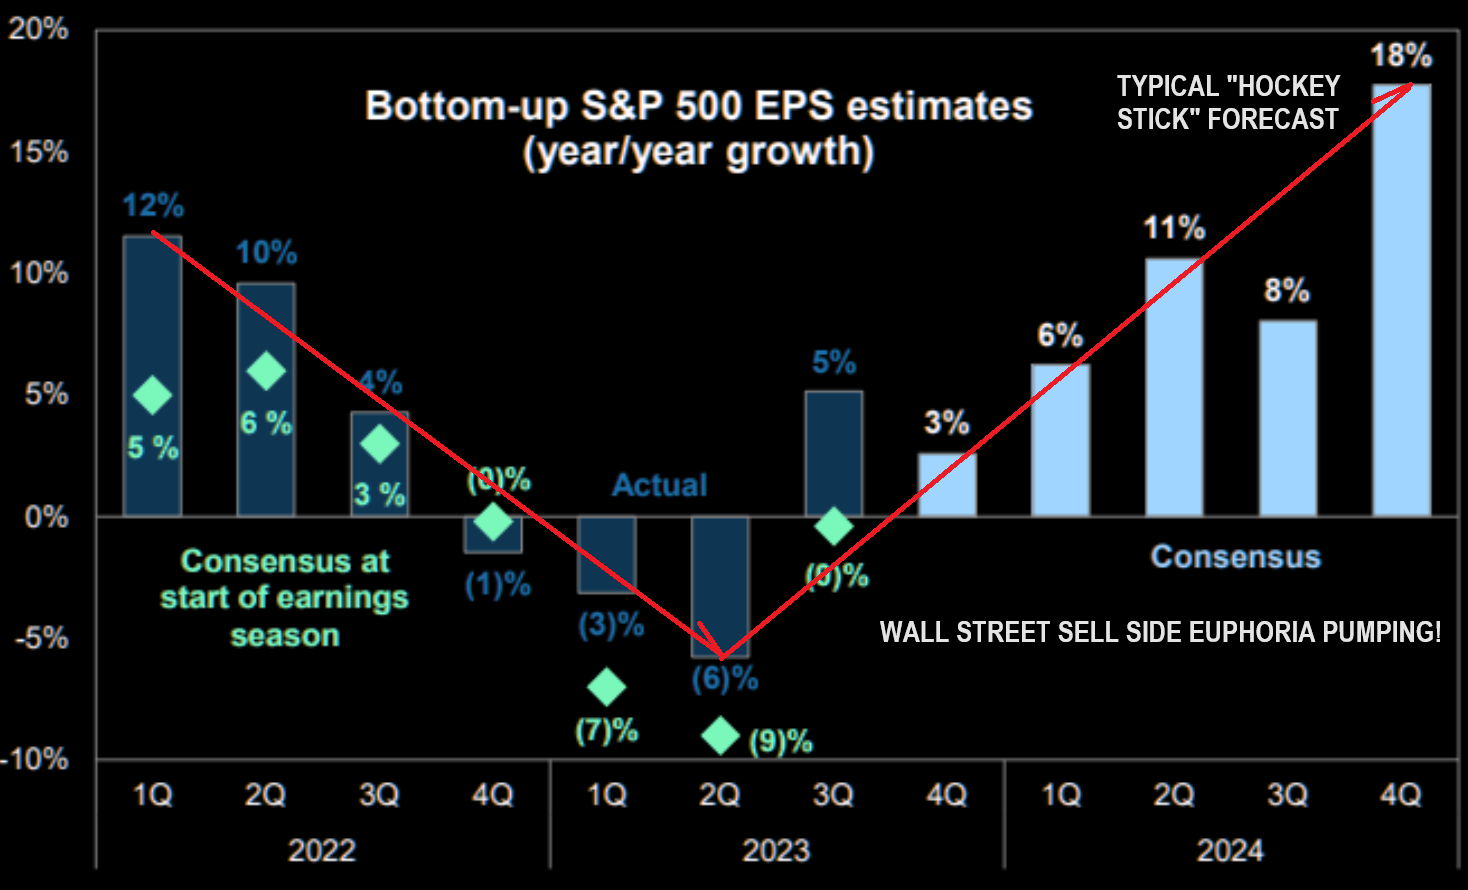
“Over the last 90 days, Wall Street analysts have cut their Q4 2023 earnings estimates far more than is usually the case. The rally late last year was not based on accelerating corporate fundamentals, but rather hopes for rate cuts in 2024.” (See chart right and below – ‘Earning Forecasts are unrealistic!’)
EARNINGS SEASON
Earnings season began Friday with the banks leading the way. The Markets sold the earnings!!
-
- JPMorgan (JPM) -0.5%: EPS and revenue beat, although revenue breakdown was more mixed. FY24 NII ex-markets guidance topped expectations. Results in 2023 reflect overearning on both NII and credit, but remain confident to continue to deliver very healthy returns even after they normalize.
- Bank of America (BAC) -1%: Revenue, trading revenue and net income fell short. Was hit by USD 3.7bln in combined charges, while net interest income fell 5% due to lower deposit balances and higher deposit costs.
- Wells Fargo (WFC) -3.5%: Missed on profit, but results included USD 0.20/share of severance expense for planned actions.
- UnitedHealth (UNH) -3.5%: Weighed on by Medical Cost Ratio rising to 85% from 82.3% Q/Q (exp. 83.9%). Note, EPS and revenue topped expected and affirmed FY24 guidance.
- Delta Airlines (DAL) -9%: Weak Q1 revenue guidance.
- Tesla (TSLA) -4%: Cut prices by up to 6% on its Model 3 and Model Y EVs in China. Elsewhere, production at the giga-factory Berlin is to stop most output for two weeks due to Red Sea disruption.
- Boeing (BA) -2%: FAA is increasing oversight of Boeing production and manufacturing, with a 3rd party overseeing inspections and quality systems.
- Intel (INTC) -1%, Nvidia (NVDA) -0.3%, Micron (MU) -1%: .
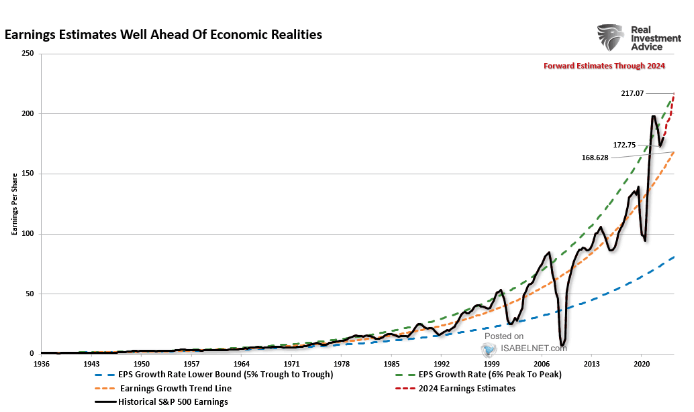 Earning Forecasts are unrealistic!
-
- Soc Gen’s Andrew Lapthorne weighs in:
“The obvious contradiction is this idea of an immaculate slowdown, whereby interest rates decline as inflation rates go back to target, yet corporate profitability grows at a double-digit rate next year while prior interest hikes neither damage demand nor balance sheets. As quants, we clearly suffer from a backward-looking bias, but rate cuts and profit growth? We’ve yet to see it.” (Chart Right)
-
- BoAML’s Hartnett:
“Only 5x in last 90 years has Fed cut rates with core CPI (3.9%) being larger than the U-rate (3.7%).”
The cuts were triggered by war (1942) or major financial turmoil (1969, 1974, 1980, 1981).
3 – TECHNICAL ANALYSIS
US EQUITY MARKETS
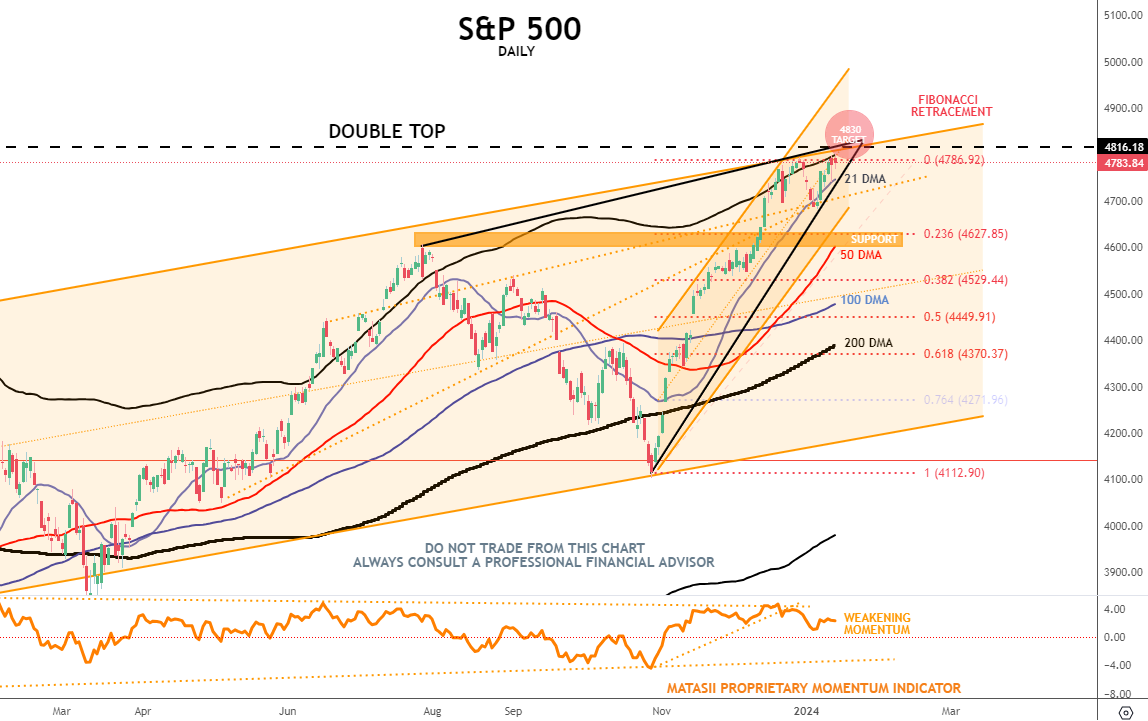
CONSENSUS OF CONTROL SET: Volatility around the January OPEX before putting in a final new high in the S&P 500 at ~4830
CONTROL SET
There are FIVE charts we have outlined in prior chart packages that we will continue to watch closely as a “control set” over the next 10 days.
-
- The S&P 500 (CHART LINK)
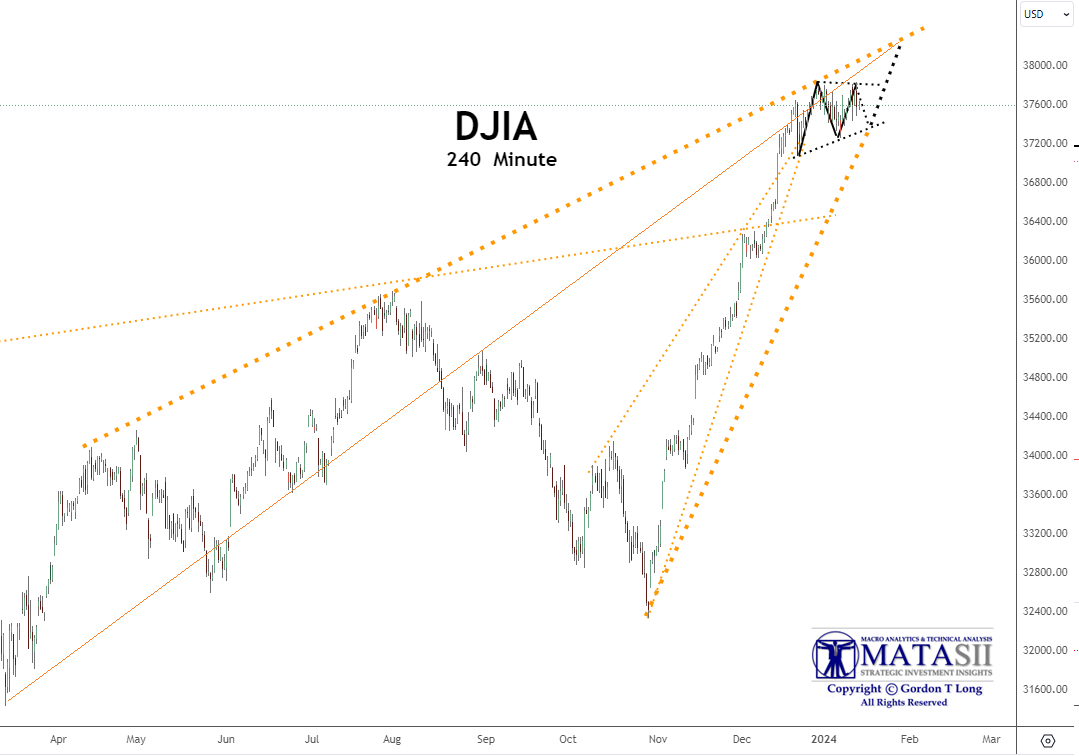
- The DJIA (CHART LINK)
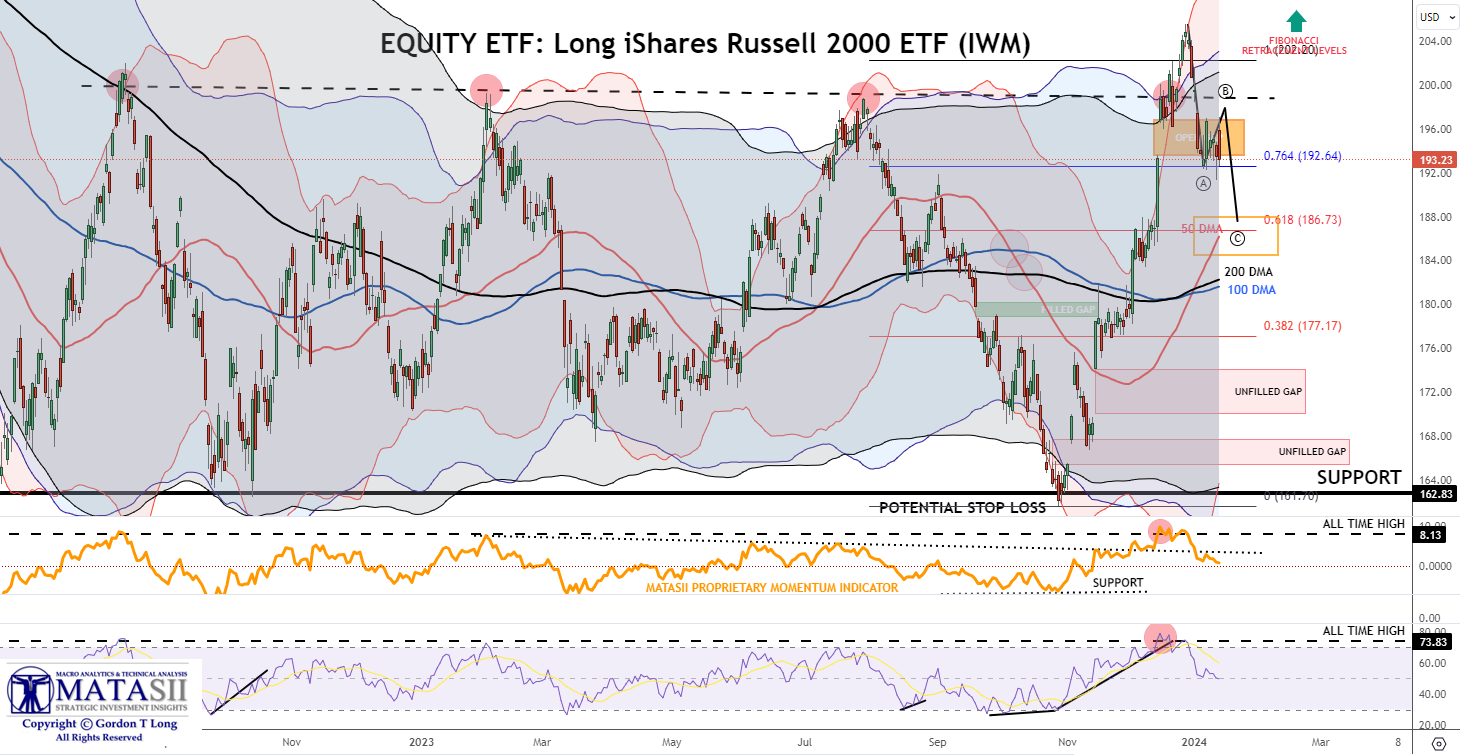
- The Russell 2000 through the IWM ETF (CHART LINK),
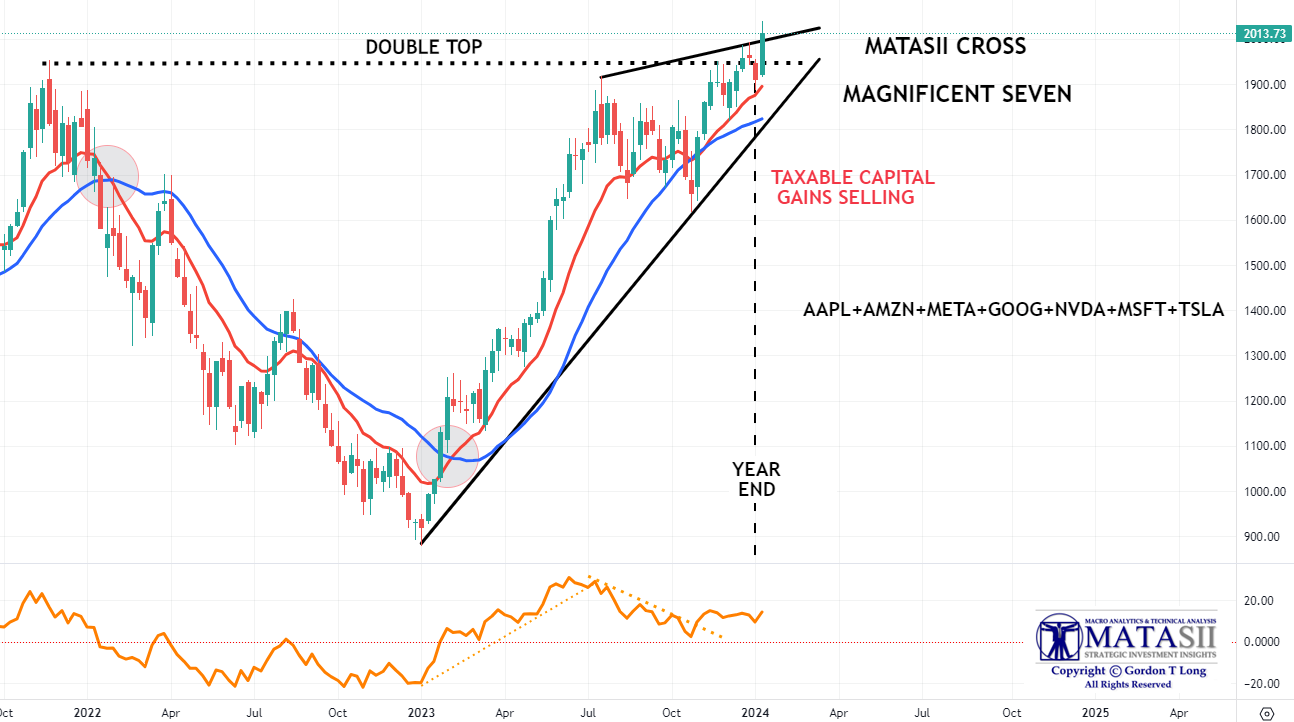
- The MAGNIFICENT SEVEN (CHART ABOVE WITH MATASII CROSS – LINK)
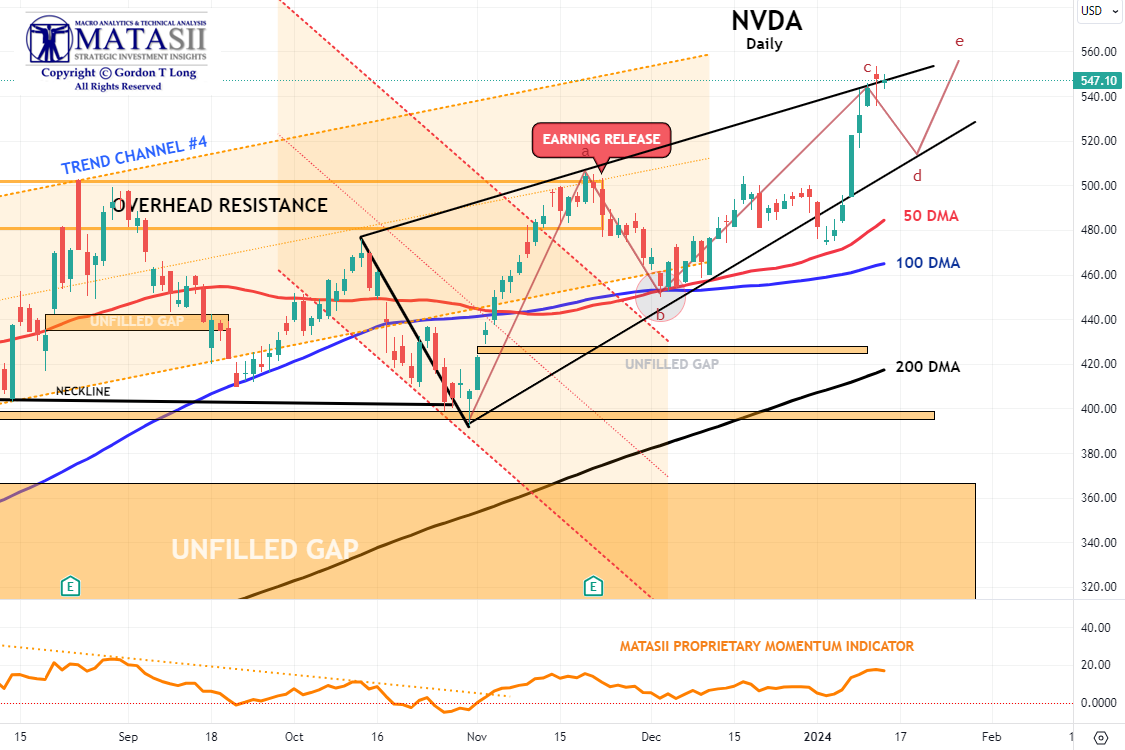
- Nvidia (NVDA) (CHART LINK)
S&P 500
The S&P 500 has rebounded strongly off the 21 DMA with a very shallow Fibonacci 13.6% retracement. We therefore anticipate that the down move is not yet complete before seeing a new high (or minimally a trend channel “through-over”) during the January Options Expiration period. (Additional S&P 500 Chart). We don’t yet see prices reaching much higher than 4900.
YOUR DESKTOP / TABLET / PHONE ANNOTATED CHART
Macro Analytics Chart Above: SUBSCRIBER LINK
DJIA
A small uncompleted continuation triangle is developing in the DJIA. The probability is that it completes to the upside, since Continuation Triangles complete in the direction of the prior trend.
YOUR DESKTOP / TABLET / PHONE ANNOTATED CHART
Macro Analytics Chart Above: SUBSCRIBER LINK
RUSSELL 2000 IWM ETF
As expected the IWM has retraced sufficiently to close the unfilled gap at a lower level. With the gap filled the IWM should continue to rise higher in January, since the impulsive lift count since November doesn’t appear to be yet completed.
YOUR DESKTOP / TABLET / PHONE ANNOTATED CHART
Macro Analytics Chart Above: SUBSCRIBER LINK
MAGNIFICENT SEVEN
The Magnificent Seven is completing a pretty clear ending diagonal. A fairly significant correctional normally follows such a pattern. This is a weekly chart which suggests the pattern completes during the January 19th Option Expiration period.
YOUR DESKTOP / TABLET / PHONE ANNOTATED CHART
Macro Analytics Chart Above: SUBSCRIBER LINK
NVDA
NVDA appears to be nearing the completion of an ending diagonal. There is a chance that NVDA is giving the clearest view of what is ahead in the very near term (this week and next).
YOUR DESKTOP / TABLET / PHONE ANNOTATED CHART
Macro Analytics Chart Above: SUBSCRIBER LINK
FAIR USE NOTICE This site contains copyrighted material the use of which has not always been specifically authorized by the copyright owner. We are making such material available in our efforts to advance understanding of environmental, political, human rights, economic, democracy, scientific, and social justice issues, etc. We believe this constitutes a ‘fair use’ of any such copyrighted material as provided for in section 107 of the US Copyright Law. In accordance with Title 17 U.S.C. Section 107, the material on this site is distributed without profit to those who have expressed a prior interest in receiving the included information for research and educational purposes. If you wish to use copyrighted material from this site for purposes of your own that go beyond ‘fair use’, you must obtain permission from the copyright owner.
NOTICE Information on these pages contains forward-looking statements that involve risks and uncertainties. Markets and instruments profiled on this page are for informational purposes only and should not in any way come across as a recommendation to buy or sell in these assets. You should do your own thorough research before making any investment decisions. MATASII.com does not in any way guarantee that this information is free from mistakes, errors, or material misstatements. It also does not guarantee that this information is of a timely nature. Investing in Open Markets involves a great deal of risk, including the loss of all or a portion of your investment, as well as emotional distress. All risks, losses and costs associated with investing, including total loss of principal, are your responsibility.