Gordon T Long
Global Macro Research | Macro-Technical Analysis
MACRO
CHINA
CHINA HAS LOST ITS COMPETITIVE ADVANTAGE
OBSERVATIONS: THE TWO AMERICAS WE LIVE IN
There are two Americas that few seem to fully appreciate. I am not talking about the Rich versus Poor, nor the Haves versus the Have nots, nor the Liberals versus the Conservatives, nor EVEN the Powerful versus the “Deplorables”. It is much more pervasive and therefore more serious. It is the difference that divides a country and potentially destroys it if political leadership doesn’t both understand it and effectively bridge it.
In simplest terms it is best understood as (statistics from Rasmussen’s RMG Research):
-
- The ‘Disconnected Elite’ versus the Average American
- The Disconnected Elite (DE) are typically those earning more than $150,000 a year and living in high-density areas.
- 74% of the ‘Disconnected Elites’ say their finances are getting better (88% who are Ivy League graduates) versus only 20% of the rest of voters.
- DE’s give President Biden an 84% approval rating, compared with 40% from non-elites.
- DE’s complete faith in fellow elites extends beyond Mr. Biden. Large majorities of them have a favorable view of:
- University Professors (89%)
- Journalists (79%)
- Lawyers and Union Leaders (78%) and
- even Members of Congress (67%).
- Two-thirds of DE’s say they’d prefer a candidate who said teachers and educational professionals, not parents, should decide what children are taught.
- 50% of DE’s believe the U.S. provides “too much individual freedom”—compared with nearly 60% of voters who believe there is too much “government control.”
- 77% of elites support “strict rationing of gas, meat and electricity” to fight climate change, vs. 28% of everyone else.
- More than two-thirds of DE Ivy graduates favor banning things like gasoline-powered cars and stoves and inessential air travel in the name of the environment.
- More than 70% of average voters say they’d be unwilling to pay more than $100 a year in taxes or costs for climate—compared with 70% of elites who said they’d pay from $250 up to “whatever it takes.”
DE members are prominent in every major institution of American power, from media to universities to government to Wall Street, and have become more intent on imposing their agenda from above. They dominate the new leadership class in all areas of our economy, finance, politics and even our social networks.
I have come to refer to Washington politics as being controlled by the UniParty. Conservative members are not RINO’s, but are actually DE’s.
Silicon Valley, Manhattan and Washington, D.C. have become bubbles that have lost contact with everyday Americans. This explains why the political class – which is a big part of the elite group – is confused by poll numbers showing that voters are feeling financially stressed out. The elites are doing fine, so they believe that everyone is prospering. I suspect that most don’t want radical change in the public schools, because their kids attend blue-chip private schools. They are fine with abolishing SUVs, because in big cities Americans generally don’t drive those cars – if they drive cars at all.
Crime, illegal immigration, inflation, fentanyl and factory closings aren’t keeping the elite up at night, because in their cocoons they don’t encounter these problems on a daily basis the way so many Americans do today.
Not too many main street Americans are losing sleep about climate change or LGBTQ issues.
The elites in America tend to work in the “talking professions” – university professors, journalists, lawyers, actors and lobbyists. They keep talking and normal Americans are more than ever not listening to them.
The DE’s are the core of the Rich, Have’s and Progressive Liberals.
WHAT YOU NEED TO KNOW!
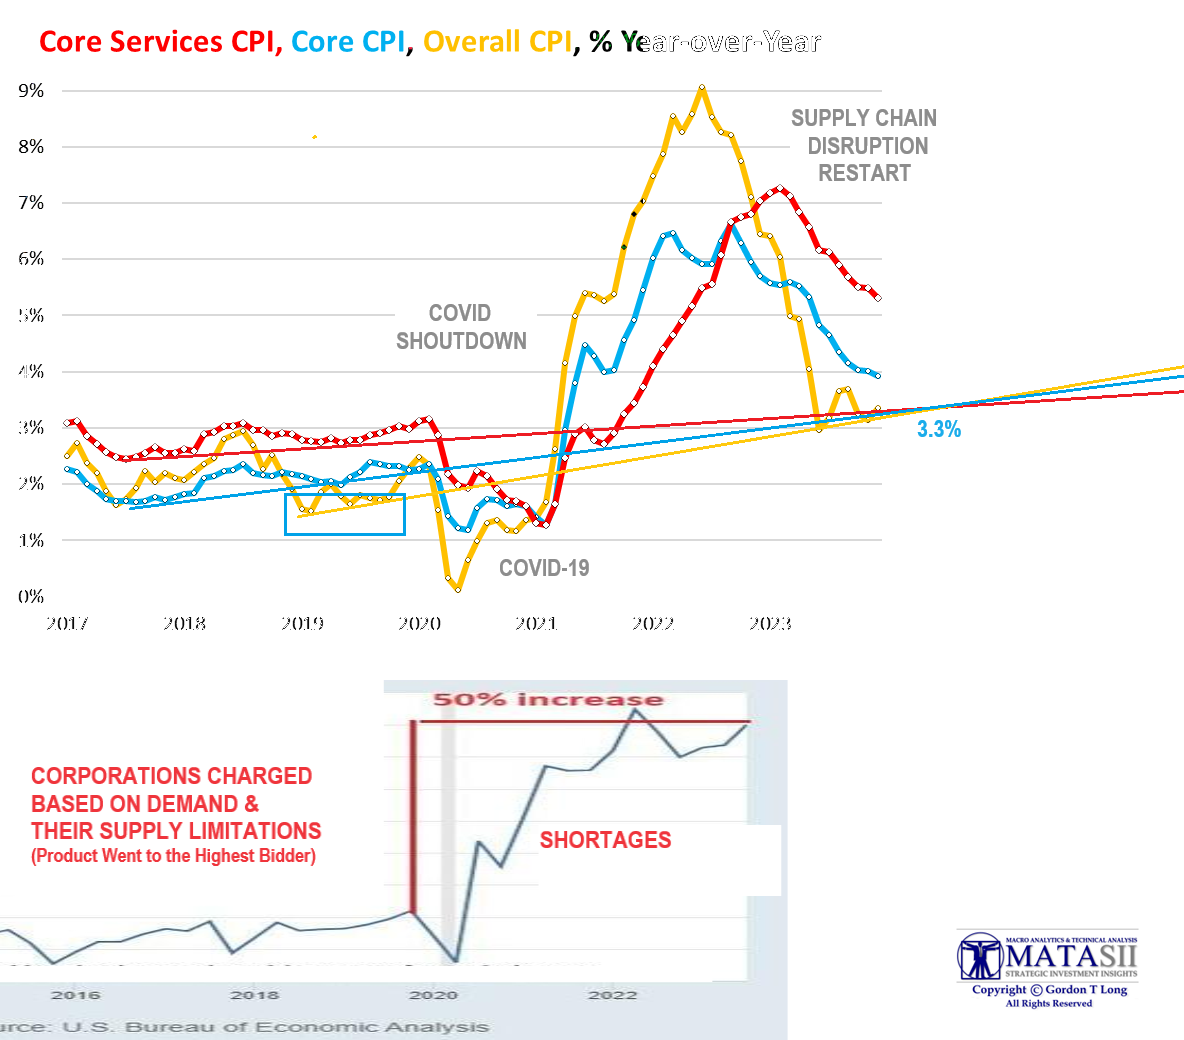
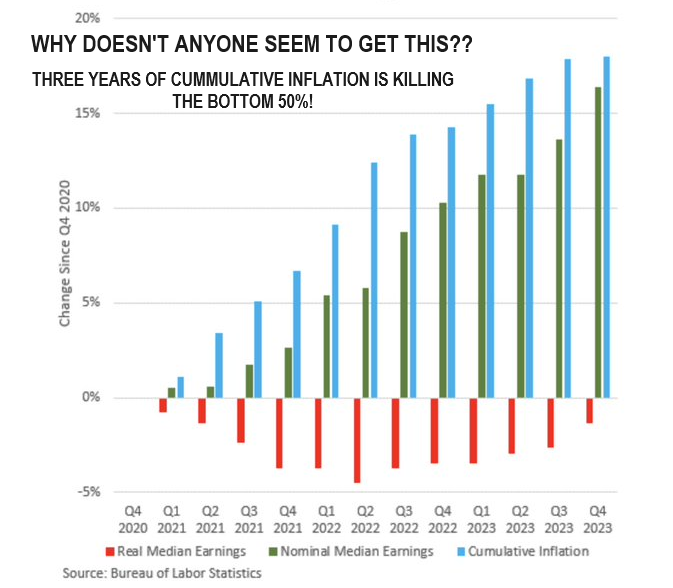 CUMMULATIVE INFLATION IS KILLING THE BOTTOM
50% OF AMERICANS
Despite a post Covid recovering economy, real after-tax take-home pay is still underwater for most Americans. According to BLS data, workers in the bottom half of incomes still haven’t caught up to inflation. That leaves many Americans unable to afford what they could just 3 years ago!
RESEARCH
CHINA HAS LOST ITS COMPETITIVE ADVANTAGE
-
- The competitive labor advantage China once had is no longer the situation compared to other developing nations.
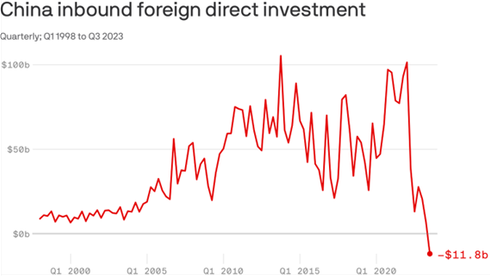
- China is a nation dependent on Capital Formation, which is ~43% of its GDP. This has placed China in a very serious predicament as Foreign Direct Investment (FDI) support has quite literally “fallen off a cliff”. Profits are not being reinvested but re-patriated, and corporations are nervous about the direction the increasingly dictatorial path the CCP is taking.
- China’s growth model has been over-Reliant on policies of extraordinary levels of Investment and Financial Repression. Financial Repression, as used here, has nothing to do with the usual political usage of the word. It means, rather, that the state controls:
- Domestic interest
- Exchange rates and
- Capital Outflows
- As such, citizens receive little accrual or benefit from their high rates of savings. Instead, these are captured by the state and channeled into industries that are favored or prioritized by bureaucrats, including many that are state-owned (SOE).
Q4 2023 EARNINGS SEASON
-
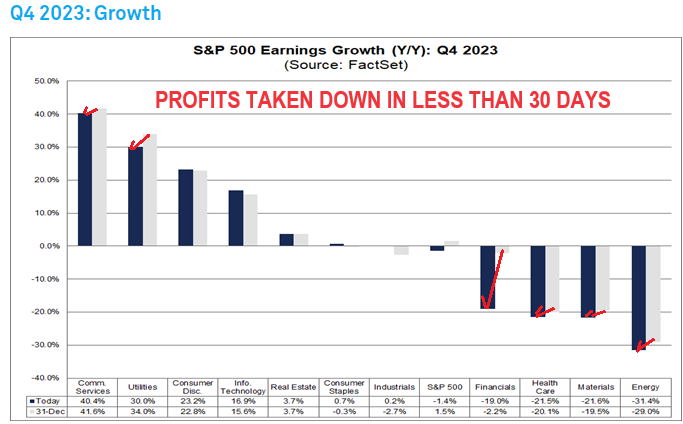
- For Q4 2023, the blended (year-over-year) earnings decline for the S&P 500 is -1.4%. If -1.4% is the actual decline for the quarter, it will mark the fourth time in the past five quarters that the index has reported a year-over-year decline in earnings.
CORPORATIONS ARE LOSING PRICING POWER (WEAK REVENUE GROWTH)
AS BOTH CONSUMER SAVINGS AND REAL DISPOSABLE INCOME INCREASINGLY TIGHTEN!
DEVELOPMENTS TO WATCH
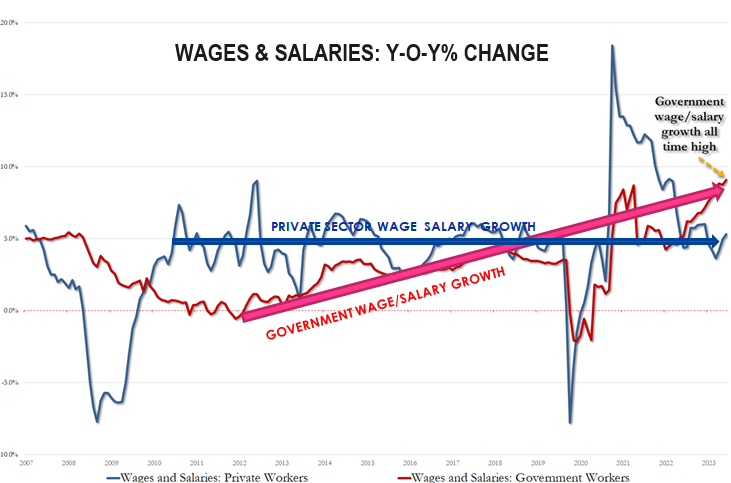
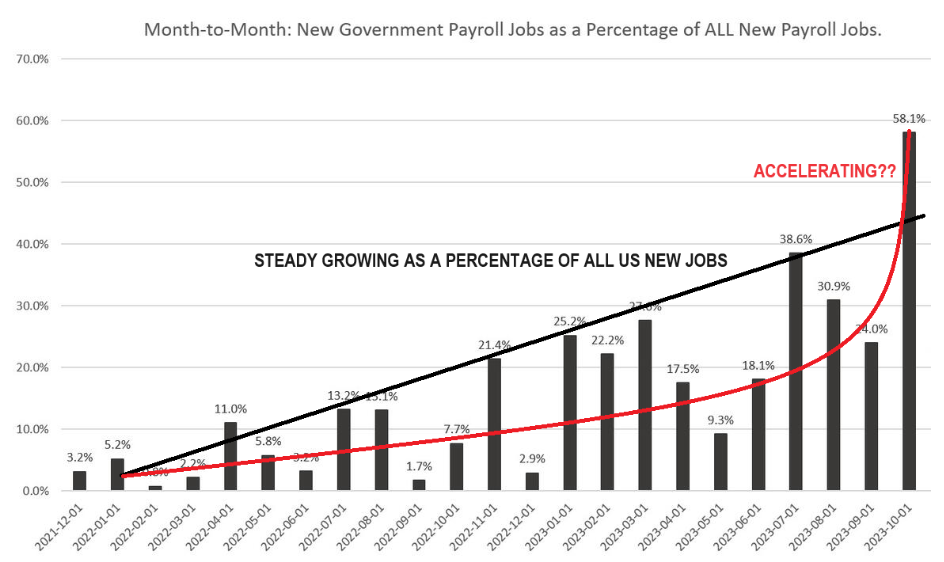
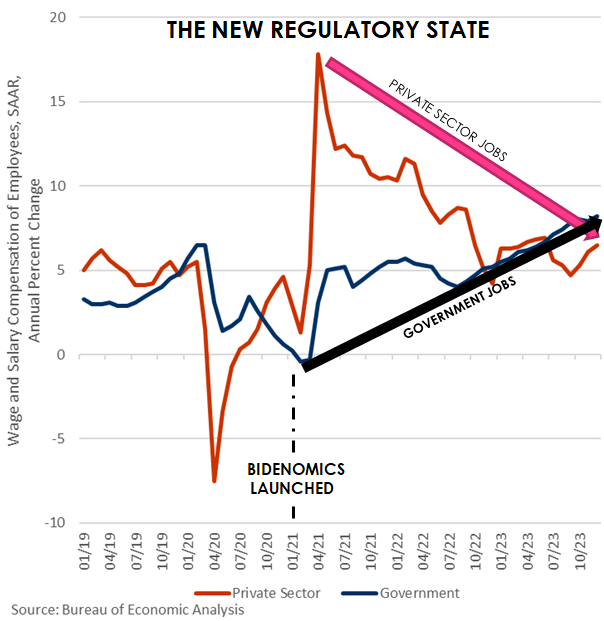 AN EXPANDING US GOVERNMENT KEEPS JOB & WAGE GROWTH ALIVE.
While private sector compensation struggles to keep up with inflation, government wages and salaries in Dec rose 8.2% Y/Y, their fastest annual rate since Jul ’90 – all that gov’t spending has to go somewhere?
DAVOS HIGHLIGHTS: THE ELITES ARE SOLVING PROBLEMS THAT EXIST ONLY IN THEIR HEAD!
The 2024 World Economic Forum (WEF) in Davos, Switzerland, included many plethora of key themes. Some of the key takeaways include:
-
- Disease “X” is a major concern and well discussed.
- Democracy is critically exposed by the potential election of populist leaders such as Trump.
- Tighter controls of Misinformation must be implemented.
- The climate crisis is a health crisis: The connections between climate and health are becoming clearer.
GLOBAL ECONOMIC REPORTING
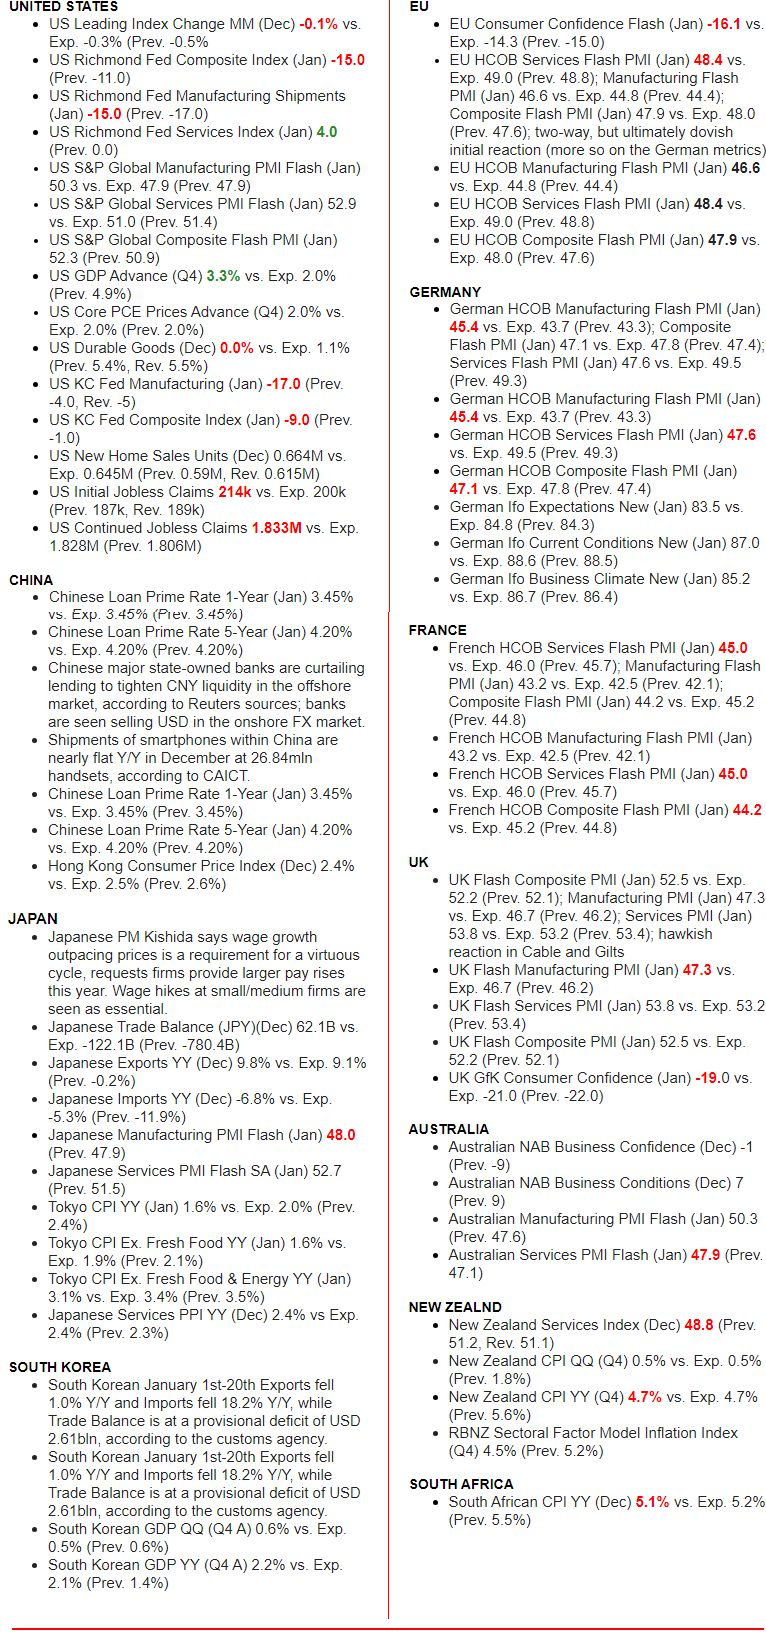
What This Week’s Key Global Economic Reports Tell Us?
-
- STRONG GDP growth (but cool inflation)
- STRONG New Home Sales (but cool home prices)
- STRONG LABOR MARKET DATA (jobless claim rose, but remains near multi-decade lows) all set the tone for the day .
- WEAK NATIONAL ACTIVITY data from The Chicago Fed
- WEAK MANUFCATURING data from The Kansas City Fed
- WEAK HEADLINE DURABLE GOODS ORDERS
-
- $1.55 in budget deficit to generate $1 of growth
- $2.50 in new debt to generate $1 of GDP growth
CHINA HAS LOST ITS COMPETITIVE ADVANTAGE
 China’s unprecedented Economic growth since entering the World Trade Organization (WTO) in 2002 was a large inexpensive labor force. Corporations flooded into China to capitalize on basically a labor arbitrage advantage. Over 50,000 manufacturing facilities left the US alone as less restrictive regulations, tax advantages and a supportive new form of Chinese Capitalism made it powerfully appealing.
Slowly, that has all changed! Xi Jinping has become almost predatory against non-state owned corporations (SOE), government controlling regulations have become increasing obstacles and there is a fear of getting profits out of China. These however are secondary to the primary reason corporations went to China. The competitive labor advantage is no longer there compared to other developing nations (chart right).
The influx of investment capitals over the last two decades into China created an Economy built on Capital Formation. Whereas the US is dependent on being a nearly 70% consumption economy, China has become a nation dependent on Capital Formation which is ~43% of its GDP. This has become a very serious problem for China as Foreign Direct Investment (FDI) support has quite literally “fallen off a cliff”. Profits are not being reinvested but re-patriated and corporations are nervous about the direction the increasingly dictatorial path the CCP is taking.
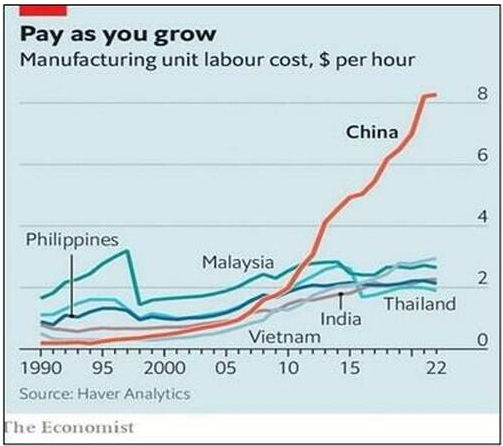
 China’s exploding manufacturing unit labor cost (see chart above right from the Economist) is now a systemic problem for China. The Commercial and Residential Housing markets are collapsing, stock markets are steadily falling, youth unemployment is approaching 25% and rich Chinese are increasingly trying to get their money out of the country.
China’s growth model has been over-reliant on policies of extraordinary levels of Investment and Financial Repression. Financial Repression as used here has nothing to do with the usual political usage of the word. It means, rather, that the state controls:
-
- Domestic interest
- Exchange rates and
- Capital Outflows
… in such a way that citizens receive little accrual or benefit from their high rates of savings. Instead, these are captured by the state and channeled into industries that are favored or prioritized by bureaucrats, including many that are state-owned.
Some of the problems that might arise from Financial Repression can seem apparent even to lay people. Bureaucrats tend to know little about business and are unlikely to be in the best position to make the smartest and nimblest economic bets about the industrial future. Some features of this setup may be less than obvious, though.
When the state captures and invests the nation’s savings according to its own whims, capital becomes scarcer and more expensive for private investors. This also suppresses the domestic consumption that most mature economies depend on for growth.
Finally, as the state channels more and more investment into industries of its choosing, average return on investment falls.
China is now at the point where it must invest huge amounts of capital to produce each new dollar of economic growth, and everything points to this continuing to worsen.
Q4 2023 EARNINGS:
 KEY METRICS
-
- Earnings Scorecard: For Q4 2023 (with 25% of S&P 500 companies reporting actual results), 69% of S&P 500 companies have reported a positive EPS surprise and 68% of S&P 500 companies have reported a positive revenue surprise.
- Earnings Decline: For Q4 2023, the blended (year-over-year) earnings decline for the S&P 500 is -1.4%. If -1.4% is the actual decline for the quarter, it will mark the fourth time in the past five quarters that the index has reported a year-over-year decline in earnings.
- Earnings Revisions: On December 31, the estimated (year-over-year) earnings growth rate for the S&P 500 for Q4 2023 was 1.5%. Six sectors are reporting lower earnings today compared to December 31 due to negative EPS surprises and downward revisions to EPS estimates.
- Earnings Guidance: For Q1 2024, 14 S&P 500 companies have issued negative EPS guidance and 9 S&P 500 companies have issued positive EPS guidance.
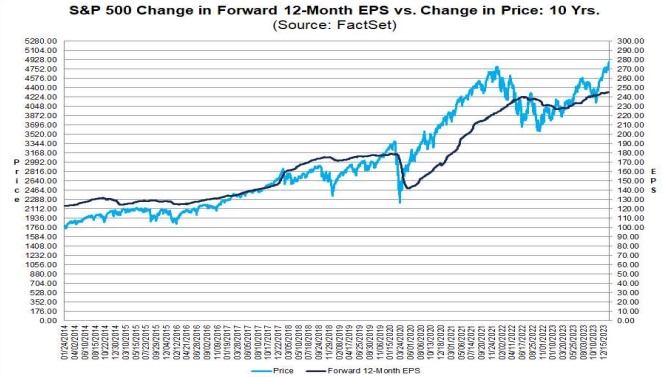
- Valuation: The forward 12-month P/E ratio for the S&P 500 is 20.0. This P/E ratio is above the 5-year average (18.9) and above the 10-year average (17.6).
CORPORATIONS ARE LOSING PRICING POWER
AS SAVINGS AND REAL DISPOSABLE INCOME FALL!
DEFENSE CONTRACTORS: Business Has Never Been Better!!
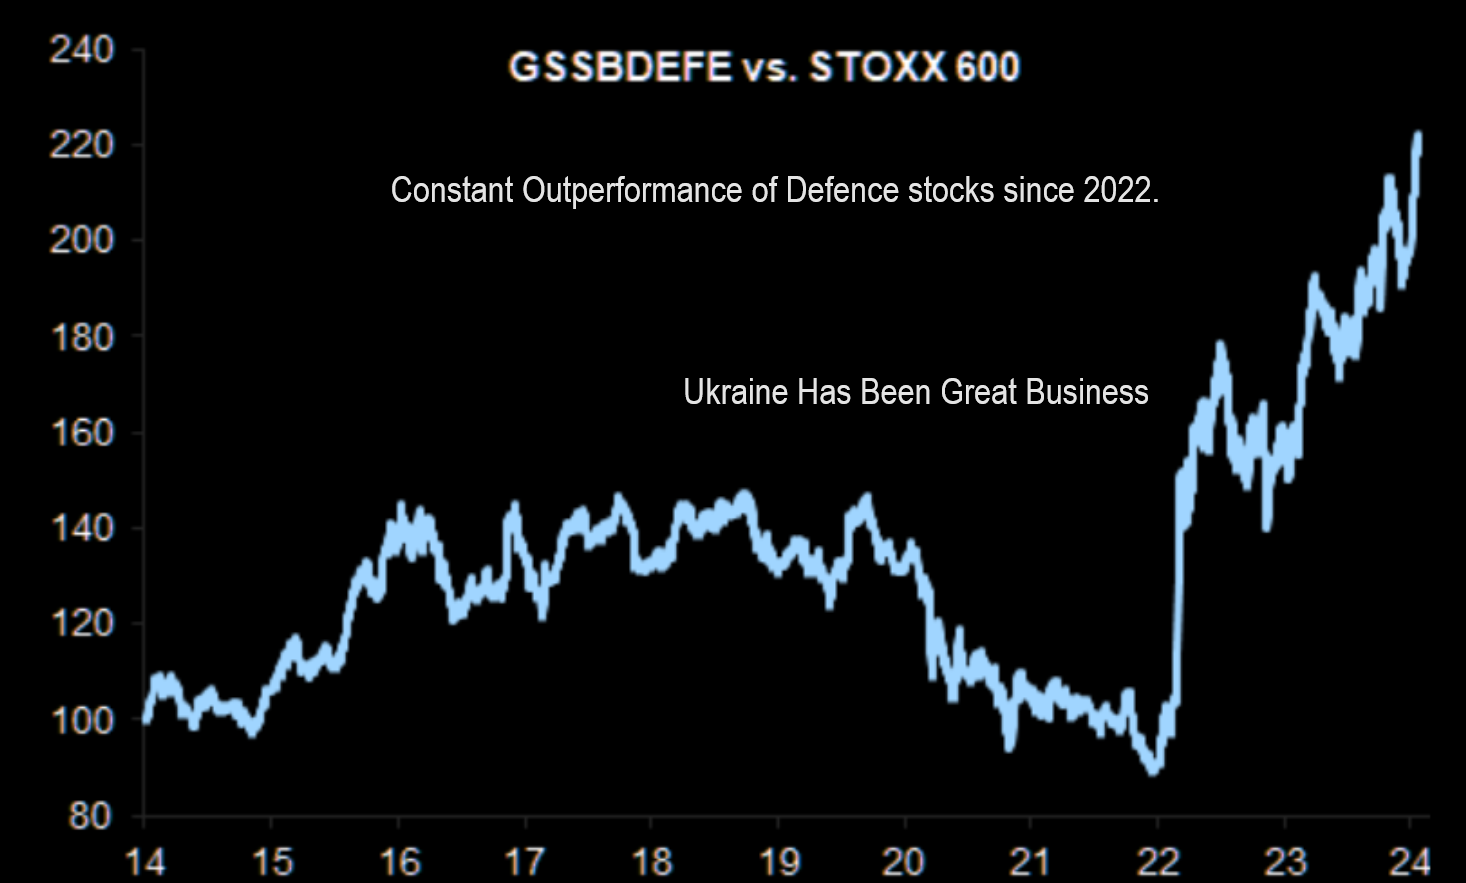 Ukraine Winds Down As “Global Pirating” Is added to the War-on-Terror Profits!
- RTX (RTX): +5.3%: Q4 earnings beat and expects continued sales and earnings growth in 2024.
- HALIBURTON (HAL): +2.5%: Profit beat and lifted quarterly dividend 1 cent.
- LOCKHEED MARTIN (LMT): -4.2%: FY EPS view fell short of strong Wall St. consensus.
- GENERAL DYNAMICS (GD): +4.9%: Revenue rose on strong defense demand.
- TEXTRON (TXT): +7.9%: Profit beat alongside a strong FY24 forecast.
- NORTHROP GRUMMAN (NOC) -6%: Swung to a surprise loss in the quarter due to a special initial contractual acceptance charge on the B21 bomber program.
DEVELOPMENTS TO WATCH
AN EXPANDING US GOVERNMENT KEEPS JOB & WAGE GROWTH ALIVE
While private sector compensation struggles to keep up with inflation, government wages and salaries in Dec. rose 8.2% Y/Y, their fastest annual rate since Jul ’90!
Government Cities like Washington DC, State Capitals and Government Centers have strong retail sales, elevated housing prices and strong cultural liberal arts communities.
Remember: All that gov’t spending has to go somewhere?
RETIREMENT PENSIONS
Never forget. The Private sector no longer has pensions with the shift from Defined Benefits to Contributory Benefits over the last 25 years. Government employees have full pensions at ages that often allow a second port retirement career.
DAVOS HIGHLIGHTS: THE ELITES ARE SOLVING PROBLEMS THAT EXIST ONLY IN THEIR HEAD!
 The 2024 World Economic Forum (WEF) in Davos, Switzerland, included many plethora of key themes.
Some of the key takeaways include:
-
- Disease “X” is a major concern and well discussed.
- Democracy is critically exposed by the potential election of populist leaders such as Trump.
- Tighter controls of Misinformation must be implemented,
- The climate crisis is a health crisis: The connections between climate and health are becoming clearer.
- Closing global health equity gaps is a global effort: Investments in women’s health could add years to life and life to years.
- Sustainable farming practices are needed to curb hunger: Investing in jobs, skills and people is a key talking point.
- Artificial Intelligence (AI) is a key theme: “Rebuilding Trust” considers AI and how it acts as a driving force to maximize economic and societal opportunities.
- The world order is changing: There are tensions between America and China, and the rise of more powerful, middle-power-type countries around the world.
Other takeaways include:
-
- Business leaders see no recession in 2024.
- The world’s energy security discussions remained muted as corporates decided to adopt a more cautious stance.
GLOBAL ECONOMIC INDICATORS: What This Week’s Key Global Economic Releases Tell Us
 WHAT WE SAW THIS WEEK:
-
- STRONG GDP Growth (but cool inflation)
- STRONG New Home Sales (but cool home prices)
- STRONG LABOR MARKET DATA (jobless claim rose but remain near multi-decade lows) all set the tone for the day.
- WEAK NATIONAL ACTIVITY data from The Chicago Fed
- WEAK MANUFCATURING data from The Kansas City Fed
- WEAK HEADLINE DURABLE GOODS ORDERS
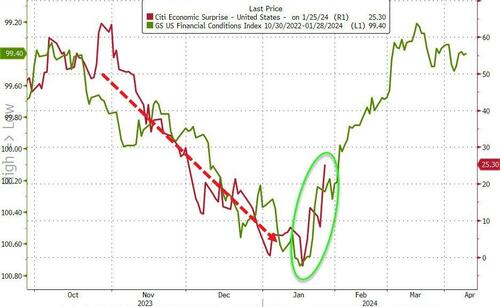
But, (Chart Right Above)
-
- The Macro Surprise Index is accelerating right when it is expected to, as the lagged impact of the massive easing of Financial Conditions floods into the economy.
ADVANCED GDP
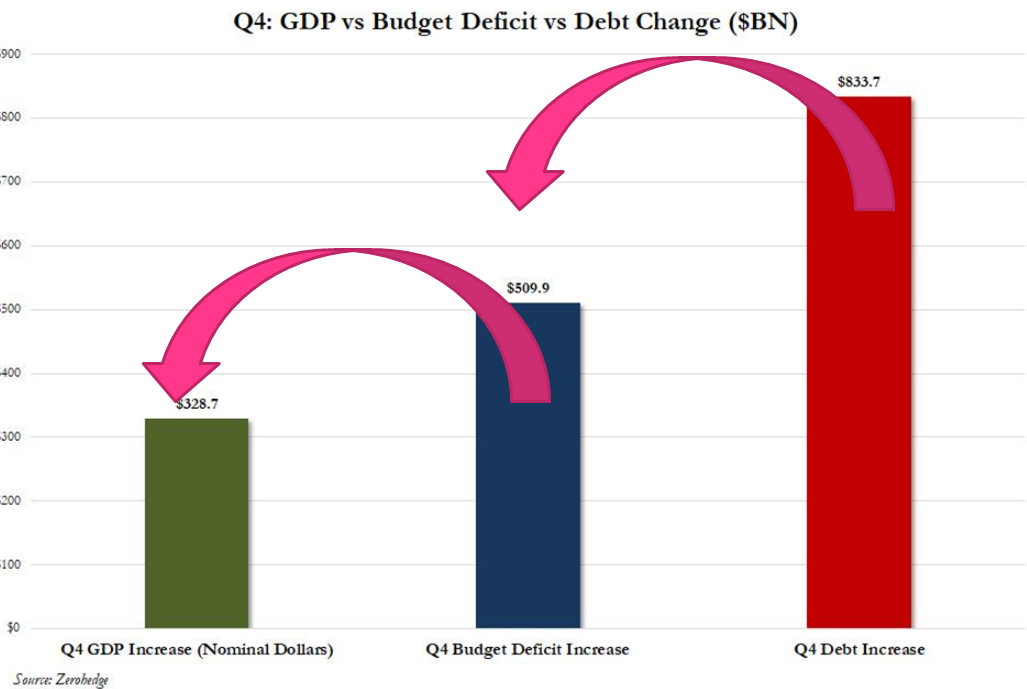 While Q4 GDP rose by $329 billion to $27.939 trillion, a respectable if made up number, what is much more disturbing is that over the same time period, the US budget deficit rose by more than 50%, or $510 billion. And the cherry on top: the increase in public US debt in the same three month period was a stunning $834 billion, or 154% more than the increase in GDP.
In other words, it now takes
-
- $1.55 in budget deficit to generate $1 of growth
- $2.50 in new debt to generate $1 of GDP growth.
HEADLINE GDP was hot, seeing growth of 3.3% in Q4 ’23, above the expected 2.0% and also above the Atlanta Fed tracker of 2.4%, but easing from the Q3 pace of 4.9%.
It was also above the forecast range where analysts looked for 0.8-2.8%.
-
- Although GDP was hot, the inflationary metrics were cool.
- The GDP Deflator grew 1.5%, beneath the 2.3% forecast and down from the prior 3.3%. PCE eased to 1.7% from 2.6%, while the core PCE printed 2.0%, in line with expectations and the prior.
- The super core metrics, ex food, energy and housing, eased to 1.2% from 1.3%, while PCE services ex food, energy and housing eased to 2.6% from 2.9%.
- Meanwhile, consumer spending eased to 2.8% from 3.1%.
- The hot GDP and easing price pressures show evidence of a soft landing, although if growth continues at this pace of strength it could slow the process of inflation returning to the 2% target.
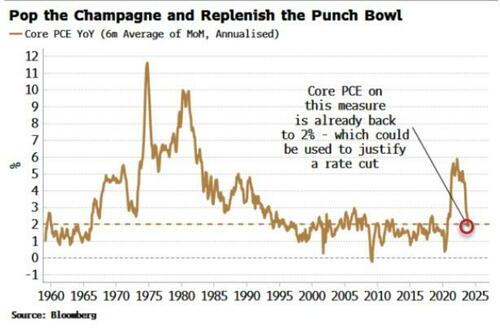
PERSONAL CONSUMPTION EXPENDITURE (PCE)
Taking the average of the last six months of core PCE month-on-month changes and annualizing it gets the measure to 1.9%, under the Fed’s 2% target.
 Overall, the PCE data was in line with expectations with the headline M/M rising 0.2%, up from the prior -0.1%, with Y/Y matching the prior 2.6%.
-
- Core M/M rose by 0.2% up from November’s 0.1%, while the Core Y/Y eased to 2.9% from 3.2%, a touch beneath the 3.0% forecast.
- Looking into the report, however, the Fed eyed Core PCE Services ex housing rose 0.3%, accelerating from the prior 0.1%, while core prices ex housing rose 0.1%, up from the 0.0% in November.
- There was a lot of attention on the annualized metrics too however, the 6mth annualized rate eased to 1.9% with the 3mth at 1.5%, both beneath the Fed’s 2% target.
- Overall, money market pricing was little changed in wake of the data, with markets pricing in the first cut by May with a c. 50% probability of an earlier cut in March.
- Analysts at Oxford Economics write that ” By late April, we expect the Fed will have enough confidence to begin cutting interest rates at its late April/early May meeting, although the backdrop of a strong economy means it is likely to only cut rates gradually this year.”
- Elsewhere in the report, consumer spending was strong, rising 0.7% in December, above the 0.4% forecast while the prior was revised up to 0.4%.
- Personal income rose 0.3%, in line with expectations, although the US savings rate declined to 3.7% from 4.1%, the lowest since 2022.
GLOBAL MACRO
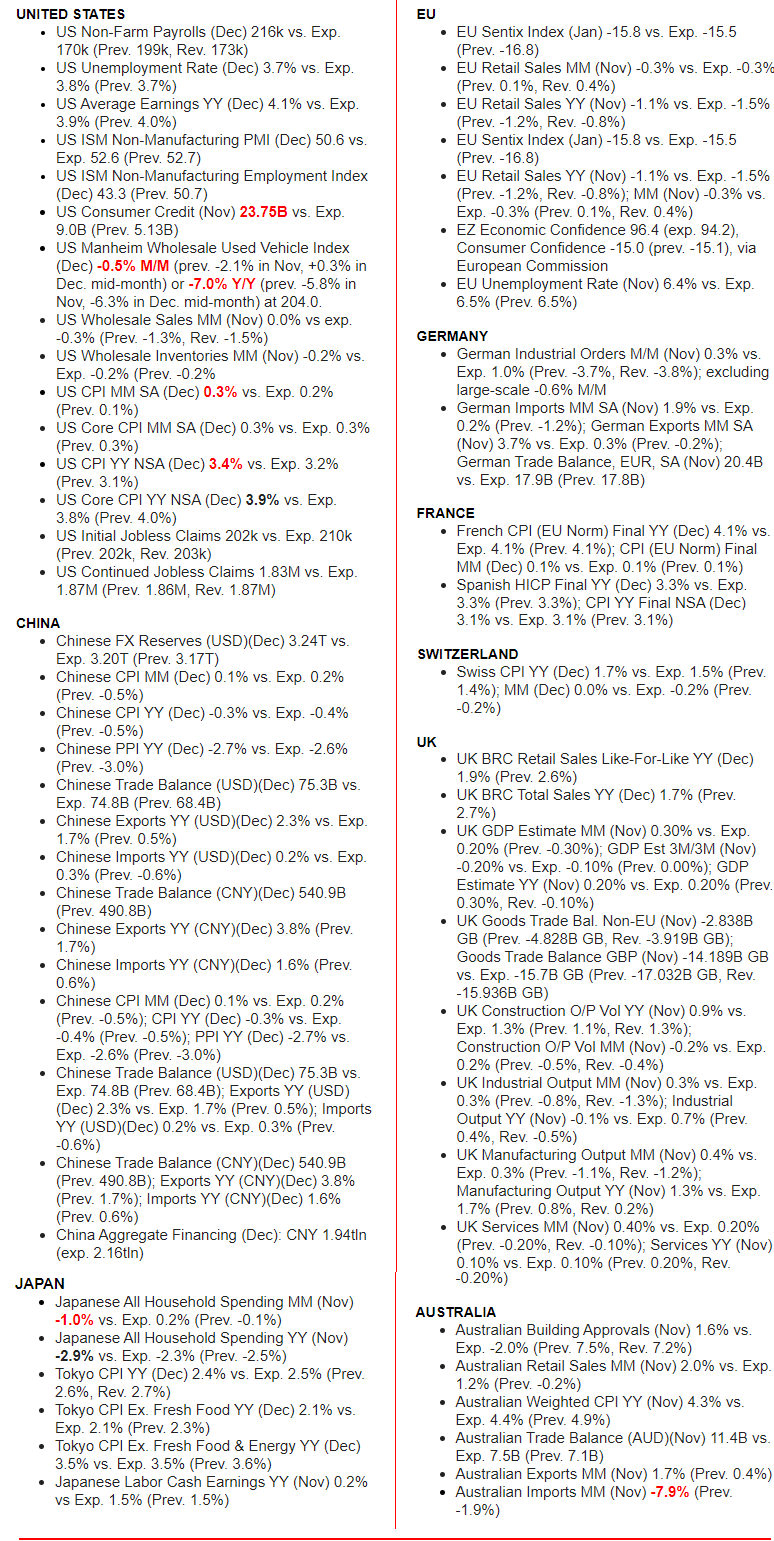
WHAT DOES YOUR SCAN OF THE DATA BELOW TELL YOU? – THE MEDIA AVOIDS BAD NEWS!
We present the data in a way you can quickly see what is happening.
THIS WEEK WE SAW
Exp=Expectations, Rev=Revision, Prev=Previous
FED “EFFECTIVE IMMEDIATELY” SHUTS DOWN
BIG BANK BTFP “ARB” GAME
THE LIQUIDITY SPIGOT IS BEING “ADJUSTED”
Click All Charts to Enlarge
1 – SITUATIONAL ANALYSIS
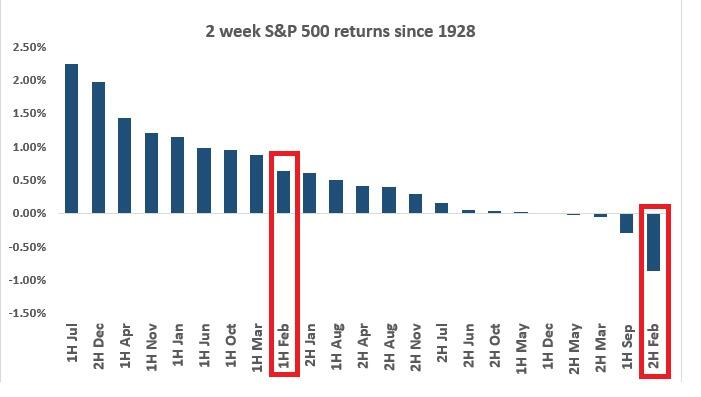 The dichotomy between the first half of February and the second half from a seasonal perspective is dramatic to say the least (chart right).
For those worried about any froth in the US markets, the last two weeks in February are historically the worst 2 weeks of the year. Given how well markets followed the historical analog last year, it’s something to have on the radar.
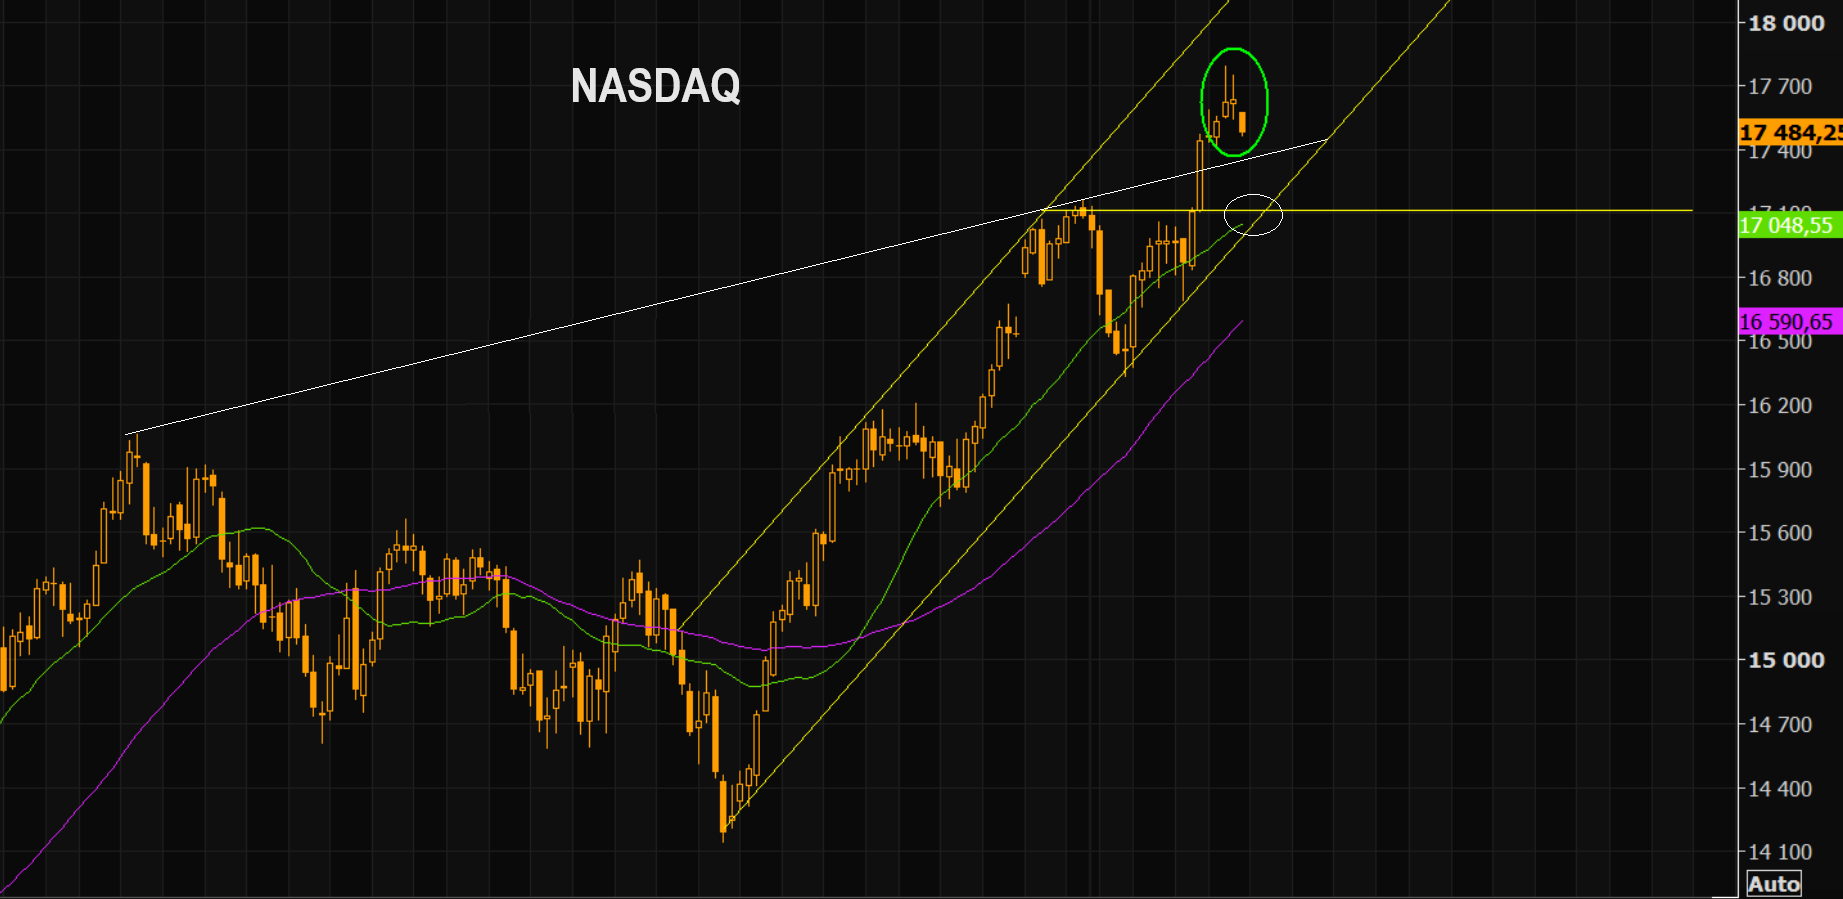
CHART BELOW
NASDAQ is basically trading at the same levels we traded at six sessions ago, at highs of that huge up candle, shown below. We have had two reversal candles, one shooting star and a doji, both indicating potential exhaustion in the short term. Let’s see how this plays out, but the perceived bull has been stronger than the realized over the past sessions. 17k is the big support to watch.
2 – FUNDAMENTAL ANALYSIS
BEWARE STEALTH LIQUIDITY AT WORK
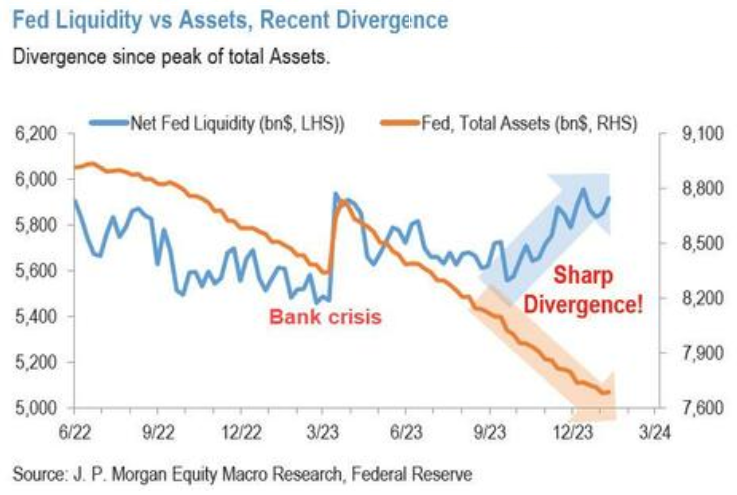 US Equity markets have historically and reliably tracked the Fed Balance sheet quite closely. However, since late October the divergence has grown significantly. It was at this point that the large US Banks began arbitraging the BTFP spread. We pointed this out in our Stealth Liquidity – Stage II identification (see chart). However, the Federal Reserve abruptly ended that last week in advance of the BTFP scheduled to end in March, in lieu of using the Fed’s Discount Window.
This has left the market with some large divergences that likely need to be resolved.
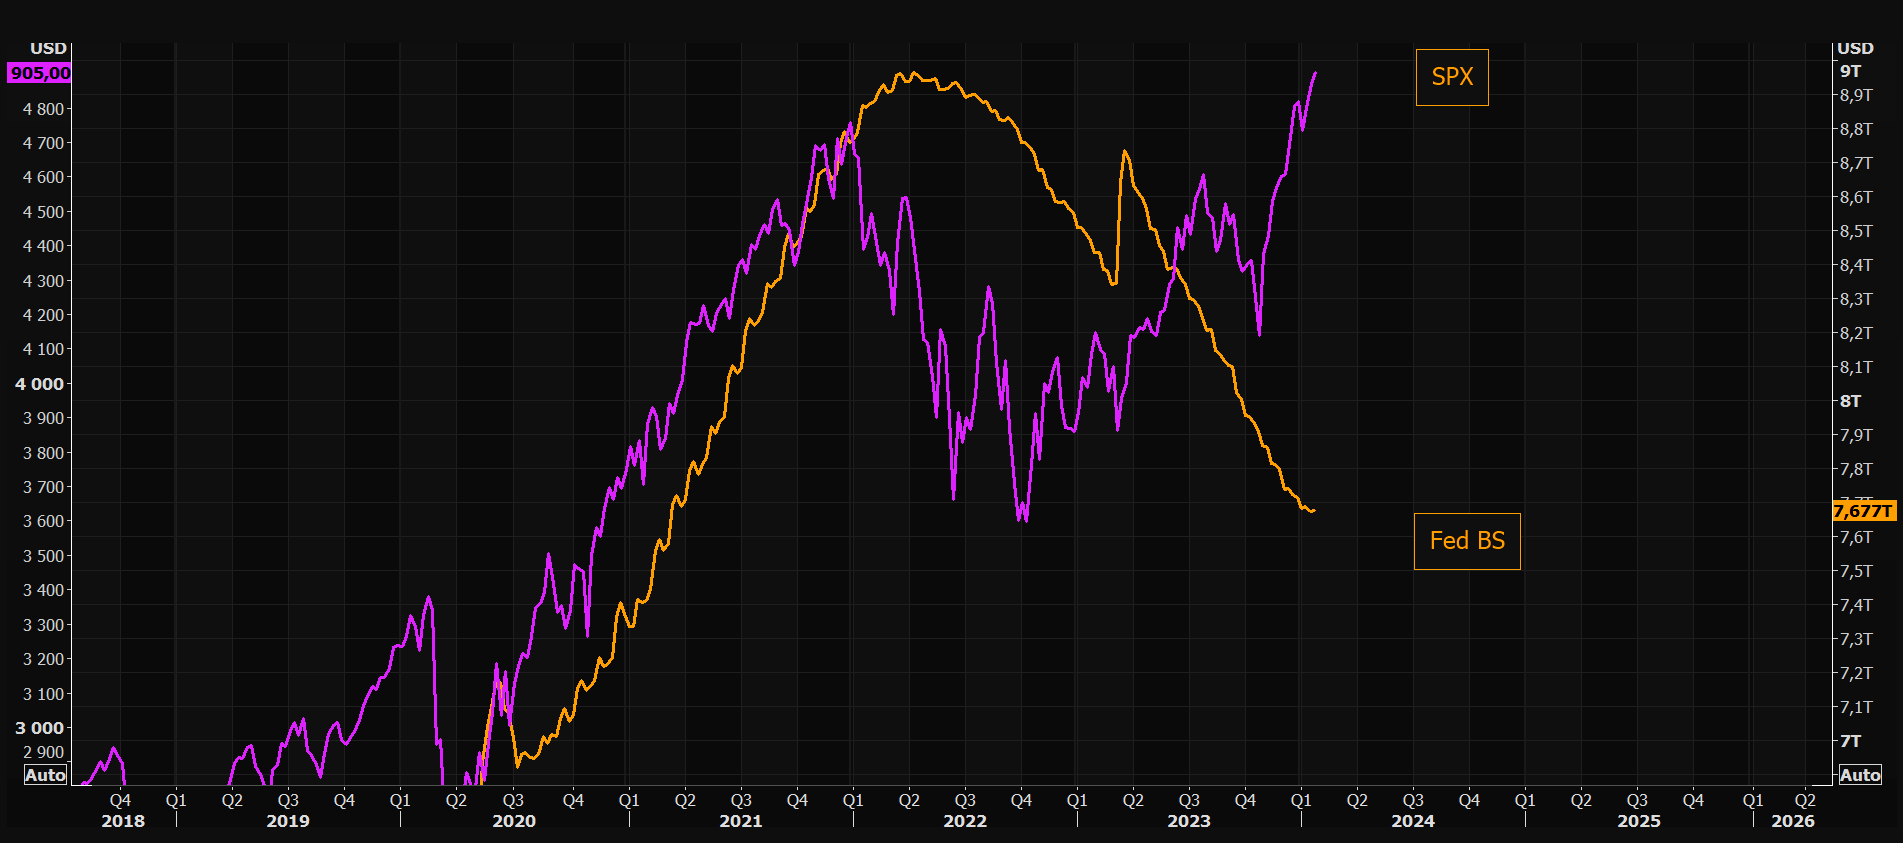
You decide if Fed’s BS matters or not, but the gap between the BS and the SPX is huge.
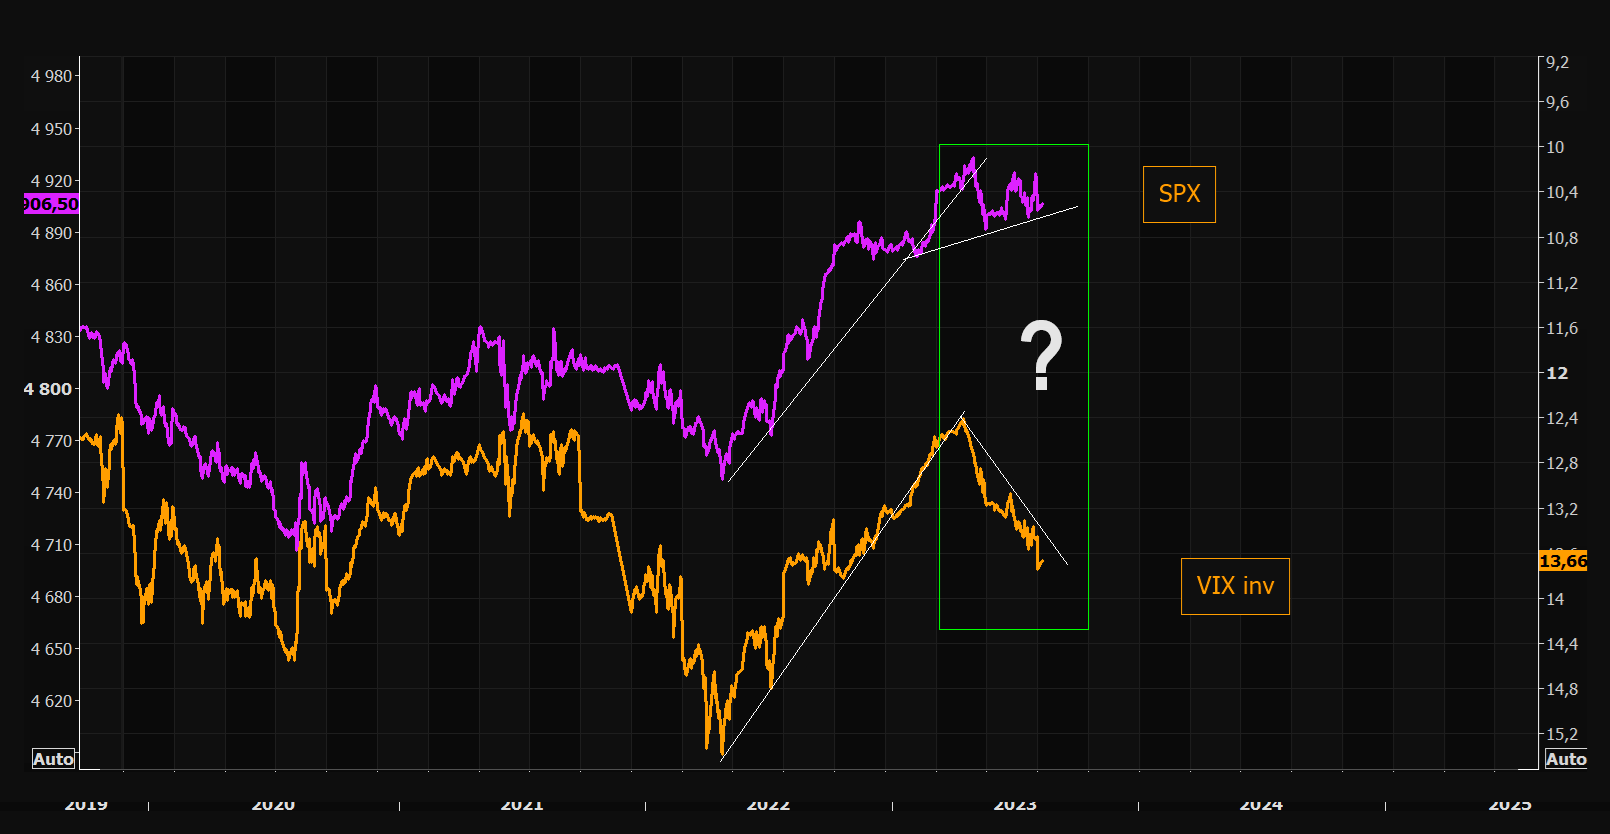
CHART BELOW: The short term gap between SPX and VIX (inverted) is getting rather wide. 10 min chart YTD.
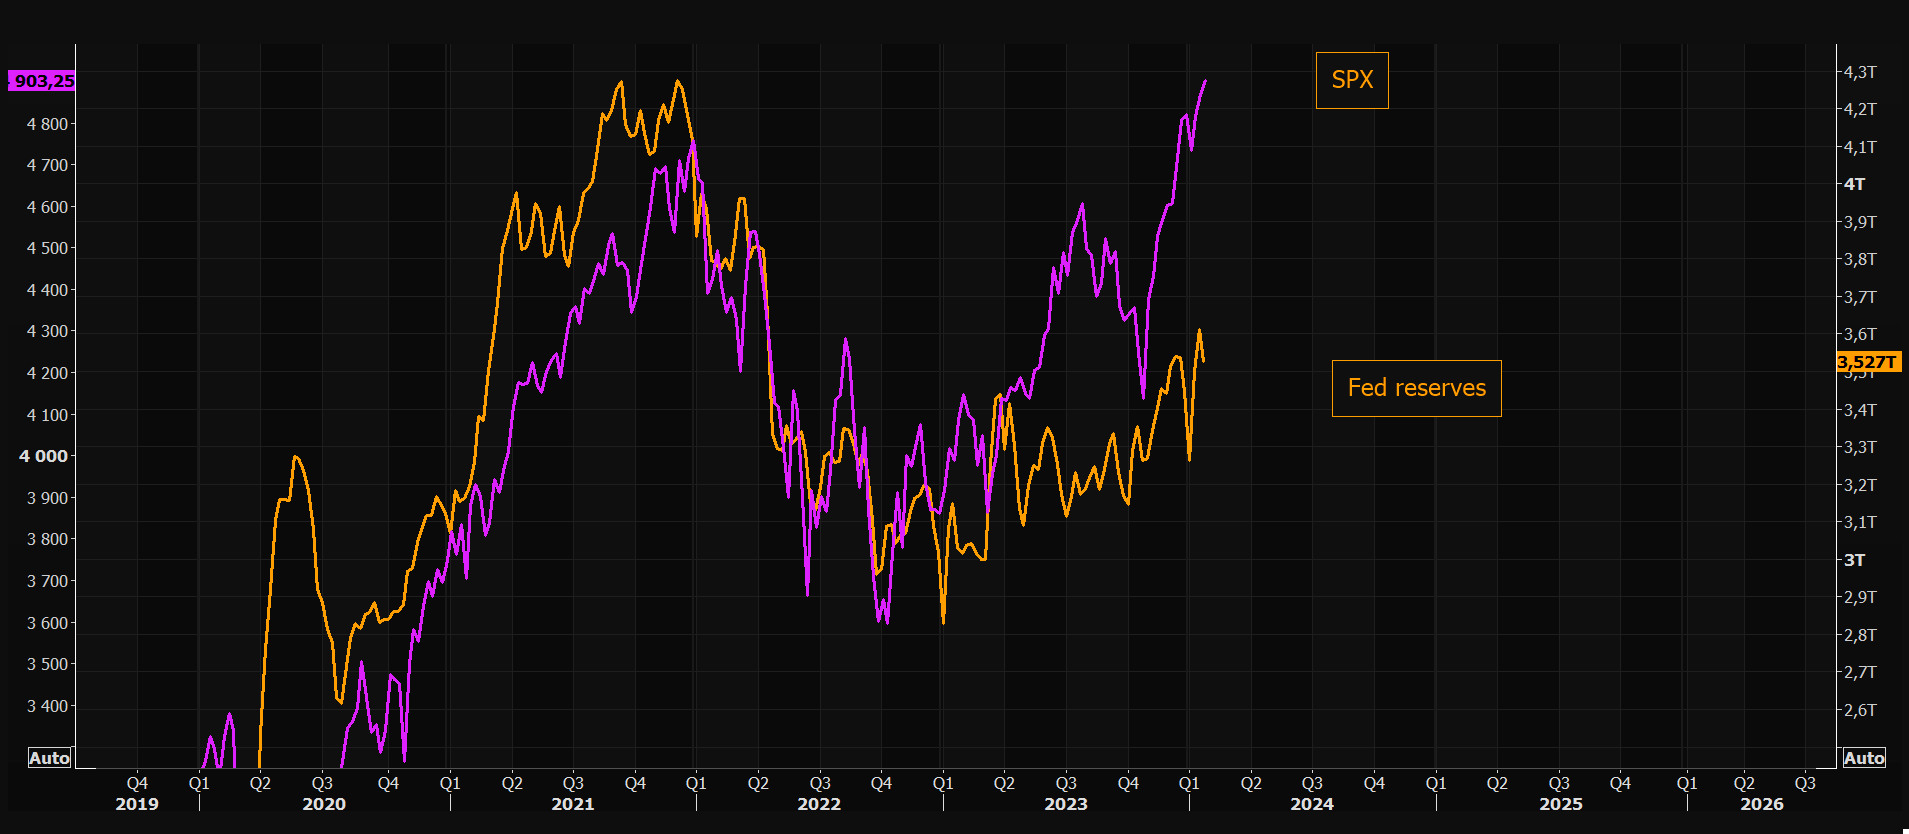
The SPX has overshot Fed reserves, but they have both moved higher over the past months. Noteworthy is the last little “reversal” in reserves. Chasing hedges instead of the market here is attractive.
3 – TECHNICAL ANALYSIS
US EQUITY MARKETS
Below are updated charts for the EW counts we outlined in the subscribers’ mid-week “On Gord’s Desk” report.
CONTROL SET
There are FIVE charts we have outlined in prior chart packages that we will continue to watch closely as a “control set” over the next 10 days.
-
- The S&P 500 (CHART LINK)
- The DJIA (CHART LINK)
- The Russell 2000 through the IWM ETF (CHART LINK),
- The MAGNIFICENT SEVEN (CHART ABOVE WITH MATASII CROSS – LINK)
- Nvidia (NVDA) (CHART LINK)
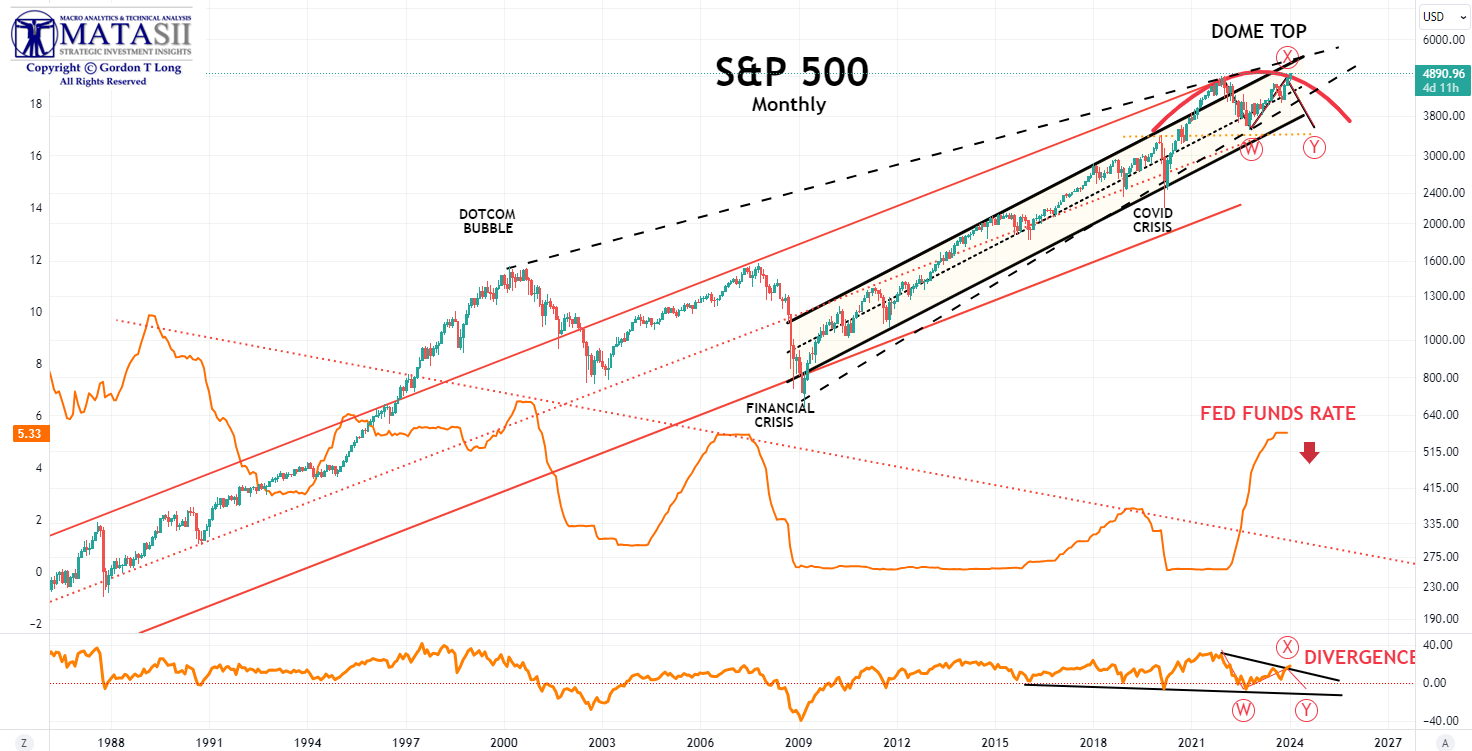
S&P 500 Monthly
There are a number of viable counts for the current S&P 500 that should ALL be considered.
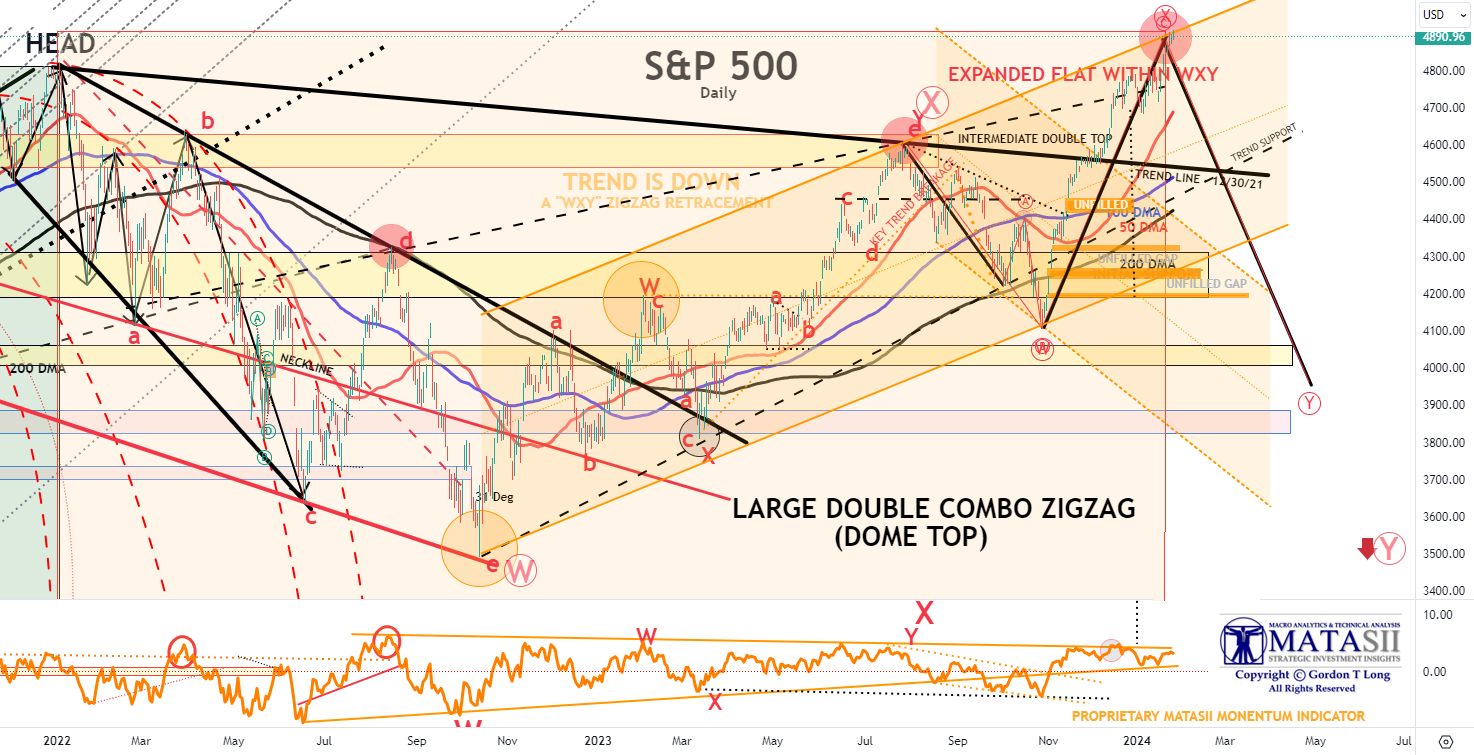
To put the Elliott Wave (EW) counts in perspective, we return to a Long Term Monthly view of the S&P 500 where we believe we are putting in a “Generational” high. This major structure is marked by a “Doom Top” which takes considerable time to complete.
We believe the “Doom Top” is currently completing a large degree “WXY” structure with the “Y” wave still ahead in 2024.
YOUR DESKTOP / TABLET / PHONE ANNOTATED CHART
Macro Analytics Chart Above: SUBSCRIBER LINK
S&P 500 – Daily
This count of the S&P 500 suggests we are competing an Expanded Flat Corrective within the “Y” wave of the WXY pattern. When it is completed, the initial drop will fill the open gaps down through ~3850.
YOUR DESKTOP / TABLET / PHONE ANNOTATED CHART
Macro Analytics Chart Above: SUBSCRIBER LINK
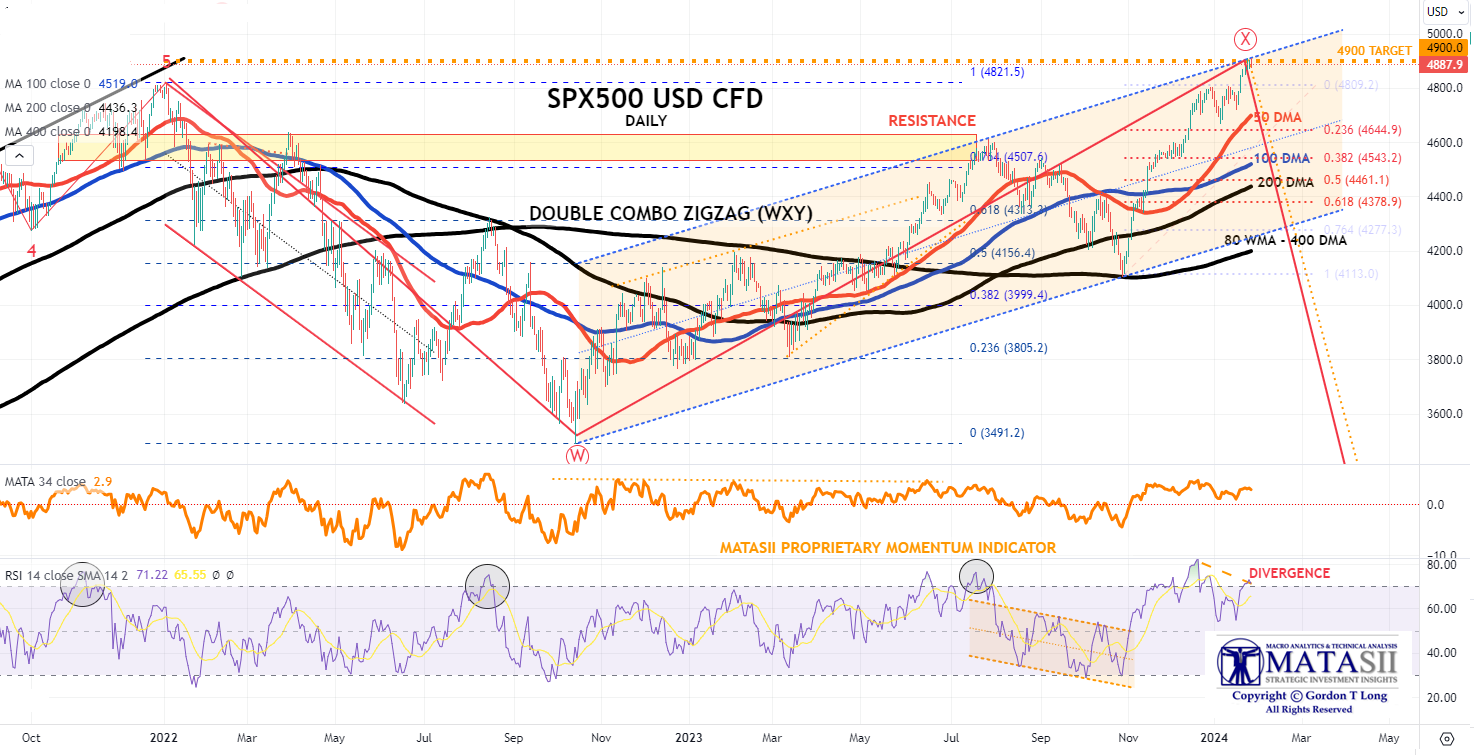
S&P 500 – Daily
This count of the S&P 500, using the continuously trading CFD, suggests we are still completing the “X” wave of the WXY pattern. If this is the case, the initial drop will potentially be even larger.
YOUR DESKTOP / TABLET / PHONE ANNOTATED CHART
Macro Analytics Chart Above: SUBSCRIBER LINK
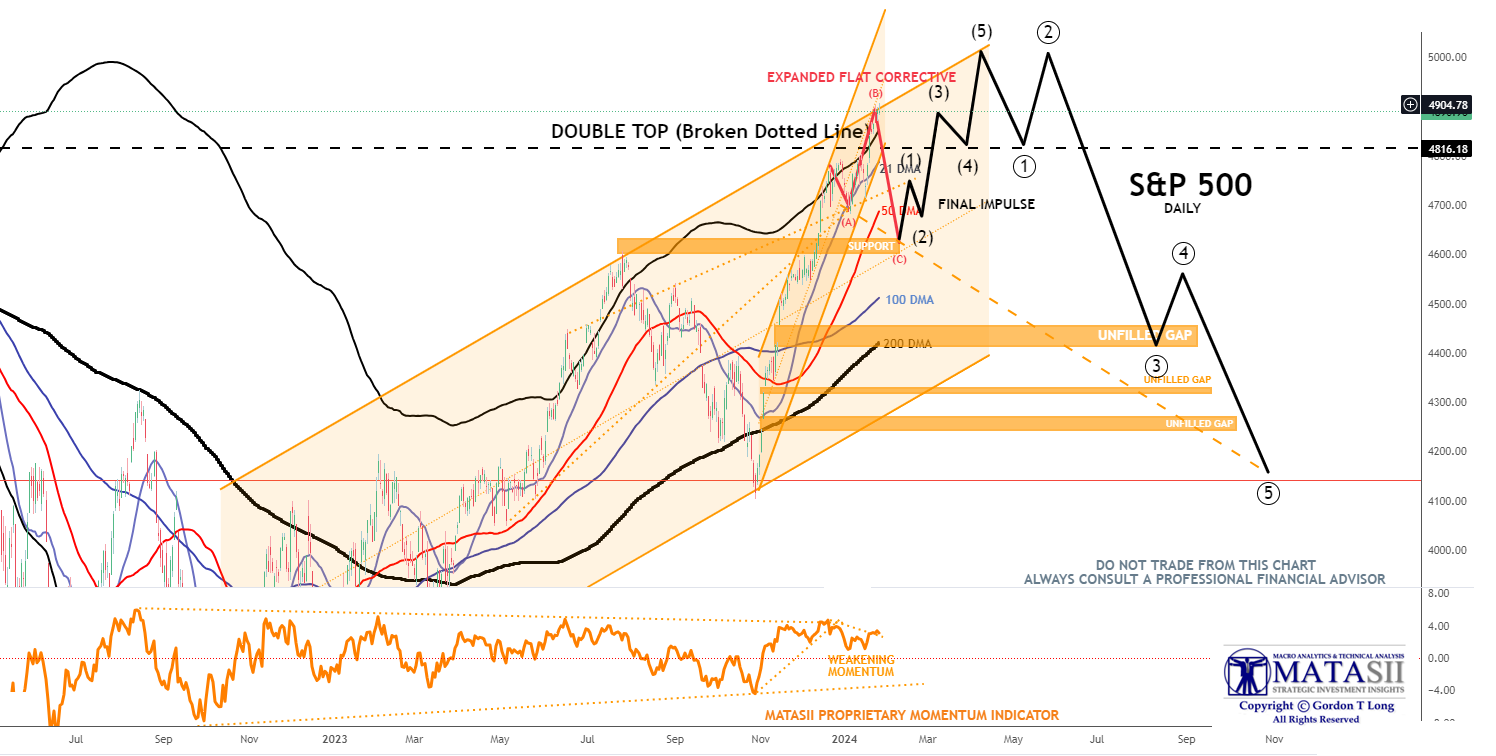
S&P 500 – Daily – Our Though Experiment
Our “Thought Experiment”, which we discussed in last weekend’s chart package, suggests we still have higher to go with a final Impulse Wave (in black). We are currently completing the (B) wave of an expanded flat corrective structure.
YOUR DESKTOP / TABLET / PHONE ANNOTATED CHART
Macro Analytics Chart Above: SUBSCRIBER LINK
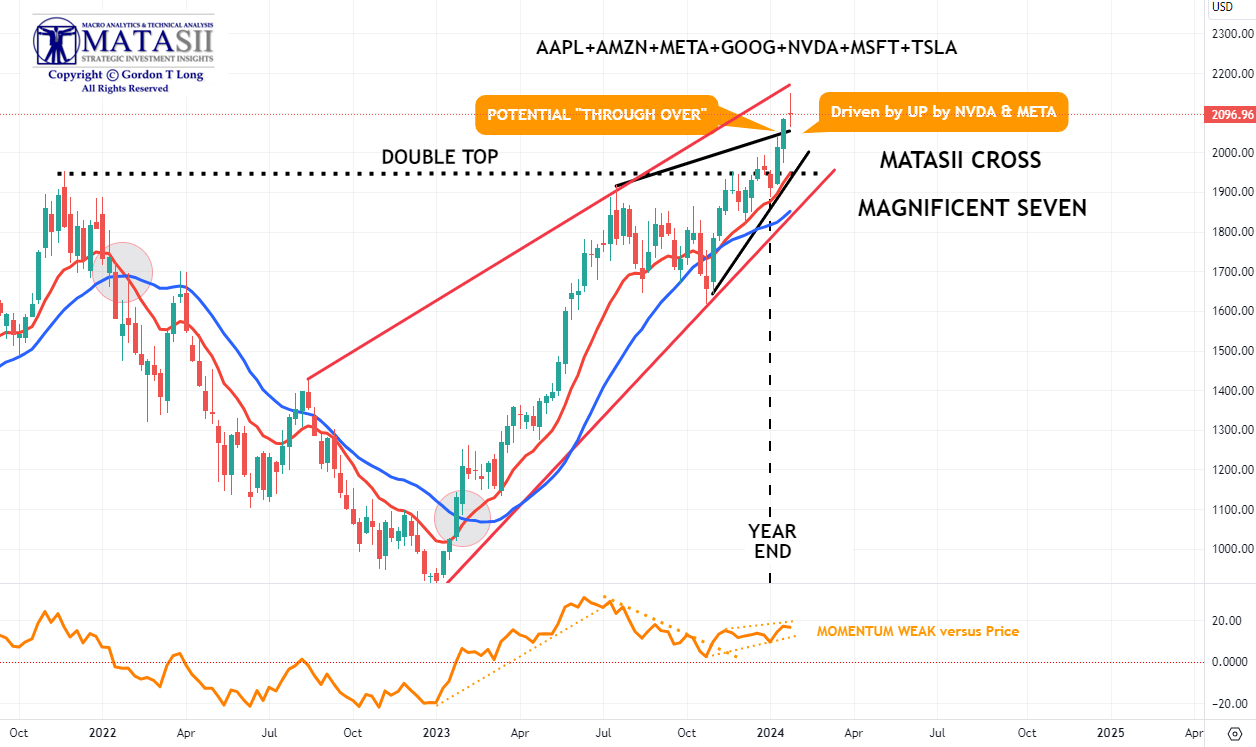
MAGNIFICENT SEVEN – WEEKLY
MATASII CROSS is still on a BUY signal, though an Ending Diagonal has emerged (shown in Black below) with a possible “through-over”. Separately (shown in red) is a larger possible Ending Diagonal.
Together they suggest that the Magnificent Seven likely needs a Corrective Consolidation before going higher.
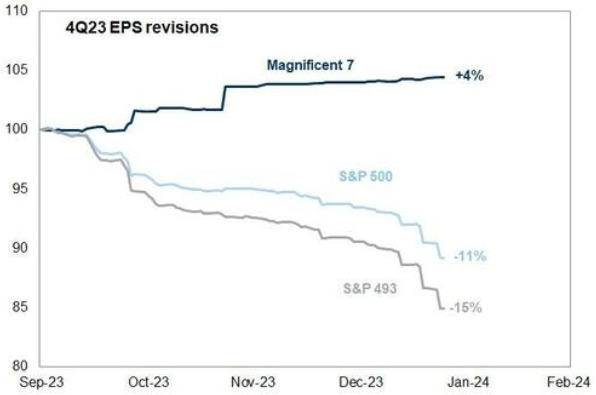
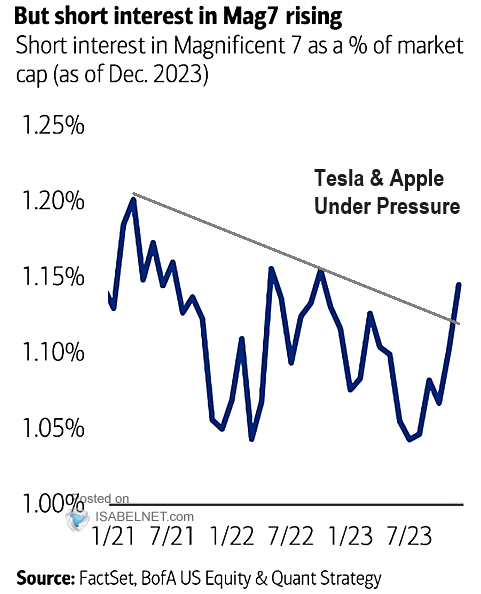
The Magnificent Seven is currently carrying the market, but when you “look under the covers”, it is dominantly driven by NVDA and META while TSLA and AAPL are under pressure.
YOUR DESKTOP / TABLET / PHONE ANNOTATED CHART
Macro Analytics Chart Above: SUBSCRIBER LINK
FAIR USE NOTICE This site contains copyrighted material the use of which has not always been specifically authorized by the copyright owner. We are making such material available in our efforts to advance understanding of environmental, political, human rights, economic, democracy, scientific, and social justice issues, etc. We believe this constitutes a ‘fair use’ of any such copyrighted material as provided for in section 107 of the US Copyright Law. In accordance with Title 17 U.S.C. Section 107, the material on this site is distributed without profit to those who have expressed a prior interest in receiving the included information for research and educational purposes. If you wish to use copyrighted material from this site for purposes of your own that go beyond ‘fair use’, you must obtain permission from the copyright owner.
NOTICE Information on these pages contains forward-looking statements that involve risks and uncertainties. Markets and instruments profiled on this page are for informational purposes only and should not in any way come across as a recommendation to buy or sell in these assets. You should do your own thorough research before making any investment decisions. MATASII.com does not in any way guarantee that this information is free from mistakes, errors, or material misstatements. It also does not guarantee that this information is of a timely nature. Investing in Open Markets involves a great deal of risk, including the loss of all or a portion of your investment, as well as emotional distress. All risks, losses and costs associated with investing, including total loss of principal, are your responsibility.