Gordon T Long
Global Macro Research | Macro-Technical Analysis
TIPPING POINTS
DISINFLATION – DEFLATION PRESSURES
2% INFLATION BY SUMMER 2024??
OBSERVATIONS: AS GOES SMALL BUSINESS, SO GOES AMERICA!
In this month’s LONGWave video (link right), I mentioned the serious concerns I was witnessing within small business in America. Covid-19 placed huge financial strain on this critical segment, only to have credit tighten, finance rates surge and a wage price spiral – labor shortage as they attempted to resume business as before.
Often the closest friend a small business owner has is his local banker. However, he even finds his bank or credit union facing problems with deposit withdrawals headed to higher paying Money Market Funds and restricting lending. The life blood of small business is cash. Cashflow problems is the number one reason small businesses fail.
Larger corporations which have major sway over politicians are not feeling the same pain, because they were able to secure long term loans and guarantees in the pre-covid era when rates were at historic low levels. Small business needs are not being met and this is currently a cancer not being treated that will have major consequences both in the near and long term.
Small business not only employs the vast amount of the US working population, but is where the vitality of the nation lies and where its future lies. Nowhere is that more evident than when you review the 10 richest individuals in America. The founders and controllers of the Magnificent 7 now controlling the valuations of the” US stock market. Look at the list:
-
- Elon Musk – cofounded six companies,
- Jeff Bezos -Founded Amazon
- Larry Ellison -$158 B. Founded Oracle
- Warren Buffett -$121 Founded Berkshire-Hathaway
- Larry Page -$114 Co-Founded Google
- Bill Gates -$111 Co-Founded Microsoft
- Sergey Brin -$110 Co-Founded Google
- Mark Zuckerberg -Founded Facebook
- Steve Ballmer $101 billion -Bill Gates first employee
- Michael Bloomberg -$96.3B. Founded Bloomberg
Not one rose from the stifling environments of corporate bureaucracies currently holding sway over government policy through campaign contributions, lobbyists and crony capitalism.
Unless Bidenomics stops feeding off the Military-Industrial Complex, Big Pharma and Big Tech the exploding US debt ceiling will only get worse as GDP continues to stagnate, tax revenues falls and budget deficits accelerate.
WHAT YOU NEED TO KNOW!
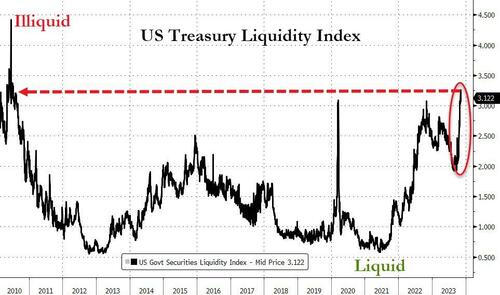 ILLIQUIDITY CREATING HEIGHTENED RISK & VOLATILITY IN THE US TREASURY MARKET
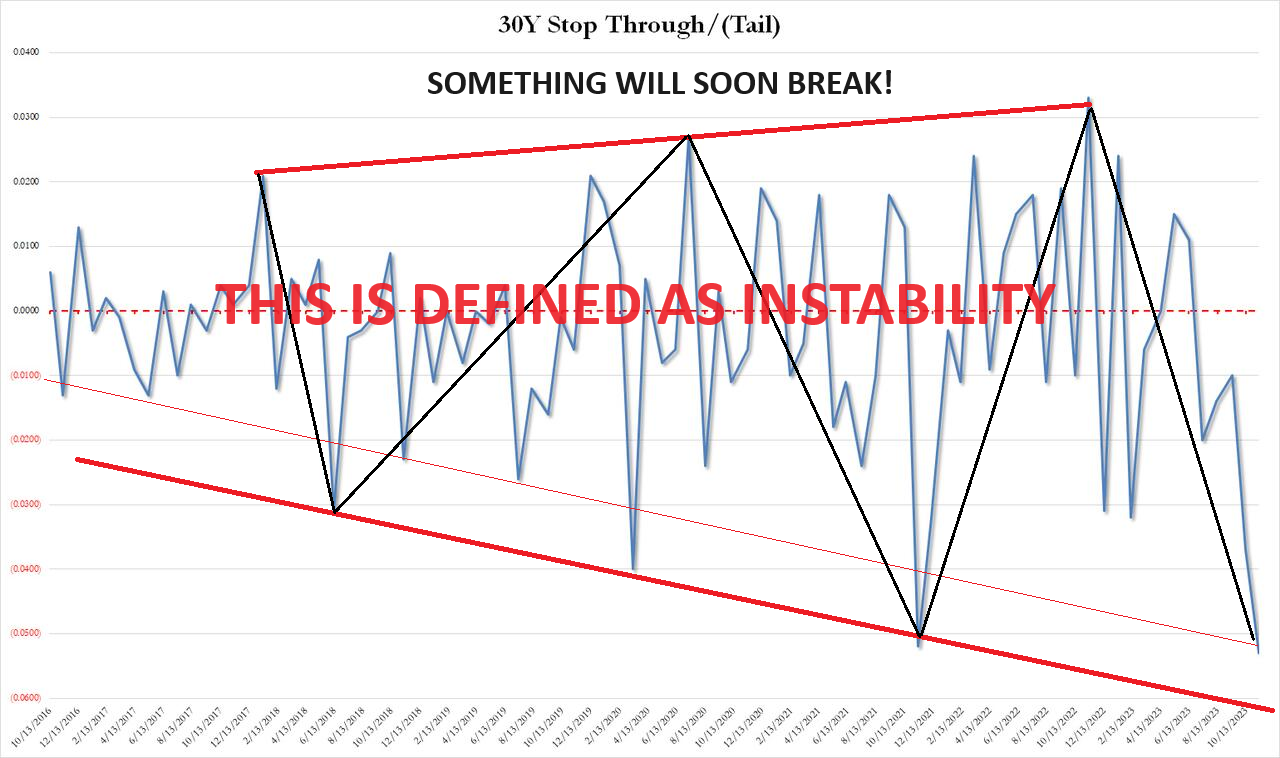
After a mediocre 3Y and a subpar 10Y Treasury Auctions earlier this week, Thursday’s 30Y auction was a real shocker sparking a swift and painful response across markets with bonds and stocks hammered lower and the dollar spiking. This is the new world of US Treasury bond market volatility due to US debt level risks, few players making markets in this sector anymore and shrinking global liquidity. It is now only a matter of time before something breaks due to massive supply and weak demand.
RESEARCH
2% INFLATION BY SPRING?? Recessionary Dis-Inflation & Deflation Visible
-
- The annual rate of core inflation has continued to soften from a peak of 6.6% in September 2022 to 4.1%.
- With real household disposable incomes falling for the past four months amid evidence of increasing numbers of households having exhausted pandemic-era savings, we expect to see GDP contract in at least two quarters in 2024. In this environment, we see the slowdown in inflation regaining momentum in early 2024.
- With business attitudes becoming more cautious on the economic outlook, we are seeing a reduction in price intention surveys.
- Another area of recent encouragement is energy prices. The fear had been that the conflict in the Middle East would have consequences for energy markets, but so far, we have seen energy prices soften significantly.
- We expect to see new and used vehicle prices (combined 6.9% weighting in the CPI basket) being vulnerable to further price falls in an environment where car loan borrowing costs are soaring.
- The big disinflationary influence should come from housing over the next couple of quarters. The one-third weighting that housing has in the headline rate and 41.8% weighting in the core will subtract around 1.3 percentage points of headline inflation and 1.7ppt off core annual inflation rates.
- We are increasingly confident that inflationary pressures will continue to subside and this means that the Federal Reserve will not need to raise interest rates any further.
- We expect headline inflation to slow to 3.3% in the December report with the annual rate of core inflation coming down to 3.7%.
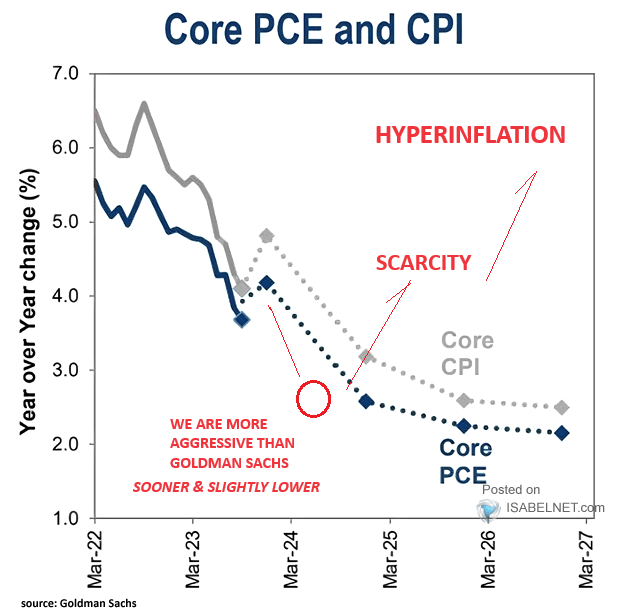
- We forecast headline inflation to be in a 2.25-2.75% range from April onwards with core CPI testing 2% in the second quarter.
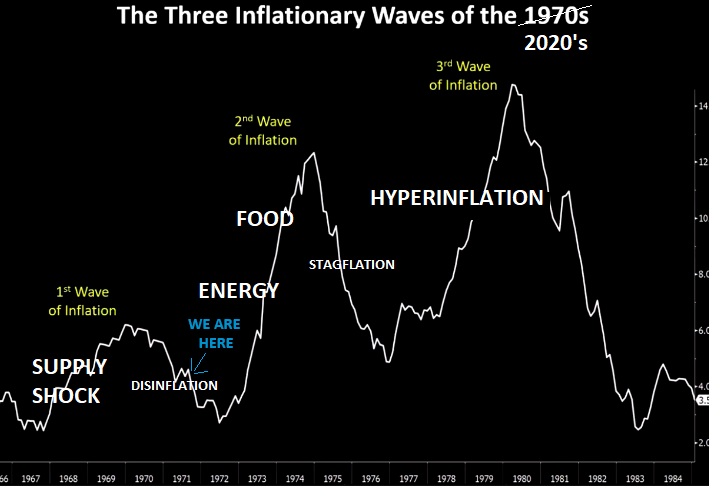
IN Q3 2024 THE SECOND WAVE OF INFLATION WILL THEN BEGINS ITS RAPID ASCENT DUE TO SCARCITIES DRIVEN GLOBAL GEO-POLITICS IMPACTING ENERGY AND FOOD.
Q3 EARNINGS SEASON WRAPS UP
-
- Earnings Scorecard: For Q3 2023 (with 92% of S&P 500 companies reporting actual results), 81% of S&P 500 companies have reported a positive EPS surprise and 61% of S&P 500 companies have reported a positive revenue surprise.
- Earnings Growth: For Q3 2023, the blended (year-over-year) earnings growth rate for the S&P 500 is 4.1%. If 4.1% is the actual growth rate for the quarter, it will mark the first quarter of year-over-year earnings growth reported by the index since Q3 2022.
- Valuation: The forward 12-month P/E ratio for the S&P 500 is 18.0. This P/E ratio is below the 5-year average (18.7) but above the 10-year average (17.5).
GLOBAL ECONOMIC REPORTING: What This Week’s Key Global Economic Reports Tell Us?
-
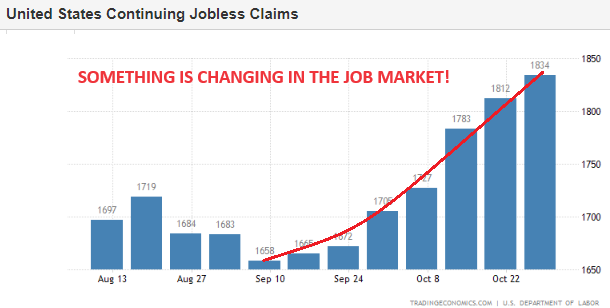
- CONTINUING JOBLESS CLAIMS: US Continuing jobless claims increased for a seventh straight week to 1834K in the week ending October 28 of 2023, the highest level since mid-April, compared to a downwardly revised 1812K in the previous week and forecasts of 1820K.
- US FOREIGN TRADE: US International Trade $ * (Sep) -61.5B vs. Exp. -59.9B (Prev. -58.3B, Rev. -58.7B)
- US Goods Trade Balance (R) * (Sep) -86.84B (Prev. -85.78B)
- 30YR AUCTION: A historically bad new 30Y issue auction from the Treasury, even worse than the poor showing for the October’s offering.
DEVELOPMENTS TO WATCH
As the US economy’s Achilles Heel is being a 70% Consumption Economy, China’s Achilles Heel is depending on Capital Formation being 42.94%. Both countries are under increasing pressure since both levels are unsustainable!
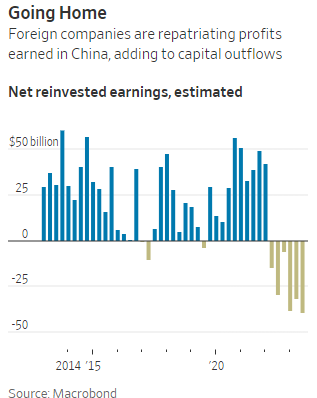
1- CHINA: DE-RISKING STRATEGIES ARE REPATRIATING CHINESE EARNINGS
-
-
- Chilly relations between Beijing and the U.S.-led West have pushed global companies to rethink their supply chains and exposure to China.
-
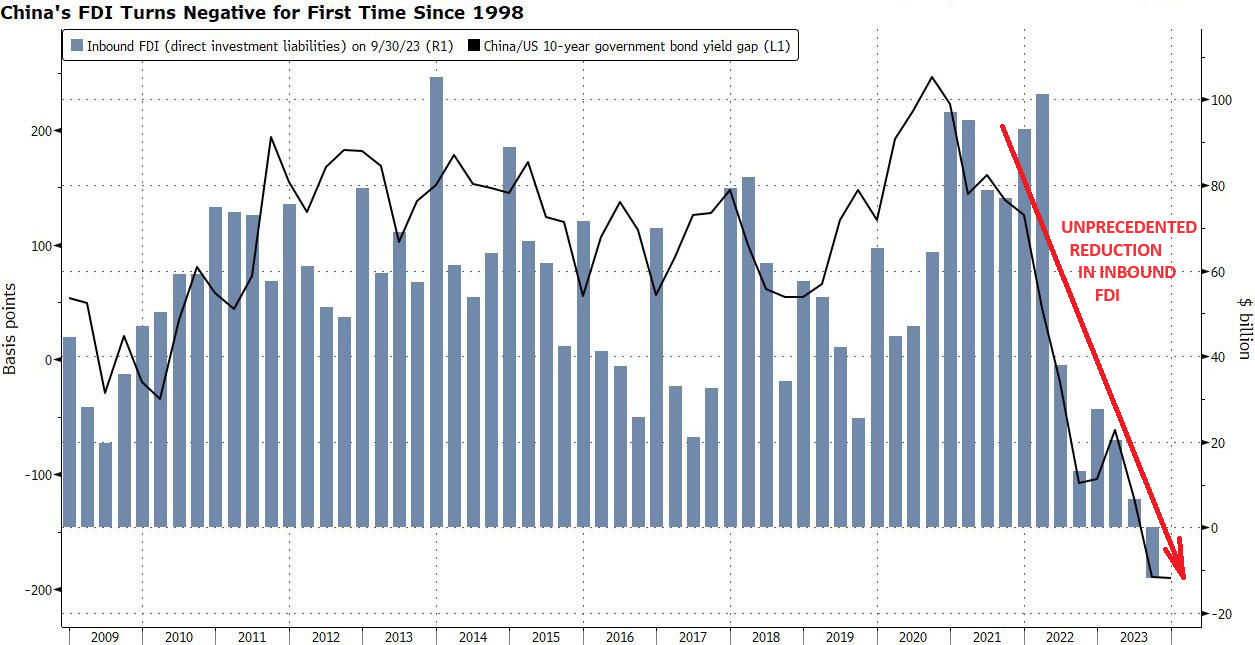
2- CHINA: AN UNPRECEDENTED REDUCTION OF INBOUND FOREIGN DIRECT INVESTMENT
-
-
- Direct investment liabilities – a broad measure of FDI that includes foreign companies’ retained earnings in China – were a deficit of $11.8 billion during the July-September period, according to preliminary balance of payments data.
- Increasing geopolitical tensions are hampering China’s ability to attract FDI and instead favor emerging markets that are more friendly to the West.
-
2% INFLATION BY SPRING??
 I noted to subscribers in Wednesday’s “Gord’s Desktop Charts” that we were seeing ‘whiffs’ of disinflation and deflation appearing. The examples I gave were:
-
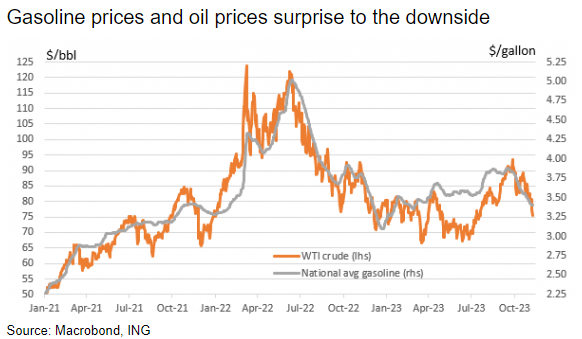
- Falling oil prices (WTIC < $80 to ~$75 from recently over $90) Chart Right,
- The Manheim Used Vehicle Value Index for October: fell -2.3% M/M (prev. Sep. +1.0%, mid-month Oct. -2.2%) This is -4.0% Y/Y (prev. Sep. -3.9%, mid-month Oct. -5.5%).
- Weak China Inflation numbers.
- Chinese CPI YY * (Oct) -0.2% vs. Exp. -0.1% (Prev. 0.0%)
- Chinese CPI MM * (Oct) -0.1% vs Exp. 0.0% (Prev. 0.2%)
- Chinese PPI YY * (Oct) -2.6% vs. Exp. -2.7% (Prev. -2.5%)
.. which was playing a role in falling bond yields and will likely deliver the bond yields I outlined with Weekly, Daily and Hourly “TNX” Yield charts. As the chart above right illustrates, we believe Inflation is a long ways from being solved and highly likely to be with us for the remainder of this decade.
However, between now and the spring, indications are that we will be experiencing the disinflationary/deflationary impact of a recession. Let me give you some of the reasons for this weakening towards 2-3%% inflation levels.
After encouraging inflation data in early summer, progress stalled in August and September amid robust consumer activity. But with tighter financial and credit conditions set to weigh further on corporate pricing power, supplemented by slowing rents and falling gasoline and used car prices, we expect to see inflation move in the range of 2.25% – 2.75% in 2Q.
FED WANTS MORE
 At the recent FOMC press conference, Federal Reserve Chair Jerome Powell said that the economy has “been able to achieve pretty significant progress on inflation without seeing the kind of increase in unemployment that has been very typical of rate hiking cycles like this one”. Nonetheless, there was the acknowledgement that “the process of getting inflation sustainably down to 2% has a long way to go”.
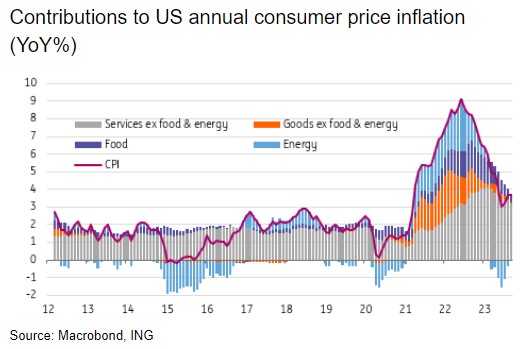
Headline US consumer price inflation has indeed fallen sharply from a peak of 9.1% year-on-year in June 2022, hitting a low of 3% in June 2023. However, this stalled in August and September with the annual rate rebounding to 3.7% as higher energy costs and resilience in some of the core (ex-food and energy) components re-emerged amid a strong summer for consumer spending. The annual rate of core inflation has continued to soften from a peak of 6.6% in September 2022 to 4.1% currently, but it is still running at more than double the 2% target.
In an environment where the economy has just posted 4.9% annualised GDP growth in the third quarter and unemployment is only 3.9%, there are several hawks on the FOMC who continue to make the case for additional interest rate rises, arguing that they cannot take chances and allow any opportunity for inflation pressures to reignite.
THE FED’S WORK IS PROBABLY DONE
The Fed is still officially forecasting one further 25bp interest rate rise this year, but we doubt it will follow through. The Fed last hiked rates in July and since then financial and credit conditions have tightened, with residential mortgages and car loans now having 8%+ interest rates, while credit card borrowing costs are at all-time highs and corporate lending rates are moving higher.
It isn’t just the rise in borrowing costs that will act as a brake on economic activity and constrain inflation pressures. The Federal Reserve’s Senior Loan Officer Opinion survey shows that banks are increasingly reluctant to lend. This combination of sharply higher borrowing costs and reduced credit availability tends to be toxic for growth. The Fed itself has reported significant weakness in loan demand, while commercial bank lending data shows a clear topping out in the amount of borrowing conducted by households and businesses. With real household disposable incomes falling for the past four months amid evidence of increasing numbers of households having exhausted pandemic-era savings, we expect to see GDP contract in at least two quarters in 2024. In this environment, we see the slowdown in inflation regaining momentum in early 2024.
CORPORATE PRICING POWER IS WANING
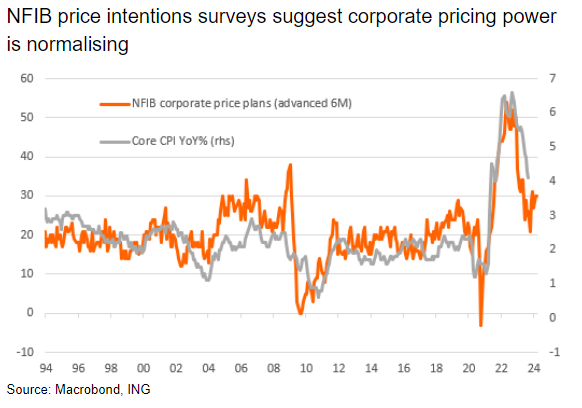 With business attitudes becoming more cautious on the economic outlook we are seeing a reduction in price intention surveys. The chart to the right shows the relationship between the National Federation of Independent Businesses’ (NFIB) survey on the proportion of members expecting to raise prices in coming months and the annual rate of core inflation. It suggests that conditions are normalising, with core inflation set to return to historical trends.
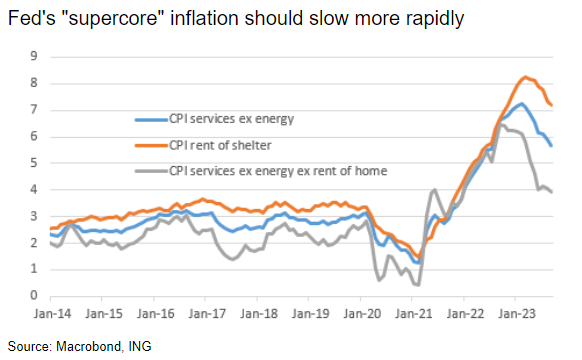
While concerns about the outlook for demand are a key factor limiting the desire for companies to raise prices further, a more benign cost backdrop has also helped the situation. The annual rate of producer price inflation has slowed from 11.7% to 2.2%, having dropped to just 0.3% year-on-year in June while import prices are falling outright in year-on-year terms. There are also signs of labour market slack emerging, with unemployment starting to tick higher and average hourly earnings growth slowing to 4.1% from near 6% just 18 months ago. Perhaps more importantly, non-farm productivity surged in the third quarter with unit labour costs falling at a 0.8% annualised rate. With cost pressures seemingly abating from all angles, this should argue for core services ex-housing, a component that the Fed has been keeping a careful eye on, to soften quite substantially over coming months.
ENERGY AND VEHICLE PRICE FALLS TO DEPRESS INFLATION
 Another area of recent encouragement is energy prices. The fear had been that the conflict in the Middle East would have consequences for energy markets, but so far, we have seen energy prices soften. Gasoline prices in the US have fallen 50 cents/gallon between mid-September and early November, leaving prices at the lowest level since early March. Gasoline has a 3.6% weighting in the CPI basket. Our commodity strategists remain wary, warning of the risk that an escalation in the conflict could lead to oil and gas supply disruptions from some key producers in the region, most notably Iran. For now though, energy prices will depress inflation rates and could mean at least one or two month-on-month outright declines in headline prices with lower energy prices limiting any upside potential from airline fares (0.5% weight in the CPI basket).
 On top of this, we expect to see new and used vehicle prices (combined 6.9% weighting in the CPI basket) being vulnerable to further price falls in an environment where car loan borrowing costs are soaring. New vehicle prices have risen more than 20% since 2020 amid supply problems and strong demand while used vehicle prices rose more than 50%, according to both the CPI measure and Manheim car auction prices. Prices for used cars have fallen this year, but still stand 35% above those of 2020. Experian data suggests the average new car loan payment is now around $730 per month, while for second-hand cars it is now $530 per month.
With car insurance costs having risen rapidly as well, (up 18.9% YoY with a 2.7% weighting in the CPI basket), the cost of buying and owning a vehicle is increasingly prohibitive for many households and we suspect we will see incentives increasingly capping the upside for vehicle prices. It is also important to remember that the surge in insurance costs is a lagged response to the higher cost of vehicles – and therefore insured value – and that too should slow rapidly (but not fall) over coming months.
RENT SLOWDOWN WILL BE THE BIG DISINFLATIONARY FORCE IN EARLY 2024
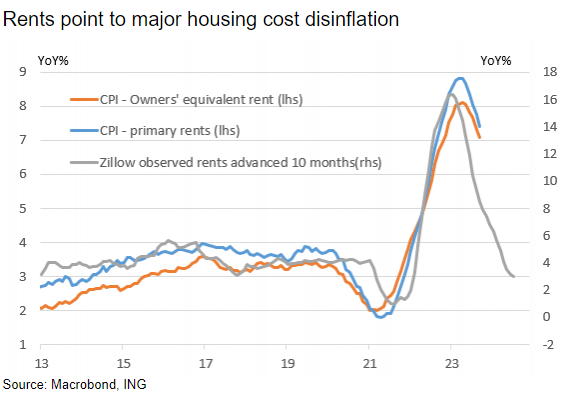 The big disinflationary influence should come from housing over the next couple of quarters. The chart below shows the relationship between Zillow rents and the CPI housing components. This is important , because owners’ equivalent rent is the single biggest individual component of the basket of goods and services used to construct the CPI index, accounting for 25.6% of the headline index and 32.2% of the core index. Meanwhile, primary rents account for 7.6% of the headline index and 9.6% of the core. If the relationship holds and the CPI housing components slow to 3% YoY inflation, the one-third weighting that housing has in the headline rate and 41.8% weighting in the core will subtract around 1.3 percentage points of headline inflation and 1.7ppt off core annual inflation rates.
TRACKING 2% INFLATION NEXT SUMMER
 There are some components on which there is less certainty, such as medical care, but we are increasingly confident that inflationary pressures will continue to subside and this means that the Federal Reserve will not need to raise interest rates any further. Next week’s October CPI report may not show huge progress with headline CPI expected to be flat on the month and core prices rising 0.3% month-on-month, but we expect headline inflation to slow to 3.3% in the December report with the annual rate of core inflation coming down to 3.7%.
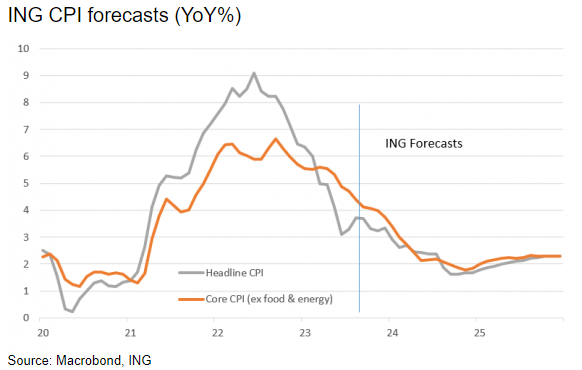
Sharper declines are likely in the first half of 2024. Chair Jerome Powell, in a speech to the Economic Club of New York, acknowledged that “given the fast pace of the tightening, there may still be meaningful tightening in the pipeline”. This will only intensify the disinflationary pressures that are building in an economy that is showing signs of cooling. We forecast headline inflation to be in a 2.25-2.75% range from April onwards with core CPI testing 2% in the second quarter.
With growth concerns likely to increase over the same period, this should give the Fed the flexibility to respond with interest rate cuts. We wouldn’t necessarily describe it as stimulus, but rather to move monetary policy to a more neutral footing, with the Fed funds rate expected to end 2024 at 4% versus the consensus forecast and market pricing of 4.5%.
IN Q3 2024, THE SECOND WAVE OF INFLATION WILL THEN BEGIN ITS RAPID ASCENT, DUE TO SCARCITIES DRIVEN GLOBAL GEO-POLITICS IMPACTING ENERGY & FOOD.
Q3 EARNINGS SEASON WRAPS UP
 KEY METRICS – FACTSET
Earnings Scorecard: For Q3 2023, (with 92% of S&P 500 companies reporting actual results), 81% of S&P 500 companies have reported a positive EPS surprise and 61% of S&P 500 companies have reported a positive revenue surprise.
Earnings Growth: For Q3 2023, the blended (year-over-year) earnings growth rate for the S&P 500 is 4.1%. If 4.1% is the actual growth rate for the quarter, it will mark the first quarter of year-over-year earnings growth reported by the index since Q3 2022.
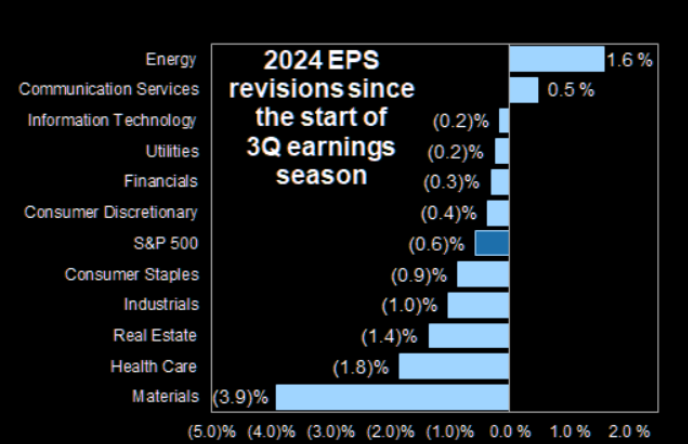
Earnings Revisions: On September 30, the estimated (year-over-year) earnings decline for the S&P 500 for Q3 2023 was -0.3%. Nine sectors are reporting higher earnings today compared to September 30, due to positive EPS surprises and upward revisions to EPS estimates.
Earnings Guidance: For Q4 2023, 59 S&P 500 companies have issued negative EPS guidance and 30 S&P 500 companies have issued positive EPS guidance.
Valuation: The forward 12-month P/E ratio for the S&P 500 is 18.0. This P/E ratio is below the 5-year average (18.7), but above the 10-year average (17.5).
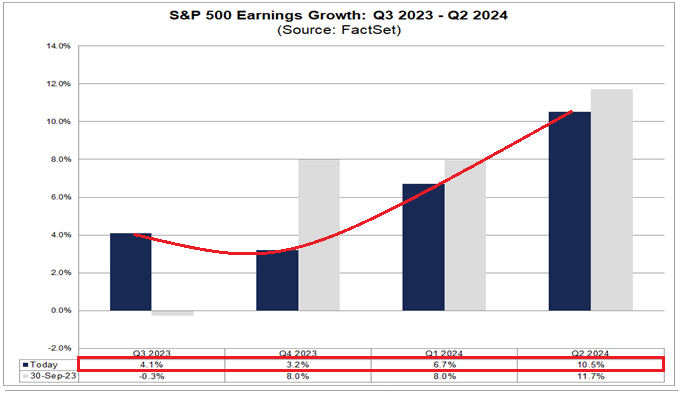 For the third quarter, the S&P 500 is reporting (year-over-year) earnings growth of 4.1%. However, for the fourth quarter, analysts are now projecting (year-over-year) earnings growth of only 3.2%. Do analysts believe (year-over-year) earnings growth rates will continue to decline sequentially into the first half of 2024?
The answer is no. For Q1 2024, analysts are predicting (year-over-year) earnings growth of 6.7%. For Q2 2024, analysts are projecting earnings growth of 10.5%. While these growth rates are below the expectations on September 30, they are still above the current growth rates for Q3 2023 and Q4 2023. What sectors and companies are driving the expected increase in earnings growth for the first half of 2024?
At the sector level for Q1 2024, nine of the eleven sectors are predicted to report year-over-year earnings growth, led by the Communication Services (19.9%), Consumer Discretionary (16.5%) and Information Technology (15.2%) sectors. At the company level for Q1 2024, NVIDIA ($3.91 vs. $1.09), Amazon.com ($0.66 vs. $0.31), Meta Platforms ($3.60 vs. $2.20) and Alphabet ($1.49 vs. $1.17) are expected to be the largest contributors to earnings growth for the S&P 500 for the quarter. If these four companies were excluded, the estimated earnings growth rate for the S&P 500 for Q1 2024 would fall to 3.2% from 6.7%.
At the sector level for Q2 2024, all eleven sectors are predicted to report year-over-year earnings growth, led by the Health Care (23.5%), Energy (21.3%), Communication Services (16.6%) and Information Technology (11.1%) sectors. At the company level for Q2 2024, Merck ($2.06 vs. $-2.06), NVIDIA ($4.17 vs. $2.70) and Meta Platforms ($4.18 vs. $2.98) are expected to be the largest contributors to earnings growth for the S&P 500 for the quarter. If these three companies were excluded, the estimated earnings growth rate for the S&P 500 for Q2 2024 would fall to 7.0% from 10.5%.
GLOBAL ECONOMIC INDICATORS: What This Week’s Key Global Economic Releases Tell Us
 CONTINUING JOBLESS CLAIMS
Continuing jobless claims in the United States increased for a seventh straight week to 1834K in the week ending October 28 of 2023, the highest level since mid-April, compared to a downwardly revised 1812K in the previous week and forecasts of 1820K.
Continuing claims refer to the number of people receiving benefits after an initial week of aid, and are seen as a proxy for hiring.
 US FOREIGN TRADE
-
- US International Trade $ * (Sep) -61.5B vs. Exp. -59.9B (Prev. -58.3B, Rev. -58.7B)
- US Goods Trade Balance (R) * (Sep) -86.84B (Prev. -85.78B)
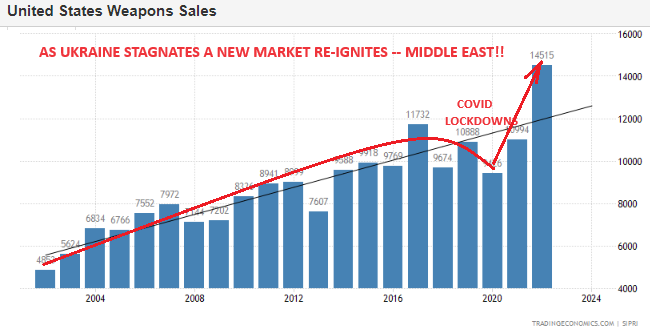
If it wasn’t for the Military Industrial Complex and US Military Foreign Policy, the US Trade deficit would be worse than a disaster – we would be a banana Republic!
 30YR AUCTION
A historically bad new issue 30yr auction from the Treasury, even worse than the poor showing for October’s offering.
-
- The auction stopped at 4.769%, marking a massive 5.3bp tail of the WI, exceeding the prior month’s 3.7bp tail, and incomparable to the six-auction average 0.9bp tail.
- The bid/cover ratio at 2.24x was beneath the prior 2.35x and average 2.44x.
- Dealers (forced surplus buyers) were left with a massive 24.7%, well above both the prior 18.2% and avg. 12.7%, with a decline in both Directs and Indirects participation.
- For all intents and purposes, the auction has amplified concerns over the marginal buyer of long-dated US Treasuries, offsetting the respectable showing for the 10yr on Wednesday.
- It’s worth highlighting reports emerging after the auction via the FT, that China’s largest bank, ICBC, was attacked by ransomware in its US unit, disrupting the US Treasury market by stopping it from settling trades, which may have potentially impacted the auction. Although it’s worth noting that the bank is not a registered Primary Dealer.
GLOBAL MACRO
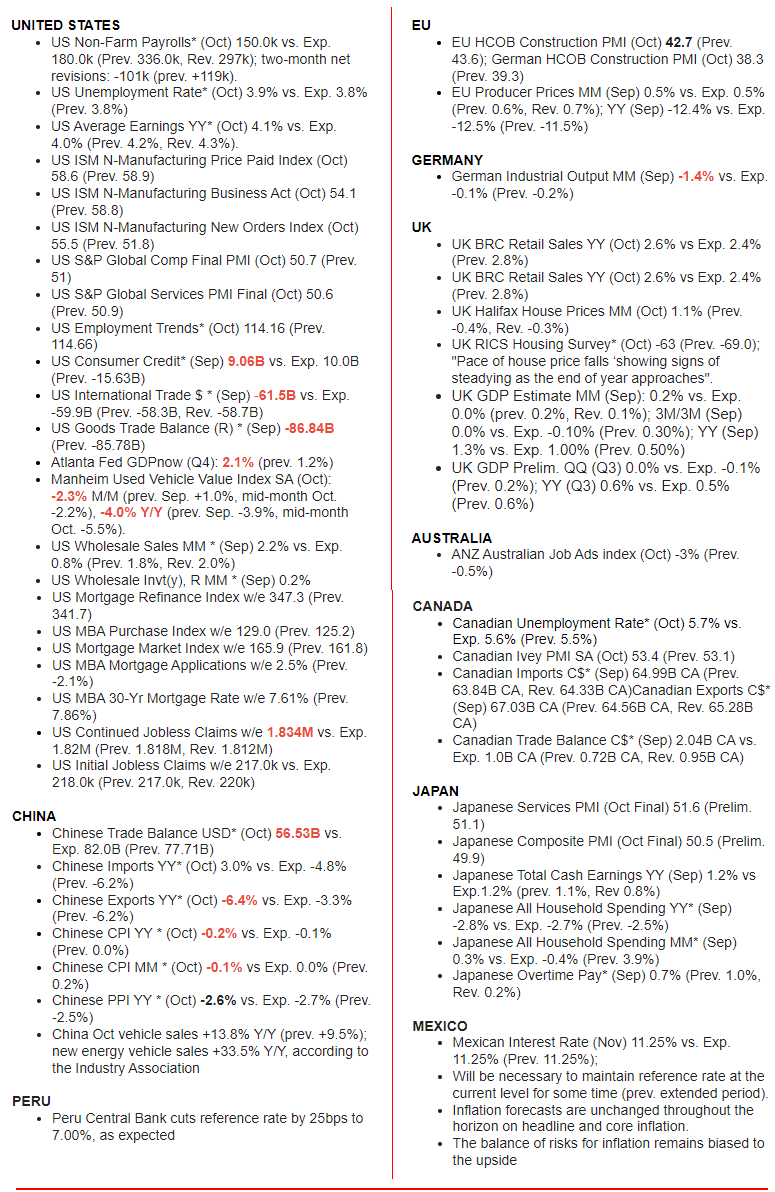
WHAT DOES YOUR SCAN OF THE DATA BELOW TELL YOU? – THE MEDIA AVOIDS BAD NEWS!
We present the data in a way you can quickly see what is happening.
THIS WEEK WE SAW
Exp=Expectations, Rev=Revision, Prev=Previous
DEVELOPMENTS TO WATCH
 From 1960 to 2021, China’s average capital investment as a percentage of GDP was 36.34%. The minimum was 15.74% in 1962 and the maximum was 46.66% in 2011. The latest value from 2021 was 42.84%.
However this level of contribution to Chinese GDP is under serious threat for two reasons: i) Global De-Risking Strategies and ii) Slowing Chinese Growth.
1- CHINA: DE-RISKING STRATEGIES REPATRIATING CHINESE EARNINGS
-
- A range of factors have contributed to the profit exodus, economists and corporate executives say. Those include a widening gap between China’s interest rates and those in the U.S. and Europe that has made it more attractive to park earnings in the West. While the Fed and other central banks have been raising rates to fight inflation, China has been cutting them as policy makers battle a prolonged downturn in its real-estate market.
- Many foreign firms are looking for better uses for their money, as China’s economy slows and geopolitical tensions rise.
- Chilly relations between Beijing and the U.S.-led West have pushed global companies to rethink their supply chains and exposure to China.
- “Corporates are beginning to de-risk from China,” said Peter Kinsella, global head of foreign-exchange strategy at Union Bancaire Privé.
 2- CHINA: UNPRECEDENTED REDUCTION OF INBOUND FDI
-
- Direct investment liabilities – a broad measure of FDI that includes foreign companies’ retained earnings in China – were a deficit of $11.8 billion during the July-September period, according to preliminary balance of payments data.
- Increasing geopolitical tensions are hampering China’s ability to attract FDI and instead favor emerging markets that are more friendly to the West.
- Aside from geopolitical risks, companies have also been pulling back on investment in China last year as the country rolled out pandemic restrictions. While those curbs have been removed, firms are still contending with other challenges from rising manufacturing costs in China and regulatory hurdles, as Beijing scrutinizes activity at foreign corporations due to national security concerns.
“Some of the most damaging things have been the abrupt regulatory changes that have taken place,” according to reportng pointing to this year’s anti-espionage campaign, which resulted in some firms having their offices raided by local authorities.
“Once you damage the sort of perception of the business environment, it’s quite difficult to restore trust. I think it will take some time.”
While foreign companies make up less than 3% of the total number of corporations in China, they contribute to 40% of its trade, more than 16% of tax revenue and almost 10% of urban employment, state media has reported. They’ve also been key to China’s technological development, with foreign investment in the country’s high-tech industry growing at double-digit rates on average since 2012, according to the official Xinhua News Agency.
“A decline in trade and investment links with advanced economies will be a particularly significant headwind for a catching up economy such as China, weighing on productivity growth and technological progress.”
Since youth unemployment – the single, most direct precursor to the one thing Beijing fears most of all, social unrest – is already at an all time high and will continue to rise (even if China will no longer report on what it is), the likelihood that Beijing will pursue some bazooka stimulus, both fiscal and monetary, only grows with every month that Beijing does not pursue such a critical, if temporary, measure to prevent catastrophe.
READ: More Executives Vanish in China, Casting Chill Over Business Climate WSJ 11/09/23
DEVELOPMENTS TO WATCH
 THE POST COVID GAP
This week we witnessed Continuing Jobless Claims climbing while the October Employment numbers collapsed. We have been fully expecting this as we move closer to the coming recession.
We should now be paying attention to the gap between retail sales and jobs (chart right). The current gap is likely unsustainable, because the income needed to consume came from massive government Stimulus checks, Covid Forebearance savings (deferred payments) and employment has come to an end. Unsurprisingly, that gap will be rectified with the coming recessionary downturn in the economy.
 MORE RECESSIONARY CONFIRMATIONS
When we look at the unemployment rate versus real GDP, it is historically normal to see signs of a strong jobs market via low unemployment numbers. This is the cyclical high that normally warns of a coming recessionary onset (Chart Right).
Current real-time economic data suggests the economy is rapidly moving from economic slowdown toward recession. The signals are becoming more evident from inverted yield curves to the 6-month rate of change of the Leading Economic Index.(Chart Below)

LAGGING LIQUIDITY SQUEEZE & CREDIT TIGHTENING FINALLY TO TAKE HOLD
THE MARKET TO BEGIN PRICING IN A RECESSION BY TAKING PE’s DOWN
Click All Charts to Enlarge
1 – SITUATIONAL ANALYSIS
 KEEPING IT SIMPLE: (Chart Right)
-
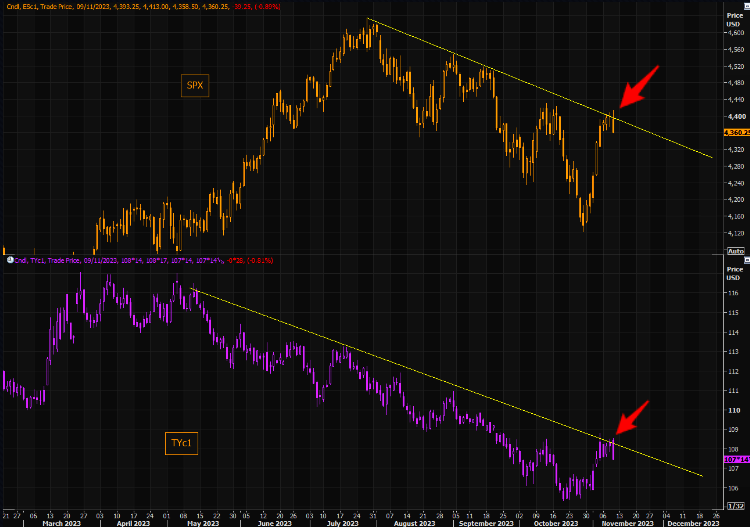
- RATES Rise – STOCKS Fall
- RATES Fall – STOCKS Rise
- Markets (Equity & Bond) work together. Trend lines match as do overhead resistance and reversal points.
Do we break trend to the upside from here or fall??
AS WE DRILL DOWN, THE ANSWER BECOMES A LITTLE CLEARER
EARNINGS: Good
MARGINS: Losing Pricing Power
SALES: Demand #1 Earnings Call Issue
VALUATIONS: Historically High
RISK: Fragile Geo-Politics
Bond Market Volatility
Shrinking Credit & Tightened Lending Standards,
Central Bank Liquidity Withdrawal (QT & Reduced Balance Sheets)
THE ISSUE: CURRENT PE RATIOS DON’T ADEQUATELY REFLECT REAL MARKET RISKS
2 – FUNDAMENTALS
CHANGING VALUATION RISK
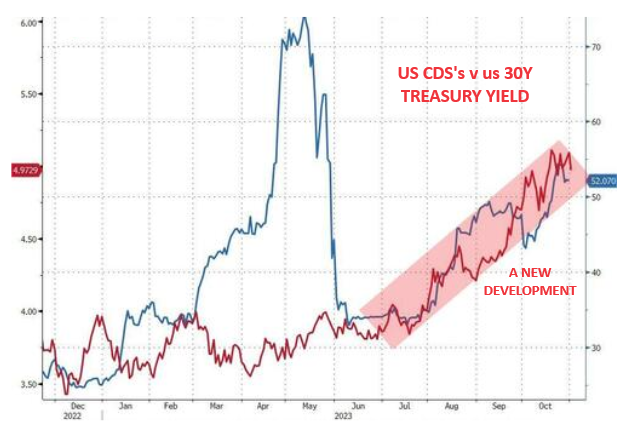
RISK: Since the June increase in the US Debt Ceiling Long Term US Treasuries has begun tracking the Credit Default Swap Rate of the US.
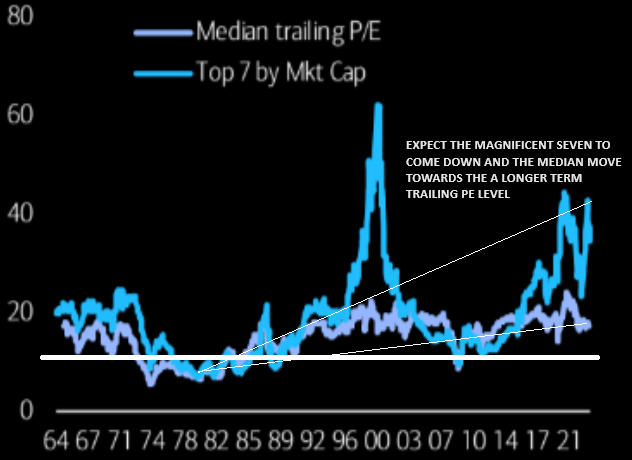
PE VALUATIONS: The above chart shows the S&P 500 median trailing P/E vs. top 7 P/E (1986 to 10 /23). We should expect the “Magnificent Seven” PE to come down, lowering the median to a level more representative of longer term PE ratios. Ratios more reflective of periods of similar bond yields.
 PE VALUATIONS
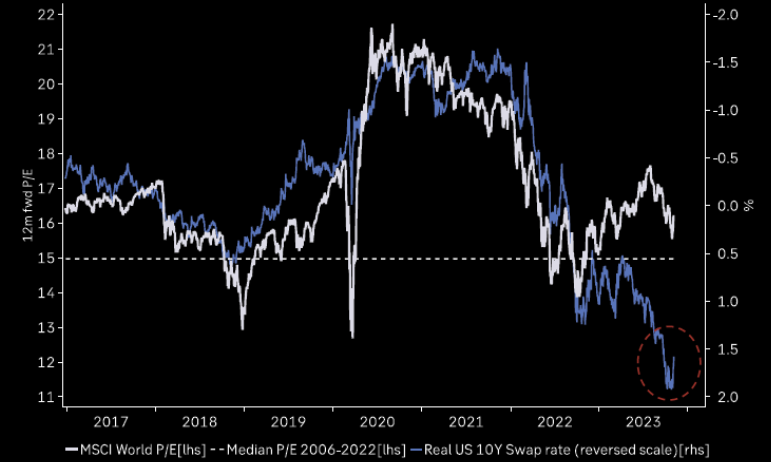
CHART RIGHT:
PE ratios have been capped by high real rates (inverted in blue).
The MSCI World P/E (in white) is likely to move towards the dotted level of a ~15 PE level and closer to the US real 10Y swap rate.
CHART BELOW
Though we make get a “throw over” as a result of:
-
- Q4 Seasonal Up trend
- Santa Claus Rally
- Buybacks now resuming after earnings window is over
- Significant CTA buying potential in the pipeline
- Increasing OMC Momentum.
… likelihood is a move lower as the lagged liquidity and credit tightening takes hold and the cyclical overdue recession becomes more evident.
3 – TECHNICAL ANALYSIS
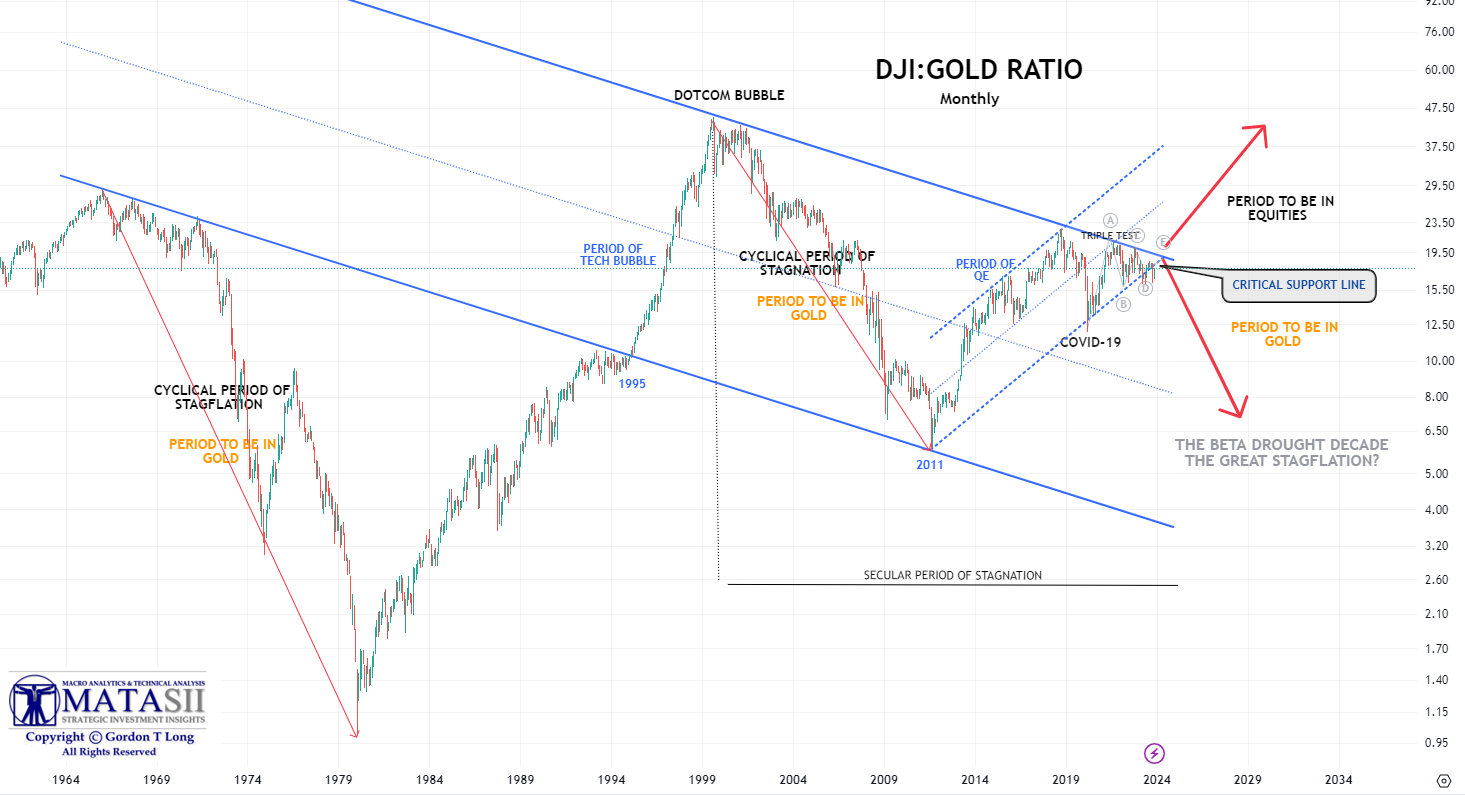
DJI/GOLD RATIO – LONG TERM MONTHLY CHART
We have been using this chart for many years and on a number of occasions it has assisted in crystalizing our thinking.
This monthly chart shows we are at a very important long term inflection point. We believe it will be resolved to the downside, with the unfolding of the Beta Drought Decade and the Great Stagflation. Gold should perform well over the remainder of this decade, as Bonds, Bullion & Breadth eclipse Equity and Value outshines Growth.
YOUR DESK TOP / TABLET / PHONE ANNOTATED CHART
Macro Analytics Chart Above: SUBSCRIBER LINK
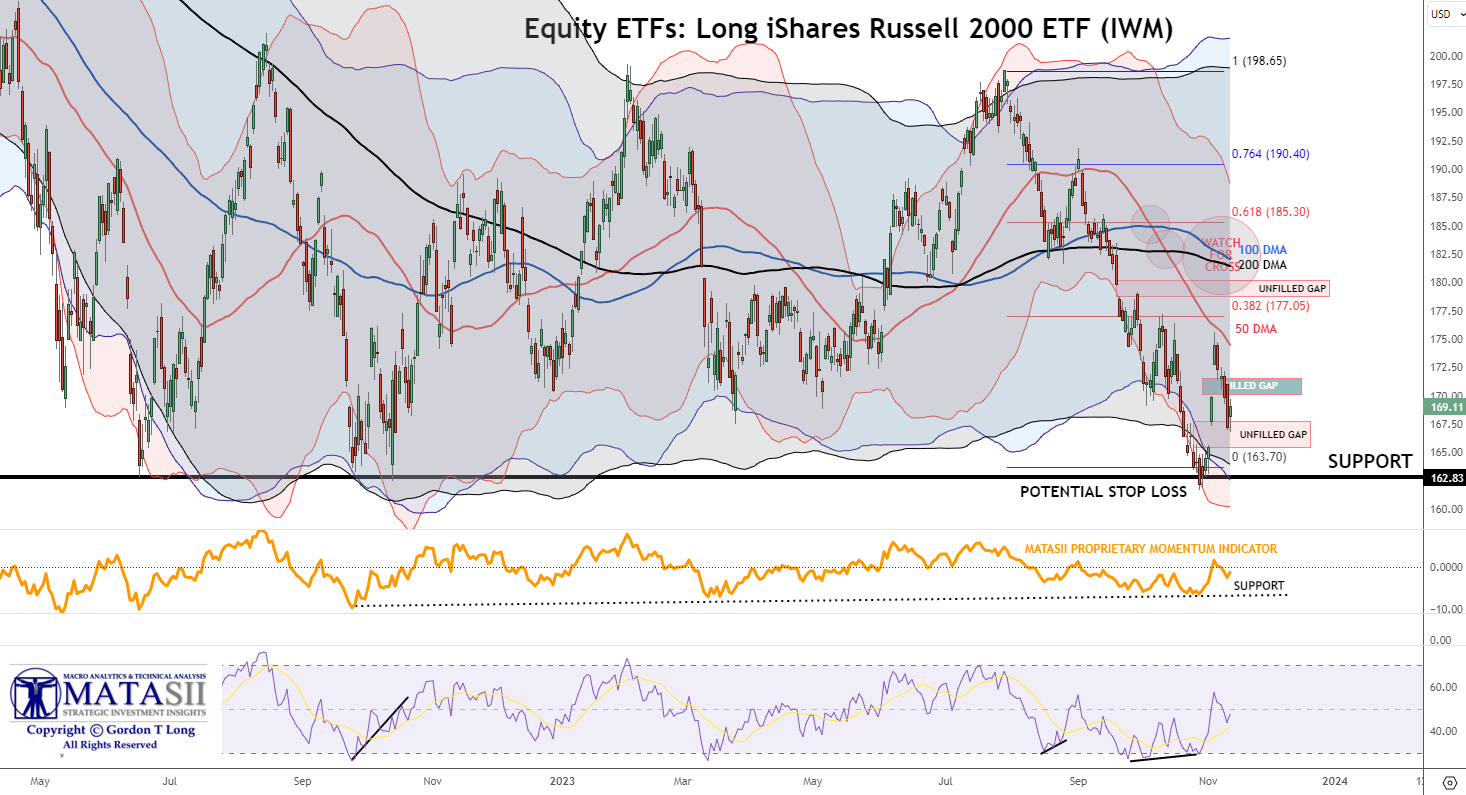
RUSSELL 2000
Equity ETFs: Long iShares Russell 2000 ETF (IWM)
NOTE: The Russell 2000 is the “King of Mean Reversion”. Trading mean reversion is often very painful, especially at turning points, as you end up buying the most brutal selling and end up shorting the most intense buying. The Russell continues to be the king of range trading….bouncing violently once again.
The Russell 2000 (ETF) has very clear upper resistance and lower support levels. A break of either should give a high probability short trend direction over the next 30 days.
YOUR DESK TOP / TABLET / PHONE ANNOTATED CHART
Macro Analytics Chart Above: SUBSCRIBER LINK
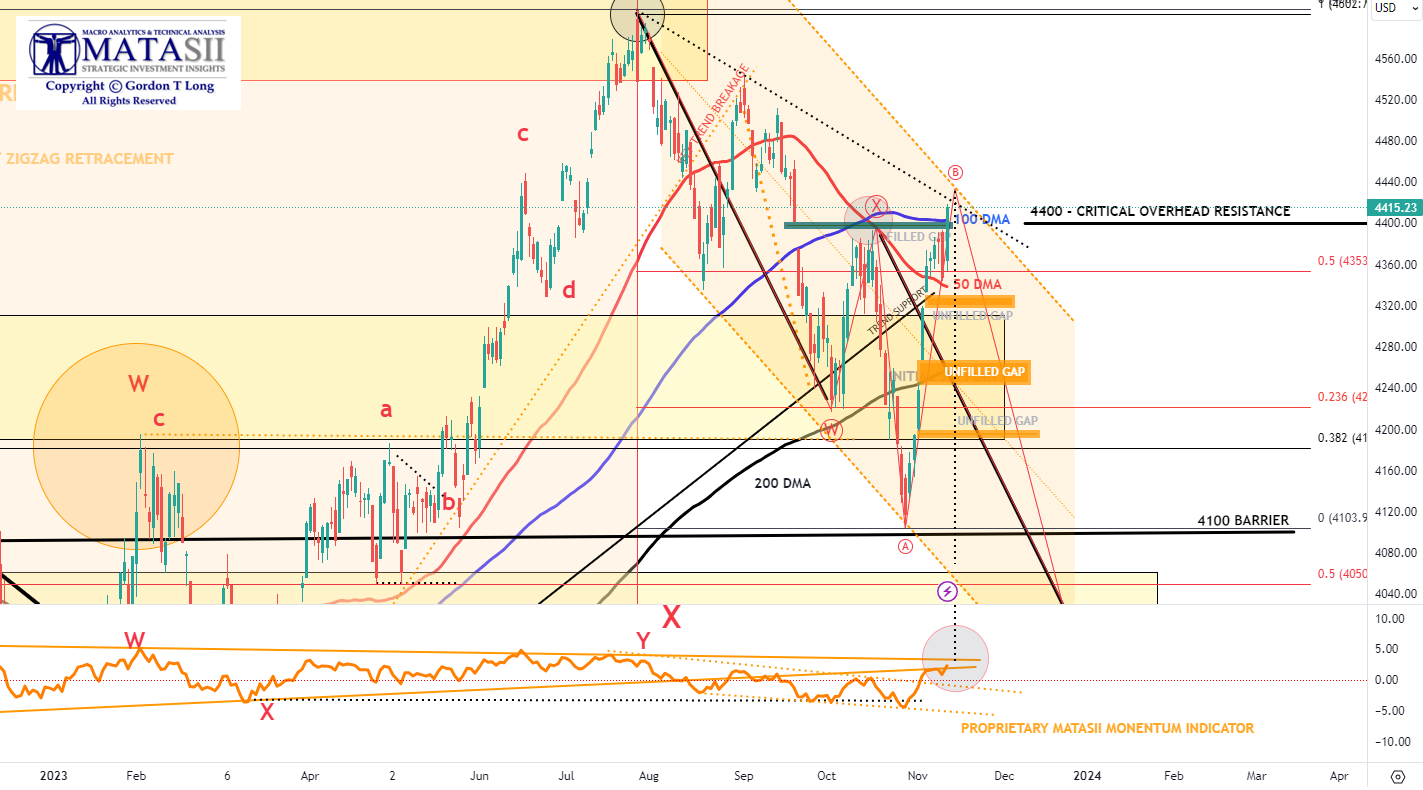
S&P 500 – DAILY
We achieved our anticipated test of the 100 DMA and the 4400 overhead resistance level. In fact we have broached it. The CPI report release on Tuesday is likely to be the driver in determining how this upper barrier is resolved.
We anticipate a 4444 high on the S&P 500 IF the 10Y UST Yield drops < 4.4%
(Watch your Hourly / Daily / Weekly TNX Charts)
YOUR DESK TOP / TABLET / PHONE ANNOTATED CHART
Macro Analytics Chart Above: SUBSCRIBER LINK
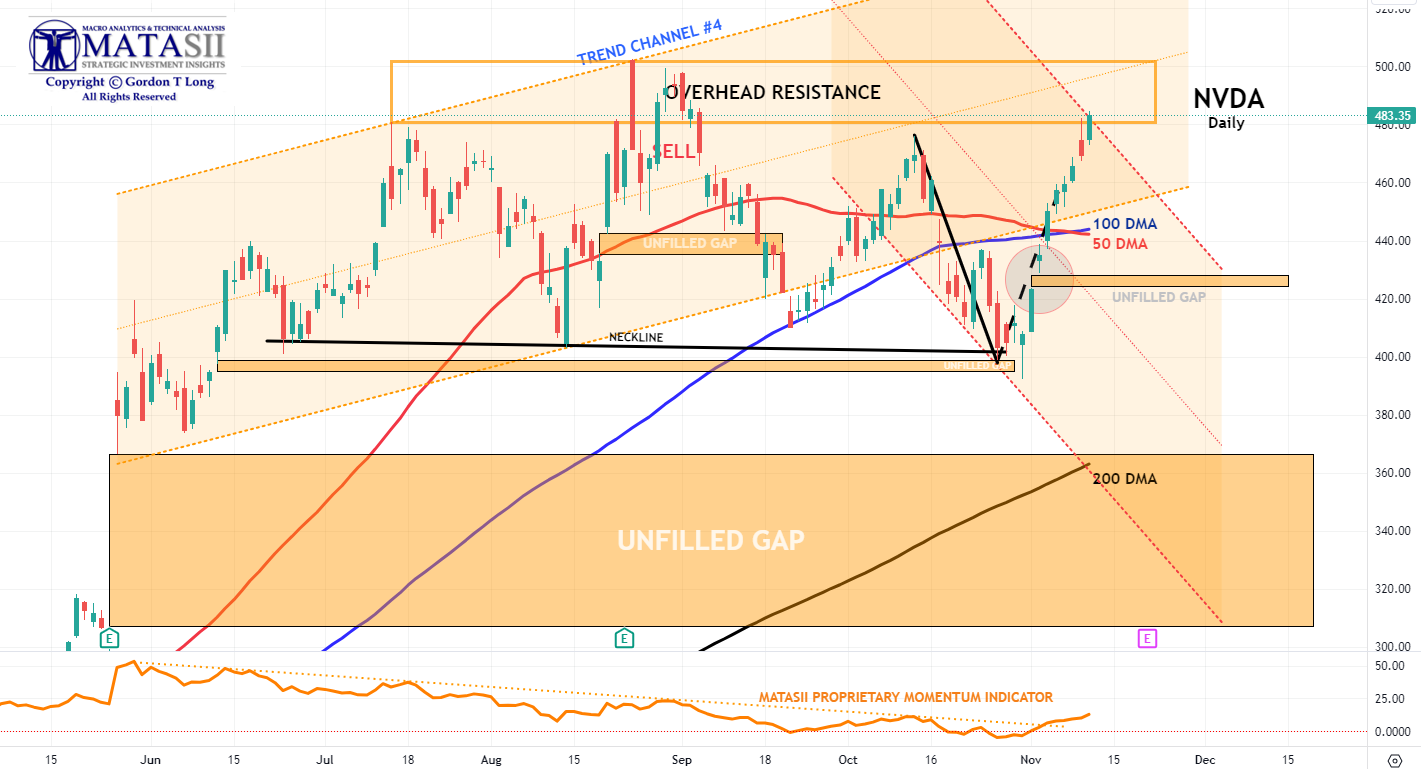
NVDA – Daily
|
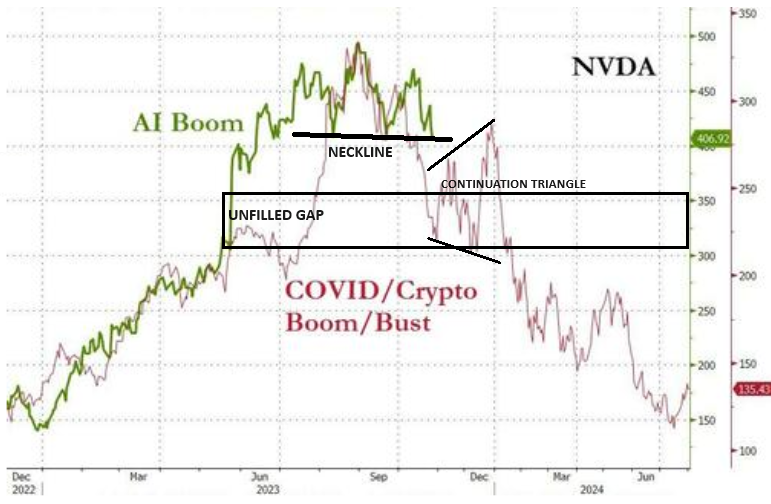
The 50 DMA marginally crossed the 100 DMA on Friday. This typically brings in weakness for a stock. With NVDA approaching upper overhead resistance this would suggest short term weakness.possibly pulling NVDA price down to fill the unfilled open gap. The rising 200 DMA (at the bottom of the chart) is likely to be tested before Christmas. NOTE: Don’t forget the Head & Shoulders analogy model outlined below (the lift to the upper trend channel shown above is not marked on the analog we forwarded in prior newsletters). |
YOUR DESK TOP / TABLET / PHONE ANNOTATED CHART
Macro Analytics Chart Above: SUBSCRIBER LINK
FAIR USE NOTICE This site contains copyrighted material the use of which has not always been specifically authorized by the copyright owner. We are making such material available in our efforts to advance understanding of environmental, political, human rights, economic, democracy, scientific, and social justice issues, etc. We believe this constitutes a ‘fair use’ of any such copyrighted material as provided for in section 107 of the US Copyright Law. In accordance with Title 17 U.S.C. Section 107, the material on this site is distributed without profit to those who have expressed a prior interest in receiving the included information for research and educational purposes. If you wish to use copyrighted material from this site for purposes of your own that go beyond ‘fair use’, you must obtain permission from the copyright owner.
NOTICE Information on these pages contains forward-looking statements that involve risks and uncertainties. Markets and instruments profiled on this page are for informational purposes only and should not in any way come across as a recommendation to buy or sell in these assets. You should do your own thorough research before making any investment decisions. MATASII.com does not in any way guarantee that this information is free from mistakes, errors, or material misstatements. It also does not guarantee that this information is of a timely nature. Investing in Open Markets involves a great deal of risk, including the loss of all or a portion of your investment, as well as emotional distress. All risks, losses and costs associated with investing, including total loss of principal, are your responsibility.