Gordon T Long
Global Macro Research | Macro-Technical Analysis
TIPPING POINTS
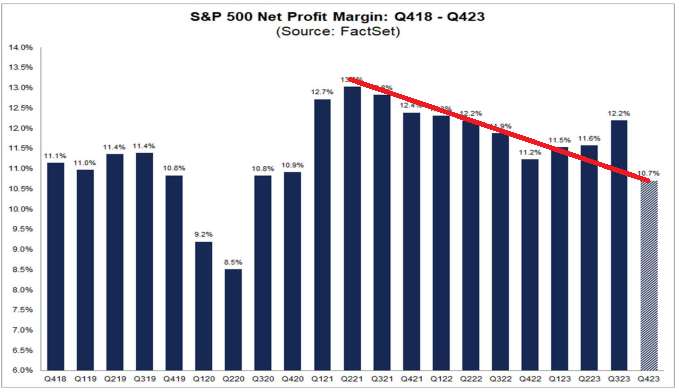
EARNINGS
WHY THE DEBT CEILING SUSPENSION UNTIL AFTER THE PRESIDENTIAL ELECTION CYCLE?
OBSERVATIONS: THE SUSPENSION OF DEBT CEILING WAS WELL PLANNED!
Last June, Biden signed into law the suspension of the debt ceiling until 1 January 2025. Since then, the Federal Government’s debt has accelerated to $34 trillion, the overriding feature being debt interest, perhaps making up nearly half of the budget deficit in this fiscal year. The level of interest rates, and therefore the cost of government funding, has become a major issue for the Fed, which while notionally independent from the US Treasury in practice is not.
It is one of a series of issues which have been troubling markets in recent months. Following the last FOMC meeting, markets have taken the view that the Fed is pivoting from control of inflation to addressing a recessionary economy and the cost of government debt. Accordingly, as well as an ambition to reduce interest rates, the next policy move is likely to be the abandoning of quantitative tightening in favor of QE.
With the refunding of maturing debt, it will require over $10 trillion to be found. That’s bad enough. But being an election year, the haggling over spending, (reductions are never in the frame), will almost certainly take the debt total to at least $37—$38 trillion at the end of the current fiscal year (to end-September) and possibly even within spitting distance of $40 trillion by the year-end.
The inducement to spend, spend, spend while there is no debt ceiling and before negotiations for a new one take place following the installation of the next President, the greater will be the likelihood of outstanding debt hitting $40 trillion before a new ceiling is negotiated. A recession, which is already the true condition, will reduce expected revenue and increase prospective liabilities, potentially driving the annual budget deficit even higher than $3 trillion. In which case debt hitting $40 trillion in twelve months’ time becomes even more likely.
The optics will not be good. Soaring government debt and subdued or contracting GDP will drive the ratio considerably higher. The pressure on the Fed to keep interest rates as low as possible is bound to increase. But the Fed is unlikely to have much control over interest rates anyway because they will be determined by the fate of the dollar’s purchasing power. The dollar’s exchange rate with other currencies will depend on the degree of foreign investment in the Federal Government’s new debt. But other than captive buyers in offshore centers, reserve demand from foreign central banks is already declining. In fact, the two largest holders, China and Japan have already turned net sellers.
In recent months we have seen evidence of difficulties in longer maturity debt auctions and a growing reliance on short-term funding through the T-Bill market. Largely, this is due to banks adjusting their risk exposure away from corporate lending and longer bond maturities, a process which is time limited. Government funding has also absorbed most of the money market funds’ liquidity, which previously had been parked in the Fed’s reverse repo facility. The ease with which the US Treasury has funded the accelerating budget deficit will shortly come to an end, and a funding crisis is bound to ensue.
Under cover of a gathering recession, the Fed will face mounting pressure to monetize the debt problem as much as possible. For a fiat currency over-owned by foreign interests the inflationary implications are potentially catastrophic for the dollar. The dollar’s suitability as the international medium of exchange is already facing a challenge from gold, to which the Asian hegemons and their growing band of supporters in BRICS and the SCO are turning.
Consequently, with a failing dollar, 2024 is set to see a significant decline in the US’s global influence. By wielding her power through the dollar, she has created foreign resentment and enemies. This could be the year when America discovers that her grip on the world is ending, and that she should have learned from Britain’s experience and response to the reality of her decline in the 1960s.
WHAT YOU NEED TO KNOW!
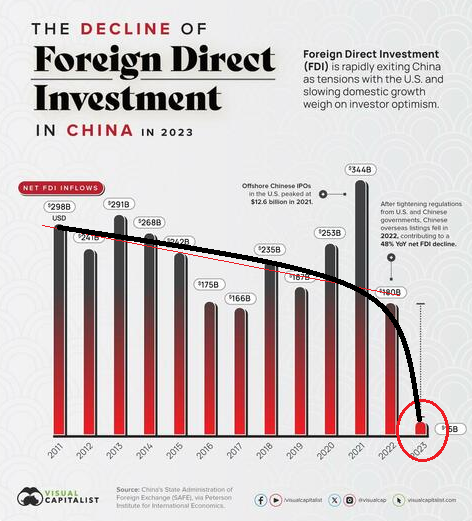 CHINESE FOREIGN DIRECT INVESTMENT CRASHES!
As much as the US economy is almost completely dependent on consumer consumption (~70% of US GDP is Consumption), China with much lower consumption is highly dependent on Capital Formation (~43% of GDP). This has become a very serious problem for China as Foreign Direct Investment (FDI) support has quite literally “fallen off a cliff”!
RESEARCH
Q4 2023 EARNINGS SEASON – Banks Lead the Way
-
- For Q4 2023, the blended (year-over-year) earnings decline for the S&P 500 is -1.7%.
- The index is now reporting a year-over-year decline in earnings for the fourth time in the past five quarters.
- The blended revenue growth rate for the fourth quarter is 2.9% today, compared to a revenue growth rate of 2.9% last week and a revenue growth rate of 3.1% at the end of the fourth quarter (December 31).
- If 2.9% is the actual revenue growth rate for the quarter, it will mark the 13th consecutive quarter of revenue growth for the index.
- Looking ahead, analysts expect (year-over-year) earnings growth of 5.4% for Q1 2024 and 10.0% for Q2 2024. For CY 2024, analysts are calling for (year-over-year) earnings growth of 12.2%.
SELF-RELIANCE IS ABOUT STOPPING CORPORATE DRIVEN BEHAVIOR – Time to Fight The Corporate Marketing Manipulation
-
- Our dependency on corporate promotions is trapping us into behavior that results in us slowly, unwittingly and irresponsibly giving up our financial freedom and therefore our Self-Reliance!
- There are starting steps To stop the entrapment and debt enslavement.
GLOBAL ECONOMIC REPORTING: What This Week’s Key Global Economic Reports Tell Us?
-
- GOVERNMENT DEFICIT SPENDING: Realistically, can the US continue to fund being the police force to the world by taxing US tax payers? Is this not the financial role of the UN with all world nations contributing?
DEVELOPMENTS TO WATCH
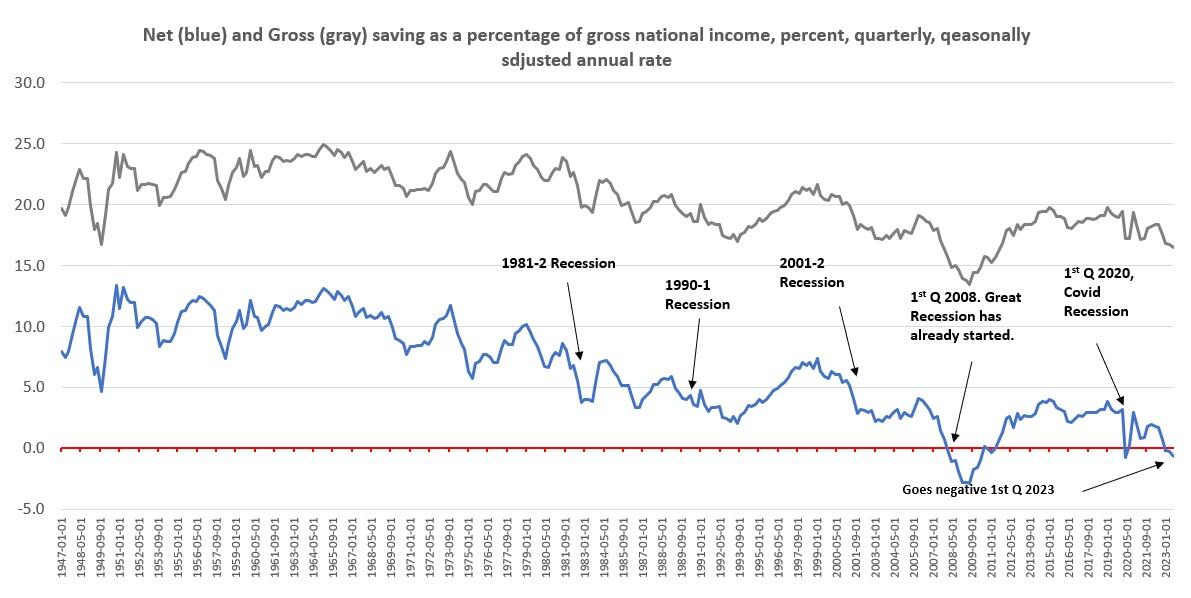 US NET SAVINGS GO NEGATIVE – A Sure Sign Of a Recession!
Net saving as a percentage of gross national income has been negative since the first quarter of 2023. The current period of negative net savings is only the third time that net savings have gone negative in more than 75 years.
The only other time net savings have gone negative is in the lead-up to the great recession and during the covid recession.
DAVOS ILLUMINAIRIES WARNING OF “DISEASE X” – The Next Great Reset Wave?
It is reported that this year’s Davos, Switzerland World Economic Forum (WEF) attendees could not stop chattering about the debut of the latest viral confection, “Disease X”, said to be twenty times deadlier than Covid-19.
Dutch virologist Geert Vanden Bossche has been warning about the dangers of vaccinating into the teeth of a pandemic. The world can expect a soon-to-come crisis of 30-to-40 percent mortality in highly vaccinated countries with the emergence of a new Covid variant that won’t be stopped by vax-damaged immune systems.
Q4 EARNINGS
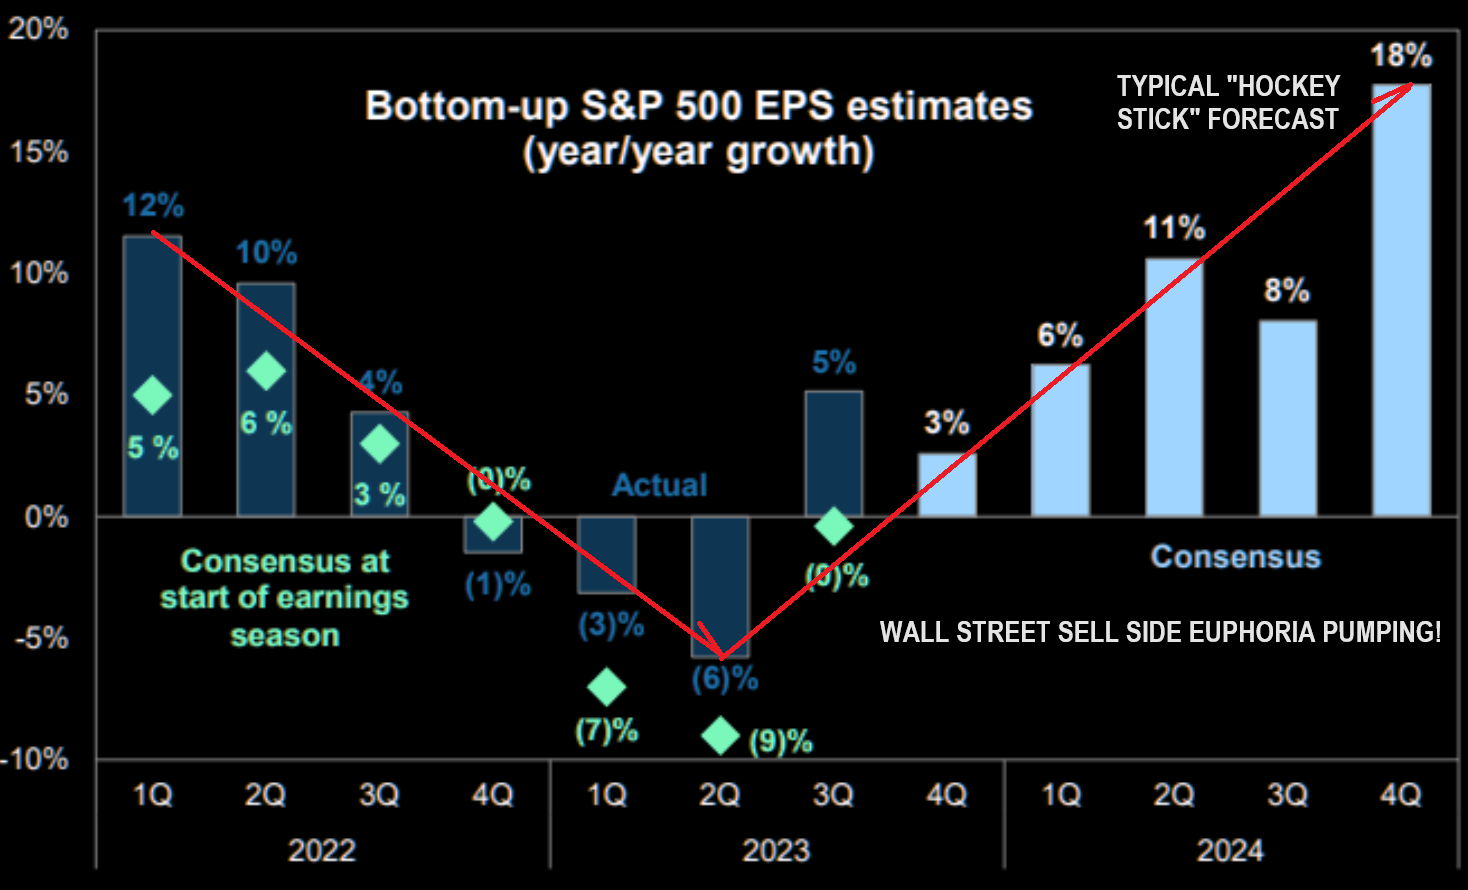 At this early stage, the fourth quarter earnings season for the S&P 500 is off to a weak start. The percentage of S&P 500 companies reporting positive earnings surprises is below average, while companies are reporting actual earnings that are below estimates in aggregate.
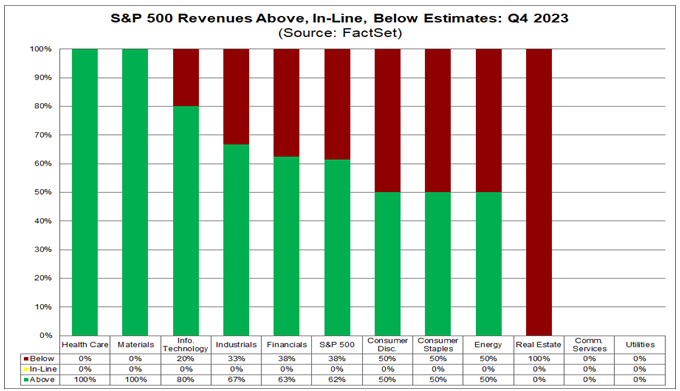
However, this subpar performance relative to estimates is mainly due to companies in the Financials sector.
The index is now reporting a year-over-year decline in earnings for the fourth time in the past five quarters.
IS THIS EVEN REMOTELY REALISTIC?
This Q4 2023 earning season is more about what THE CEO’s are signaling for 2024 in the analyst conference calls.
“We see stocks facing a high bar during this earnings season. Anything short of strong corporate guidance re-affirming current high growth expectations is likely to be penalized!”
-
- Earnings Scorecard: For Q4 2023 (with 10% of S&P 500 companies reporting actual results), 62% of S&P 500 companies have reported a positive EPS surprise and 62% of S&P 500 companies have reported a positive revenue surprise.
- Earnings Decline: For Q4 2023, the blended (year-over-year) earnings decline for the S&P 500 is -1.7%. If -1.7% is the actual decline for the quarter, it will mark the fourth time in the past five quarters that the index has reported a year-over-year decline in earnings.
- Earnings Revisions: On December 31, the estimated (year-over-year) earnings growth rate for the S&P 500 for Q4 2023 was 1.6%. Seven sectors are reporting (or are expected to report) lower earnings today compared to December 31 due to negative EPS surprises and downward revisions to EPS estimates.
- Earnings Guidance: For Q1 2024, 5 S&P 500 companies have issued negative EPS guidance and 3 S&P 500 companies have issued positive EPS guidance.
- Valuation: The forward 12-month P/E ratio for the S&P 500 is 19.5. This P/E ratio is above the 5-year average (18.9) and above the 10-year average (17.6).
GENERAL NOTES
-
- Negative earnings surprises reported by companies in the Financials sector have been the largest contributor to the decrease in the overall earnings for the index over the past week and since the end of the quarter.
- The blended revenue growth rate for the fourth quarter is 2.9% today, compared to a revenue growth rate of 2.9% last week and a revenue growth rate of 3.1% at the end of the fourth quarter (December 31).
- Downward revisions to revenue estimates and negative revenue surprises for companies in the Energy and Financials sectors have been the largest contributors to the decrease in overall revenues for the index since the end of the quarter.
- If 2.9% is the actual revenue growth rate for the quarter, it will mark the 13th consecutive quarter of revenue growth for the index.
- Looking ahead, analysts expect (year-over-year) earnings growth of 5.4% for Q1 2024 and 10.0% for Q2 2024.
For CY 2024, analysts are calling for (year-over-year) earnings growth of 12.2%.
GENERAL NOTES
-
- Negative earnings surprises reported by companies in the Financials sector have been the largest contributor to the decrease in the overall earnings for the index over the past week and since the end of the quarter.
- The blended revenue growth rate for the fourth quarter is 2.9% today, compared to a revenue growth rate of 2.9% last week and a revenue growth rate of 3.1% at the end of the fourth quarter (December 31).
- Downward revisions to revenue estimates and negative revenue surprises for companies in the Energy and Financials sectors have been the largest contributors to the decrease in overall revenues for the index since the end of the quarter.
- If 2.9% is the actual revenue growth rate for the quarter, it will mark the 13th consecutive quarter of revenue growth for the index.
- Looking ahead, analysts expect (year-over-year) earnings growth of 5.4% for Q1 2024 and 10.0% for Q2 2024. For CY 2024, analysts are calling for (year-over-year) earnings growth of 12.2%.
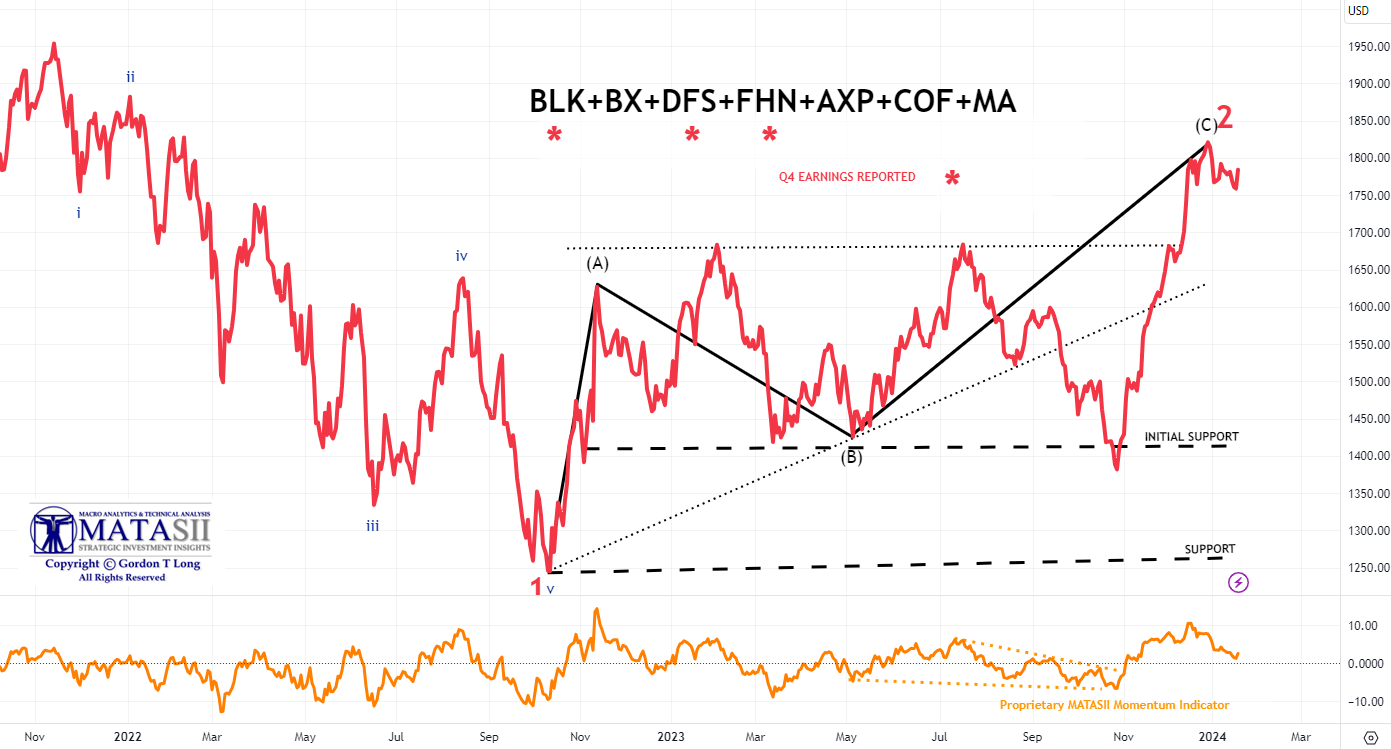
AS GOES THE BANKS, SO GOES THE MARKET!
AS GOES THE FINANCIALS, SO GOES THE BANKS!
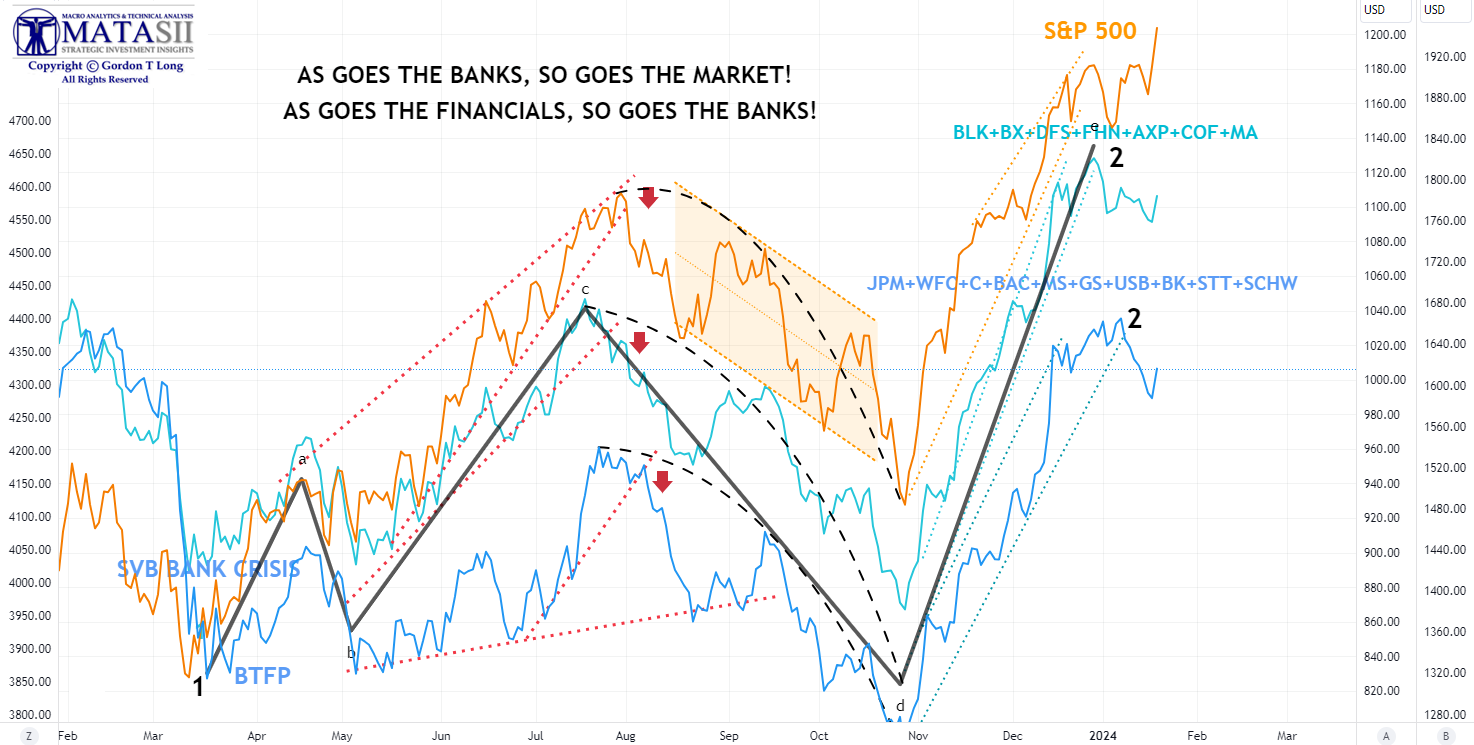
BANK EARNINGS
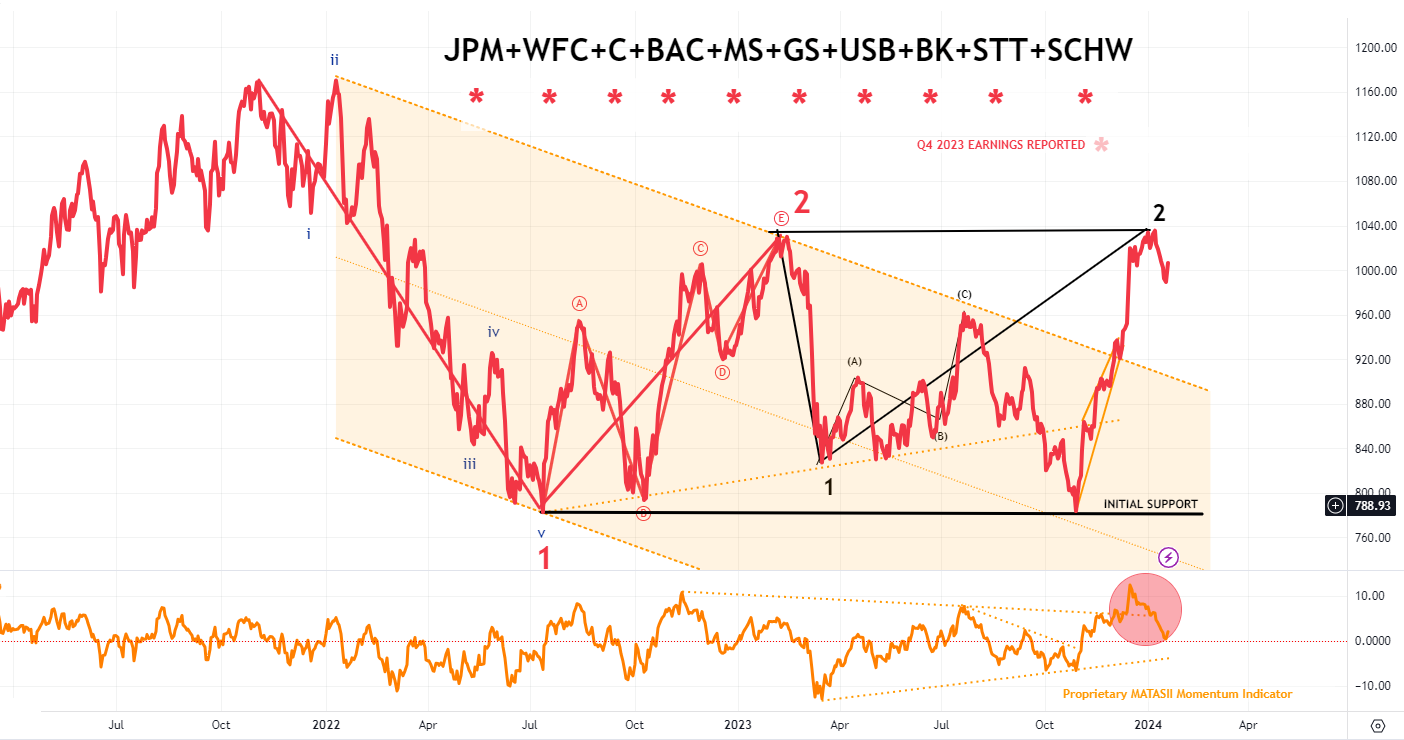
NOTE: Red % is closing price movement on announcement.
-
- JPMorgan (JPM) -0.5%: EPS and revenue beat, although revenue breakdown was more mixed. FY24 NII ex-markets guidance topped expectations. Results in 2023 reflect over earning on both NII and credit, but remain confident to continue to deliver very healthy returns even after they normalize.
- Net income was $2.5 billion, down 24%, with net revenue of $11.0 billion, up 3%.
- Banking revenue was $4.1 billion, up 6%.
- Investment Banking revenue was $1.6 billion, up 13%.
- Investment Banking fees were up 13%, predominantly driven by higher debt and equity underwriting fees.
- Wells Fargo (WFC) -3.5%: Missed on profit, but results included USD 0.20/share of severance expense for planned actions.
- In the quarter ending Dec. 31, 2023, Wells Fargo posted net income of $3.45 billion, or 86 cents per share, up slightly from $3.16 billion, or 75 cents a share, a year ago.
- Citi (C) +1%: Profit beat but revenue missed amid the pre-announced charges. FY24 revenue view surpassed Wall St. consensus and expects to cut 20k jobs by 2026.
- Citigroup Inc. reported net loss for the fourth quarter 2023 of $(1.8) billion, or $(1.16) per diluted share, on revenues of $17.4 billion.
- This compares to net income of $2.5 billion, or $1.16 per diluted share, on revenues of $18.0 billion for the fourth quarter 2022.
- Bank of America (BAC) -1%: Revenue, trading revenue, and net income fell short. Was hit by USD 3.7bln in combined charges, while net interest income fell 5% due to lower deposit balances and higher deposit costs.
- Bank of America (BAC) reported Q4 2023 earnings as follows:
- Revenue: $22.1 billion, which is a 10% decrease from the same period in 2022
- Net income: $3.1 billion, which is a decrease from $7.1 billion in 2022
- Adjusted earnings: 70 cents per share, which is a penny higher than the Zacks Consensus Estimate
- BAC’s Q4 2023 earnings beat analysts’ expectations, but revenue falls short of Wall Street’s estimates for the first time in two years.
- Morgan Stanley (MS) -4.2%: Post-earnings MS saw gains but pared into US cash open. Revenue beat helped by strong Wealth Management and IB businesses, although profit missed. CEO Pick warned of geopolitical risks and the possibility the US economy could weaken.
- The firm produced revenues of $54.1 billion in 2023 and ended the year with fourth quarter revenues of $12.9 billion.
- For the full year, ROTCE was 12.8% and EPS was $5.18.
- For the fourth quarter, ROTCE was 8.4% and EPS was $0.85. The full year efficiency ratio was 77.2%.
- Goldman Sachs (GS) +0.7%: Surpassed Wall St. consensus on EPS and revenue, but missed on NII with revenue breakdown mixed – FICC, IB, Global Banking & Markets all light.
- Reported EPS is $5.48, expectations were $3.47.
- US Bancorp (USB) -1.4%: Mixed report. EPS was essentially in line, while revenue fell short as did deposits, net-interest income, and non-interest income.
- U.S. Bancorp USB reported fourth-quarter 2023 earnings per share of 99 cents, which met the Zacks Consensus Estimate.
- Results were aided by higher fee income and lower provision for credit losses compared with the year-ago quarter.
- Bank of New York Mellon (BK) +4%: EPS, revenue, total deposits and net interest margin all surpassed expectations.
- For the quarter ended December 2023, The Bank of New York Mellon Corporation (BK) reported revenue of $4.31 billion, up 10% over the same period last year.
- EPS came in at $1.28, compared to $1.30 in the year-ago quarter.
- State Street Corporation (STT) Earnings per share (EPS) for the fourth quarter of 2023 was $0.55. According to Zacks Investment Research, the consensus EPS forecast for the quarter was $1.81, based on forecasts from seven analysts.
- Expenses increased 25% year-over-year to $2.822 billion in the fourth quarter.
- Quarterly cash net inflows of $29 billion, primarily into money market funds.
- Institutional money market fund AUM reached a record overall in 2023.
- Market share gains in a number of key areas, including institutional money market funds and U.S low-cost equity and fixed income ETFs.
- Charles Schwab (SCHW) -1.4%: Revenue missed, while EPS and many internals (deposits, total client assets, daily avg. trades, trading rev., new brokerage accounts) topped forecasts.
- Net income declined 47% Y/Y, with Bank deposits – 21% Y/Y, and total assets -11% in the same period.
- Q4 2023 net income was $1 billion, a 47% decrease from the previous year’s $2 billion.
- Q4 2023 net revenues decreased by 19% to $4.459 billion, while annual revenues declined 9% to $18.837 billion.
- SCHW’s adjusted earnings of 68 cents per share for Q4 2023 beat the Zacks Consensus Estimate of 65 cents.
- JPMorgan (JPM) -0.5%: EPS and revenue beat, although revenue breakdown was more mixed. FY24 NII ex-markets guidance topped expectations. Results in 2023 reflect over earning on both NII and credit, but remain confident to continue to deliver very healthy returns even after they normalize.
FINANCIAL EARNINGS
-
- BlackRock (BLK) +1%: Profits beat while revenue was inline, but fixed income and equity net inflows were light.
- Raised quarterly dividend by 2%. The plan is to acquire the fund manager Global Infrastructure Partners (GIP) in a deal worth USD 12.5bln.
- Quarterly operating income of $1.7 billion was up 9%, while earnings per share of $9.66 was 8% higher versus a year ago, also reflecting higher non-operating income in the current quarter.
- Adjusted earnings per share: $9.66, which is higher than the Zacks Consensus Estimate of $8.84
- Revenue: $4.63 billion, which is 7% higher than the previous year
- Operating income: $6.6 billion, which is a 2% decrease from 2022
- Earnings per share: $37.77, which is a 7% increase from 2022
- Discover Financial (DFS) -10.8%: Large profit miss driven by higher expenses. Looking ahead, FY24 loans view was light and sees FY net interest income down 2-5% Y/Y.
- First Horizon Corporation (FHN) reported Revenue: $800 million, down 9.3% from the same period in 2022.
- Earnings per share (EPS): $0.32, compared to $0.51 in 2022
- Net income: $175 million, or $0.31 per share, available to common shareholders
- Net income on an adjusted basis: $178 million, or $0.32 per share
- Net income available to common shareholders in 2023: $865 million, or $1.54 per share
- FHN also generated 29 basis points of common equity Tier 1 capital in Q4 2023, bringing its year-end total to 11.4%.
- BlackRock (BLK) +1%: Profits beat while revenue was inline, but fixed income and equity net inflows were light.
SELF-RELIANCE IS ABOUT STOPPING CORPORATE DRIVEN BEHAVIOR – Time to Fight The Corporate Marketing Manipulation
44 Minutes, 33 Slides
Our dependency on corporate promotions is trapping us into behavior that results in us slowly, unwittingly and irresponsibly giving up our financial freedom and therefore our Self-Reliance!
HERE ARE A FEW EXAMPLES OF HOW:
SUBSCRIPTION CREEP
-
- The cord-cutting movement was originally marketed to budget-minded media consumers who were fed up with overpriced cable packages. Over time, though, many wound up paying as much or more for the ever-growing assortment of streaming services that households have to cobble together to replace traditional TV.
- “The era of subscription services has ushered in a subtle yet pervasive trap — subscription creep.”
- “Frugal individuals might sign up for multiple low-cost subscriptions, thinking they’re insignificant, but the cumulative effect can drain finances steadily over time.”
- “It’s important to recognize the need to regularly assess and eliminate redundant subscriptions.”
CONVENIENCE: When Payments Happen Automatically They Count on Your Time Pressures for Lack of Management.
DISCOUNT DECEPTION
-
- Thrifty people love a deal above almost all else, but the lure of markdowns can cause even the most cautious spenders to fritter away money on things they didn’t need.
- “Sales and discounts can be enticing, but they often lead to overspending when consumers perceive them as ‘savings’.“
- Frugal individuals might fall into the trap of buying unnecessary items simply because they are on sale.
- “Recognizing the psychology behind perceived savings versus actual spending is key to avoiding this deceptive pitfall.”
DECEPTION: Sale prices removes our responsibility for price comparison and knowing the real price.
CONVENIENCE CULTURE
-
- The fast way is almost always more expensive than the right way, but the temptation to cut corners is everywhere and, therefore, hard to resist for even the stingiest among us.
- “The allure of convenience, from food delivery services to ready-made meals, can subtly erode a frugal mindset.”
- “While time-saving conveniences are tempting, they often come with a hefty price tag.”
- “Evaluate the true cost of convenience to avoid sacrificing financial prudence for momentary ease.”
CONVENIENCE: Sacrificing financial prudence for momentary ease.
LIFESTYLE CREEP
-
- Spending more as you earn more is not a hallmark of the thrifty mindset, but even the most prudent spenders can fall into this trap, because lifestyle creep happens so gradually.
- “Individuals, even frugal ones, may succumb to lifestyle inflation without realizing it.”
- “Gradual upgrades in housing, vehicles, or even dining habits may seem inconspicuous, but they can significantly impact long-term financial goals.”
EGO: “You Deserve it”, “You Have Earned It”, and ” Live Life Now on Your Terms”
are Corporate Entrapment Engineered Slogans.
EMOTIONAL SPENDING
-
- The most disciplined spenders have feelings too, and feelings have a way of steering spending plans off course.
- “Even frugal individuals are susceptible to emotional spending, using purchases as a coping mechanism for grief, stress, boredom, or sadness.”
- “Recognizing the emotional triggers behind spending is crucial for maintaining financial discipline.”
- “Behavioral cues can serve as warning signs to redirect emotional impulses toward healthier outlets.”
EMOTIONAL TRIGGERS: Corporate Marketing is about understanding your Emotional Triggers!
THE GAMBLER’S FALLACY
-
- “Don’t throw good money after bad” is an idiom that reminds gamblers to cut their losses when their luck turns sour, so they don’t fall victim to the dreaded “one more hand” mindset. This concept applies beyond the blackjack table.
- “Engaging in speculative investments or chasing losses in the hope of recouping money lost is a behavioral trap known as the gambler’s fallacy.”
- “Frugal individuals may be drawn into risky financial decisions under the illusion that past losses increase the likelihood of future gains.”
- Advocate and Adopt a rational and diversified investment approach.
FEAR OF MISSING OUT: Trading Markets Increasingly Plays the proven game of entrapment called FOMC – Fear of Missing Out
SOCIAL COMPARISON SYNDROME
-
- Even the most pennywise spenders have neighbors, friends and social media accounts — and the pressure to keep up with the Jones’s can be too much, even for them to resist.
- “Frugal individuals may fall prey to the subtle trap of social comparison, feeling pressured to match the spending habits of peers or societal expectations.”.
- “It’s important to stay true to individual financial goals and values, resisting the urge to conform to external pressures.”
PEER PRESSURE: Corporate Marketing 101 is Creating the Pressure of “Keeping Up With the Jones’s” or being the “In person with the latest thing, fashion or status symbol.”
SAVING MONEY WITHOUT SAVING IT
-
- It is essential to remember that frugal spending is only one piece of the personal finance puzzle.
- Penny-pinching won’t pay off in the long run, if an obsession with saving money comes at the expense of saving for the future.
- “Even those who meticulously manage day-to-day expenses may neglect long-term financial planning, especially when it comes to retirement contributions.”
- “Consider the long-term impact of not maximizing retirement savings, especially the power of compound interest over time.”
FALSE SPENDING ENTICEMENTS: Saving is of no value in today’s inflationary world unless you both understand and take full advantage of Compound Interest versus corporate spending enticements!
DEBT IS THE WORLD’S OLDEST FORM OF ENTRAPMENT & ENSLAVEMENT.
GLOBAL ECONOMIC INDICATORS: What This Week’s Key Global Economic Releases Tell Us
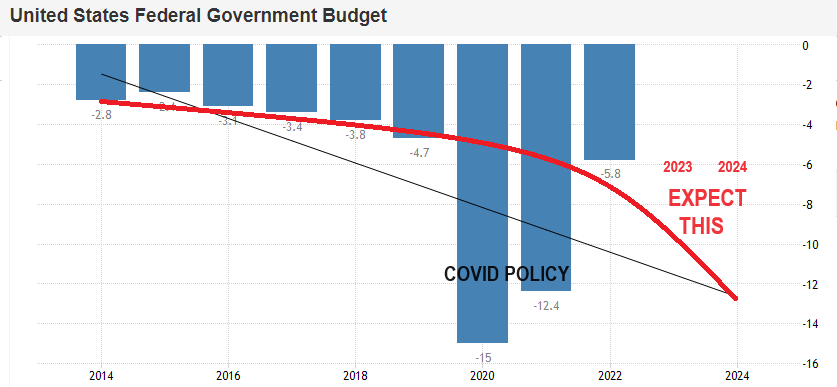 US GOVERNMENT BUDGET DEFICIT
According to the U.S. Department of the Treasury, the US government’s deficit for fiscal year 2023 is $1.7 trillion. This is a 23% increase from the 2022 deficit, and is the highest federal deficit in US history outside of the pandemic.
As of October 2023, the US government’s deficit was 6.3% of GDP, which is higher than 5.4% in 2022.
IS THERE A CORRELATION HERE??
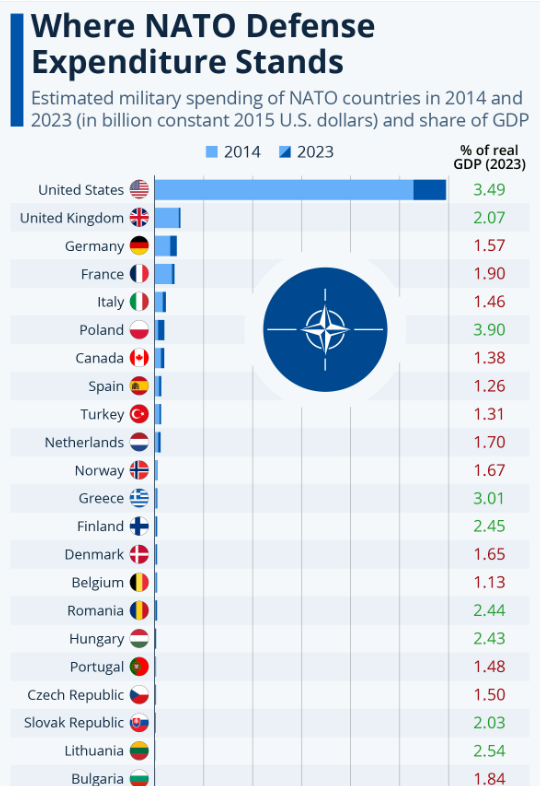
 Defense funding is set at $886 billion for the current fiscal year. The latest accord pegs non-defense funding at nearly $773 billion.
“Defense spending exceeds all other discretionary spending combined. What does that say about our nation’s priorities?”
Robert Kennedy Jr
U.S. military spending at $877 billion in 2022 was more than the next 10 countries combined.
REALISTICALLY CAN THE US CONTINUE TO BE THE POLICE FORCE FOR THE WORLD?
Can the US continue to fund (by taxing US tax payers) being the police force to the world?
Is this not the financial role of the UN with all nations contributing?
GLOBAL MACRO
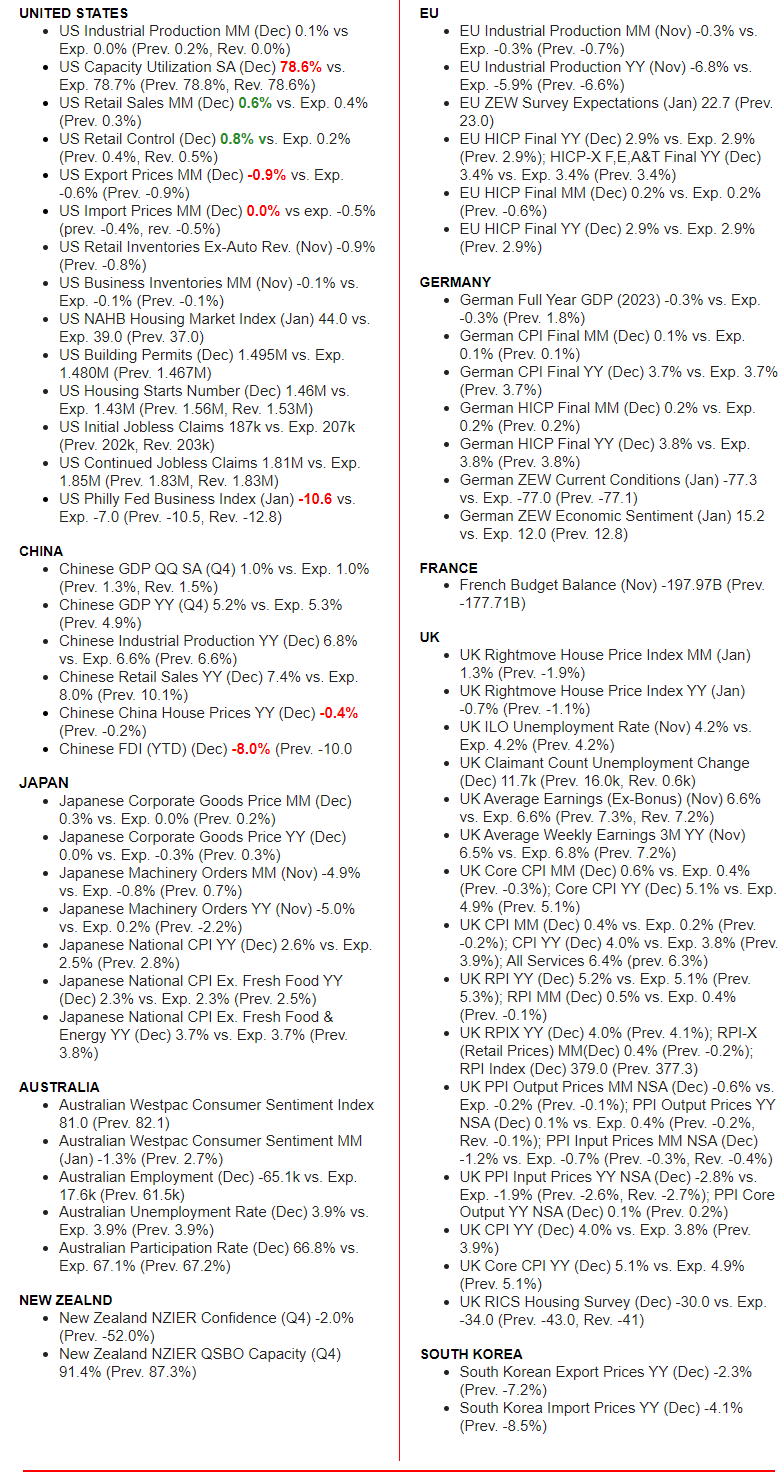
WHAT DOES YOUR SCAN OF THE DATA BELOW TELL YOU? – THE MEDIA AVOIDS BAD NEWS!
We present the data in a way you can quickly see what is happening.
THIS WEEK WE SAW
Exp=Expectations, Rev=Revision, Prev=Previous
DEVELOPMENTS TO WATCH
 US NET SAVINGS GO NEGATIVE – A Sure Sign Of a Recession!
Net saving as a percentage of gross national income has been negative since the first quarter of 2023. The current period of negative net savings is only the third time that net saving has gone negative in more than 75 years.
The only other times net savings have gone negative is in the lead-up to the great recession, and during the covid recession.
In general, net saving tends to fall steeply in the early periods of recessions, and this can be seen in the graph, going back several cycles. (A similar trend exists for gross savings as a percent of GNI.) This likely reflects a few different trends, one being the fact that the federal government continues to go more deeply into the red when tax revenues are weak as they are now. But one thing is clear: net saving has worsened rapidly since the fourth quarter of 2020, dropping from 2.9 percent in that quarter to -0.7 percent in the third quarter of last year.
Such a rapid drop virtually always indicates the US has either entered a recession or will soon enter one.
DAVOS ILLUMINAIRIES WARNING OF “DISEASE X” – The Next Great Reset Wave?
I t is reported that this year’s Davos, Switzerland World Economic Forum (WEF) attendees could not stop chattering about the debut of the latest viral confection, “Disease X”, said to be twenty times deadlier than Covid-19.
Dutch virologist Geert Vanden Bossche has been warning about the dangers of vaccinating into the teeth of a pandemic. The world can expect a soon-to-come crisis of 30-to-40 percent mortality in highly vaccinated countries with the emergence of a new Covid variant that won’t be stopped by vax-damaged immune systems.
It means not just a bone-chilling, unprecedented mega-wave of deaths, but the likely dysfunction of every complex system that advanced nations depend on for normal operation, as the people who know how to run them succumb. That is, farewell to normal modern life as we have known it.
It’s even possible that some of the things that cease operation will include the WEF, the WHO, the EU and the CDC, considering their presumably multi-vaxxed and boosted members.
AN EXPLOSIVE JANUARY OPEX CLOSING SURGE
A NEW ALL TIME CLOSING HIGH TOP!
Click All Charts to Enlarge
1 – SITUATIONAL ANALYSIS
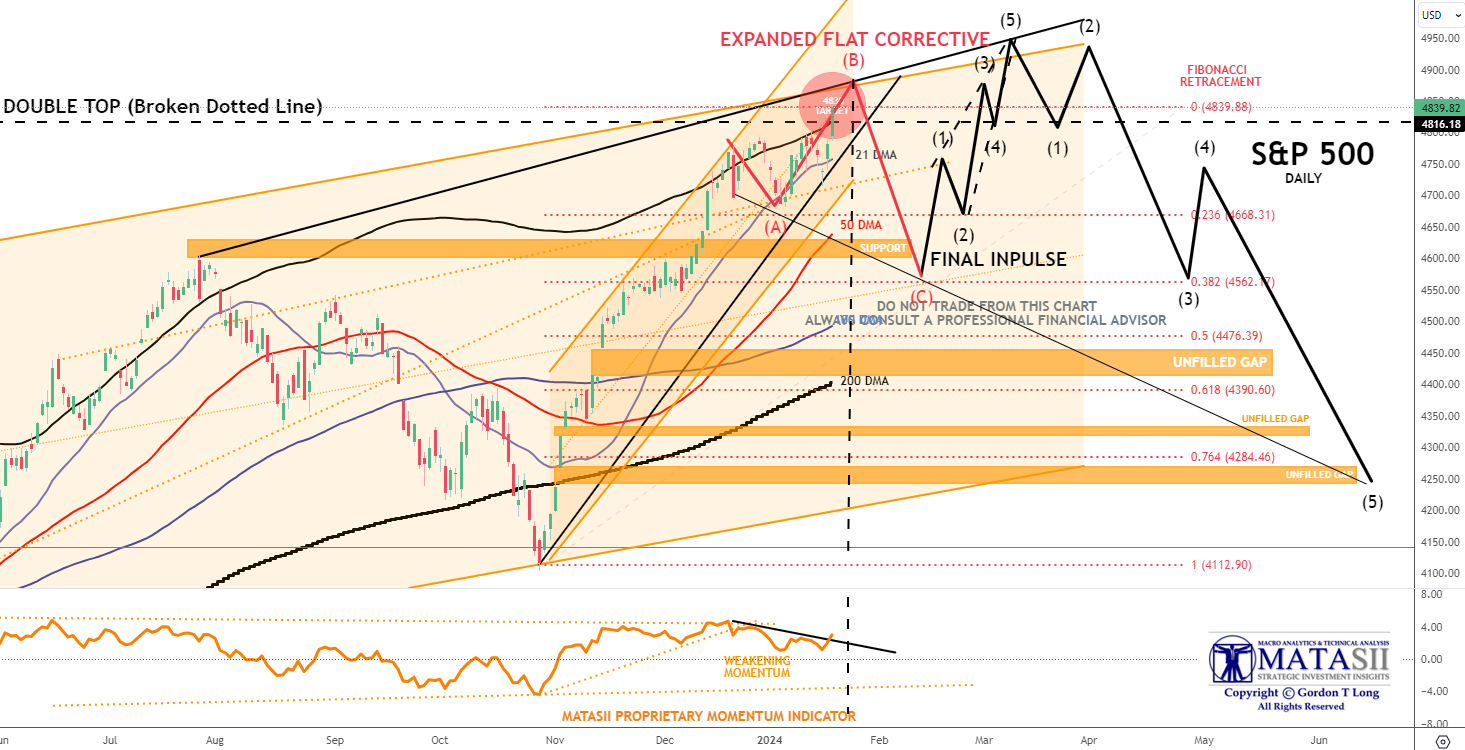
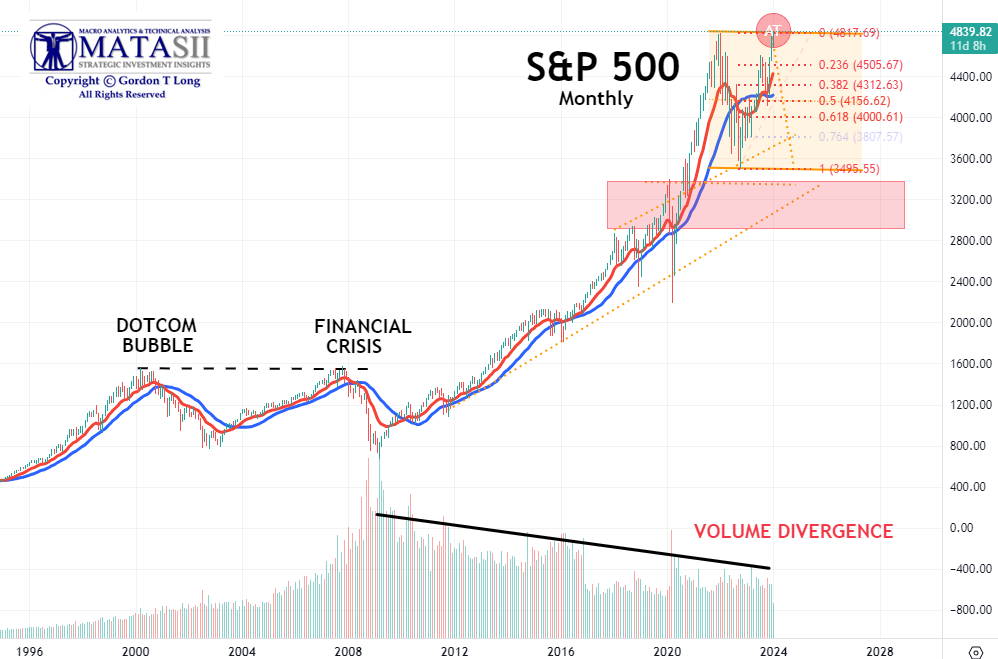 THE DOUBLE TOP IS FINALLY BROKEN!
With the end of day January option expiration surge, the S&P 500 achieved an all-time historic closing high.
The long held double top was decisively broken by Magnificent Seven buying.
The MATASII CROSS has been signaling a BUY on a monthly basis since July when the Federal Reserve raised the Fed Funds Rate for the last time in this cycle.
To add to the sudden surge, next week we begin to face the reality of the Stock Buyback Window ending, as companies start announcing their Q4 2023 earnings.
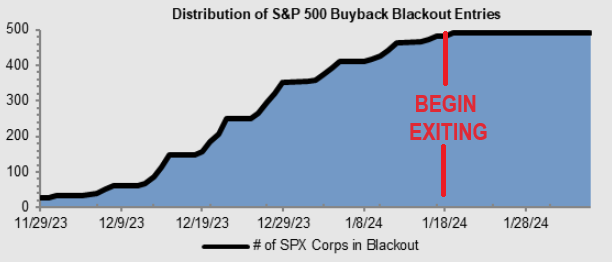 BUYBACK WINDOW BEGINS TO OPEN
Corporations have been in their Buyback Window going into earning season. This is normally a problem for the markets since corporate Buy Back Buying, along with the Magnificent 7, has been the pillar of this market. Though there are 2 weeks left of the buyback blackout window, companies start to exit blackout as they report earnings.
Companies are expected to create the largest demand for US stocks in 2024 and have recently been missing in action.
CHART BELOW
The S&P 500 closed at 4839, just slightly above our 4830 target (inside the red balloon).
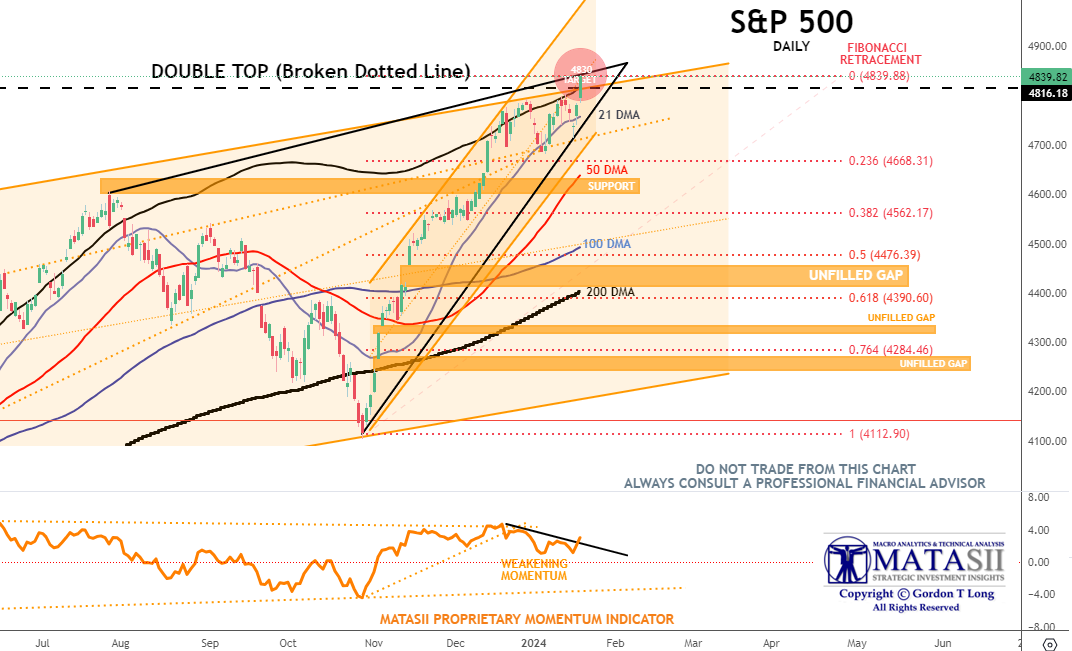
A THOUGHT EXPERIMENT
 What happens next? There are now many possibilities to be considered.
Our current thinking is as follows:
-
- Friday’s momentum surge, corporate stock Buybacks resuming, along with investor FOMO is likely to push the current upward leg a little higher – (labeled (B)).
- We then believe a long overdue consolidation is required before stocks can reach for newer highs. This would complete the Expanded Flat Corrective process labeled below.
- With the consolidation in place, a final upward leg to new highs is likely to occur (labeled “Final Impulse” in black).
- Stocks will then likely begin a pullback which should close the “Open Gaps” shown below.
THIS IS A THOUGHT EXPERIMENT AND SHOULD NOT BE TRADED!!
2 – FUNDAMENTAL ANALYSIS
 DO THE FUNDAMENTALS SUPPORT THIS?
Main bullets for a 5% pullback:
-
- FED EXPECTATIONS: The expectations for a March rate cut are seen as too dovish. This is lifting Bond Yields and the US$, which is a headwind this week for stocks.
- POSITIONING: We are stretched with excessive long positions & euphoric expectations.
- SEASONALITY: Over the past 25 years, January has typically seen an equal number of ups and downs. The average return, whether positive or negative, is around 4%. With the SPX slightly up this month, there’s a possibility of a pullback.
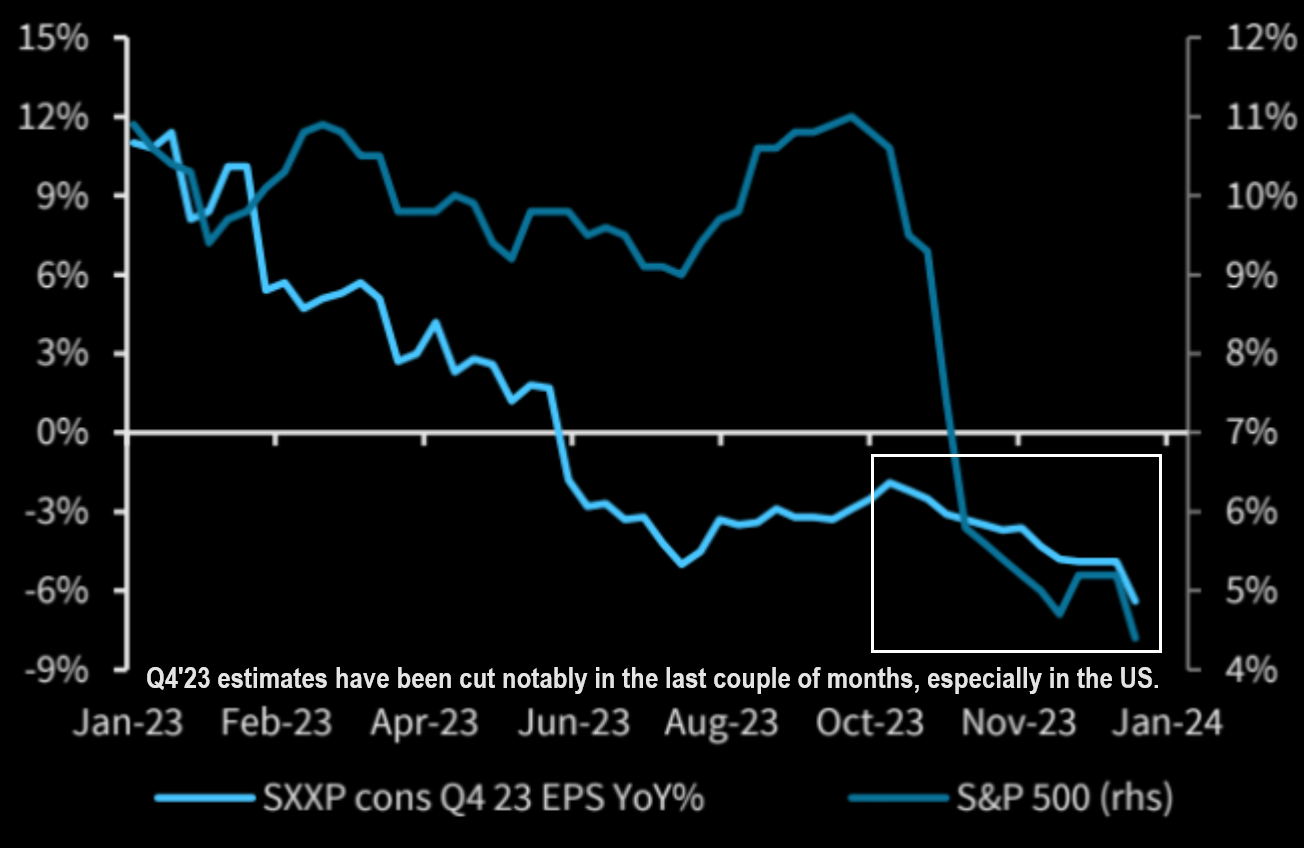 EARNINGS: There is increasing anticipation of disappointments in Tech earnings.
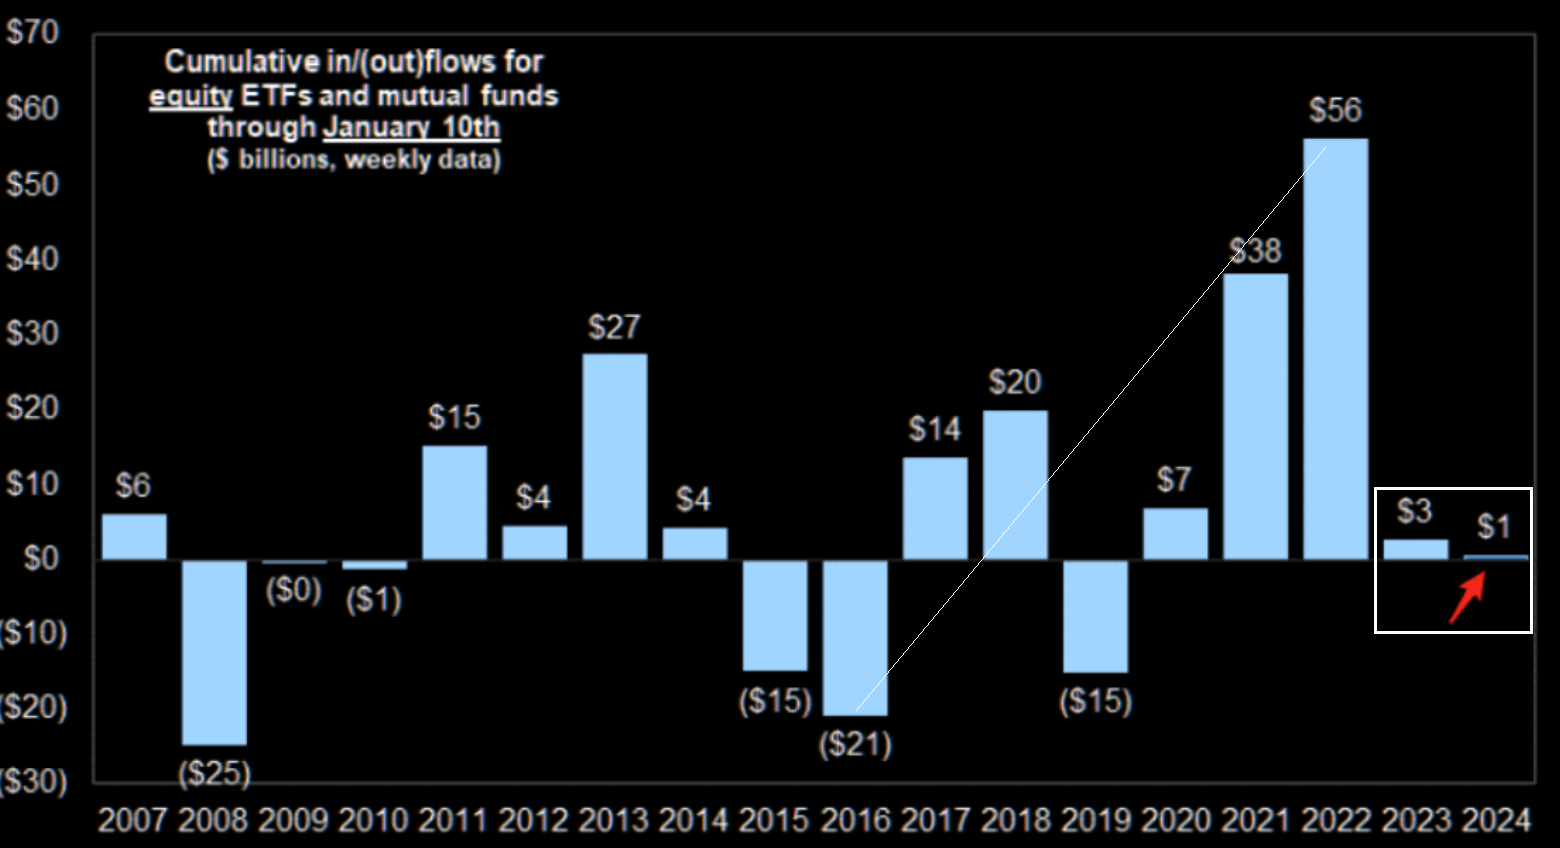
- FLOWS: The market might see reduced retail demand, weaker buyback bids and a lack of movement from Money Market Funds (MMFs) into Equities.
- OVERDUE CONSOLIDATION:
- The S&P 500 hasn’t declined by 2% or more for 225 consecutive trading days, the longest streak since a 351-day stretch that lasted from September 2016 through February 2018.
- The SPX remains stuck inside the 4720/4840 range. Chasing break out moves, both ways, has been a costly strategy so far. Note the negative RSI divergence going even more extreme.
BOTTOM LINE: There’s a significant potential for the market to turn bearish, particularly if the SPX doesn’t break through the 4,800 level next week after this week’s January Options Expiration.
3 – TECHNICAL ANALYSIS
DO THE “CROSS ASSET” TECHNICALS SUPPORT THIS?
The Equity Markets are reacting to:
-
- When YIELDS RISE stocks normally FALL
- When the US$ RISES stocks normally FALL
- When BOTH YIELDS and US$ RISE together, stocks almost always FALL, (exceptions like current OPEX window).
It would appear Yields in the very Near Term want to RISE and the US$ is likely to STRENGTHEN a little further to prior to Moving Average Crosses.
YIELDS
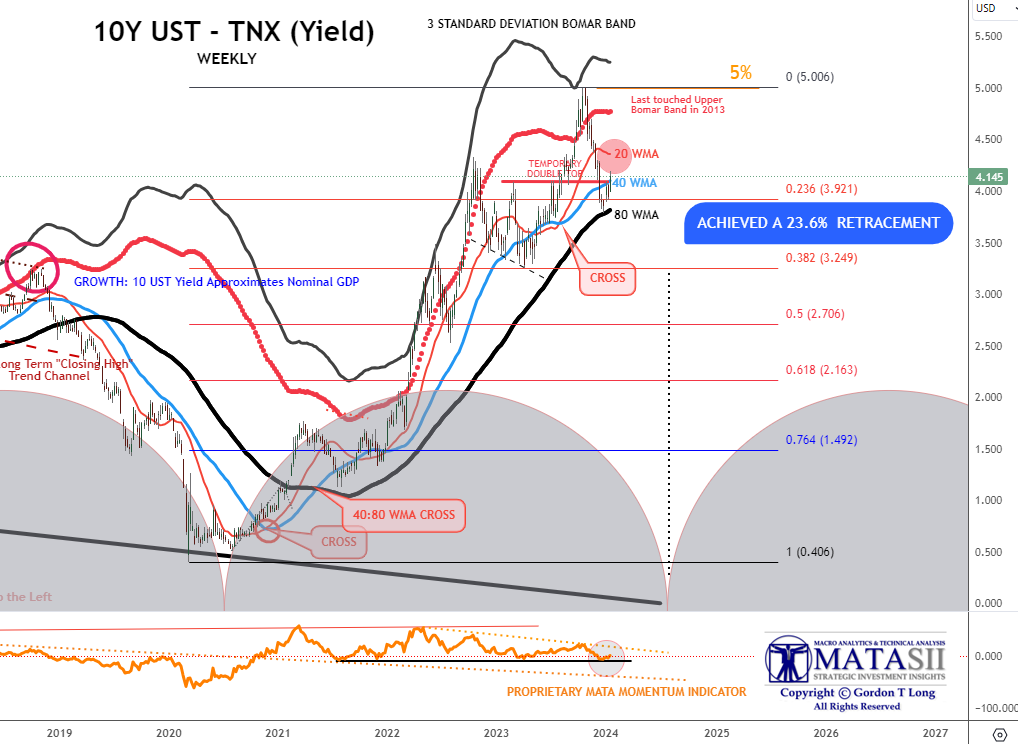
 10Y UST “TNX” – WEEKLY – YIELD
US Treasury Yields as measured by the “TNX” are currently in a consolidation of the trend of lower yields in anticipation of Fed Rate cuts.
We currently anticipate the rebound in rising yields taking yields towards to the 4.22-4.35% range.
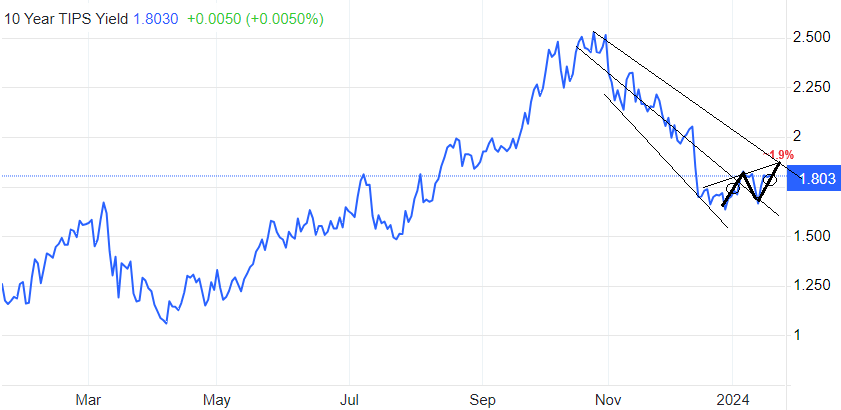
CHART RIGHT: Watch closely for continued rising Real Yields (TIPS) to ~1.9% to confirm this projection.
YOUR DESK TOP / TABLET / PHONE ANNOTATED CHART
Macro Analytics Chart Above: SUBSCRIBER LINK
CURRENCY
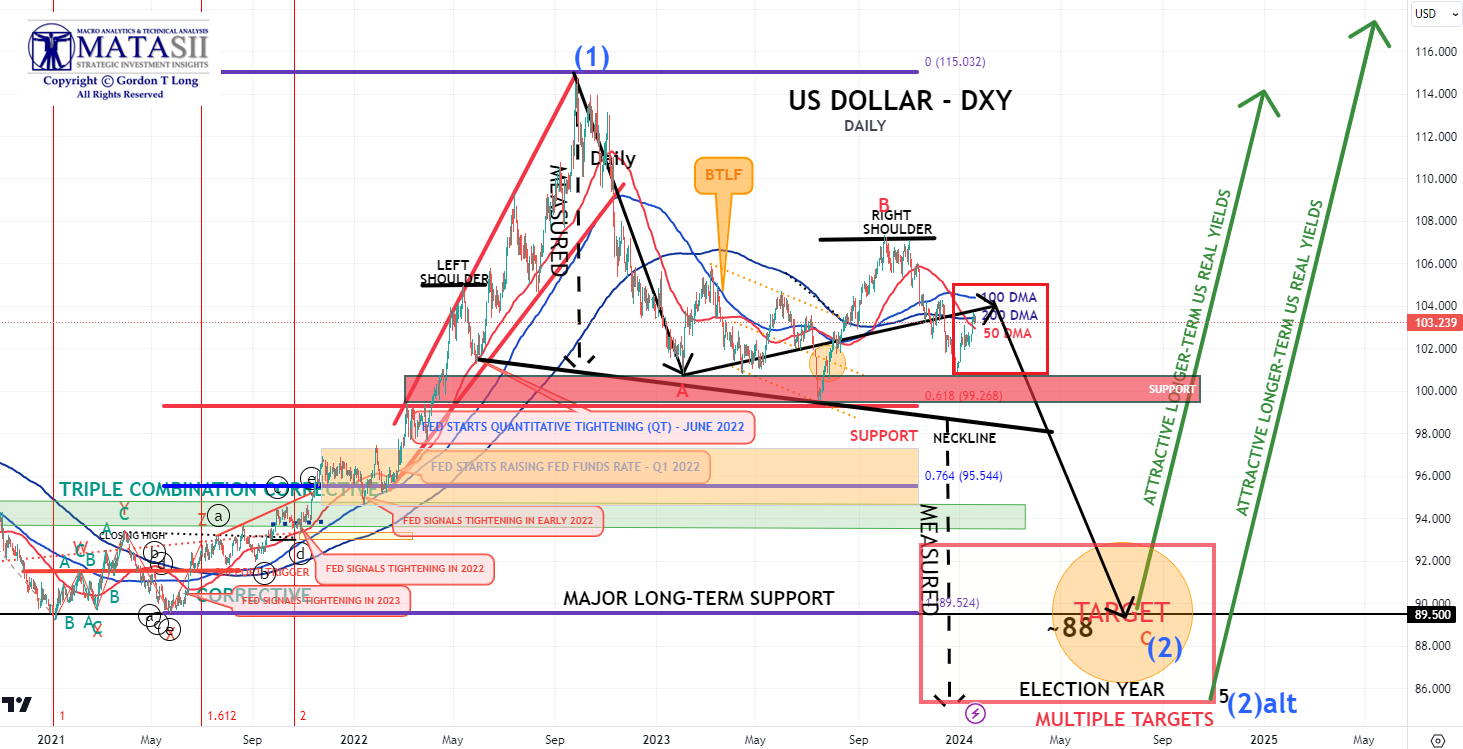
US$ – “DXY” – Daily
The US$ has been showing strength in the new year as it moved upwards to its 200 DMA. A further slight lift higher towards to 100 DMA may also occur if Real Yields continue towards the ~1.90 range. This is likely to mark an intermediate top in the DXY as the Moving Averages then begin crossing, giving a “bearish” signal.
YOUR DESK TOP / TABLET / PHONE ANNOTATED CHART
Macro Analytics Chart Above: SUBSCRIBER LINK
US EQUITY MARKETS
CONTROL PACKAGE
There are FIVE charts we have outlined in prior chart packages that we will continue to watch closely as a “control set” over the next 10 days.
-
- The S&P 500 (CHART LINK)
- The DJIA (CHART LINK)
- The Russell 2000 through the IWM ETF (CHART LINK)
- The MAGNIFICENT SEVEN (CHART LINK)
- Nvidia (NVDA) (CHART LINK)
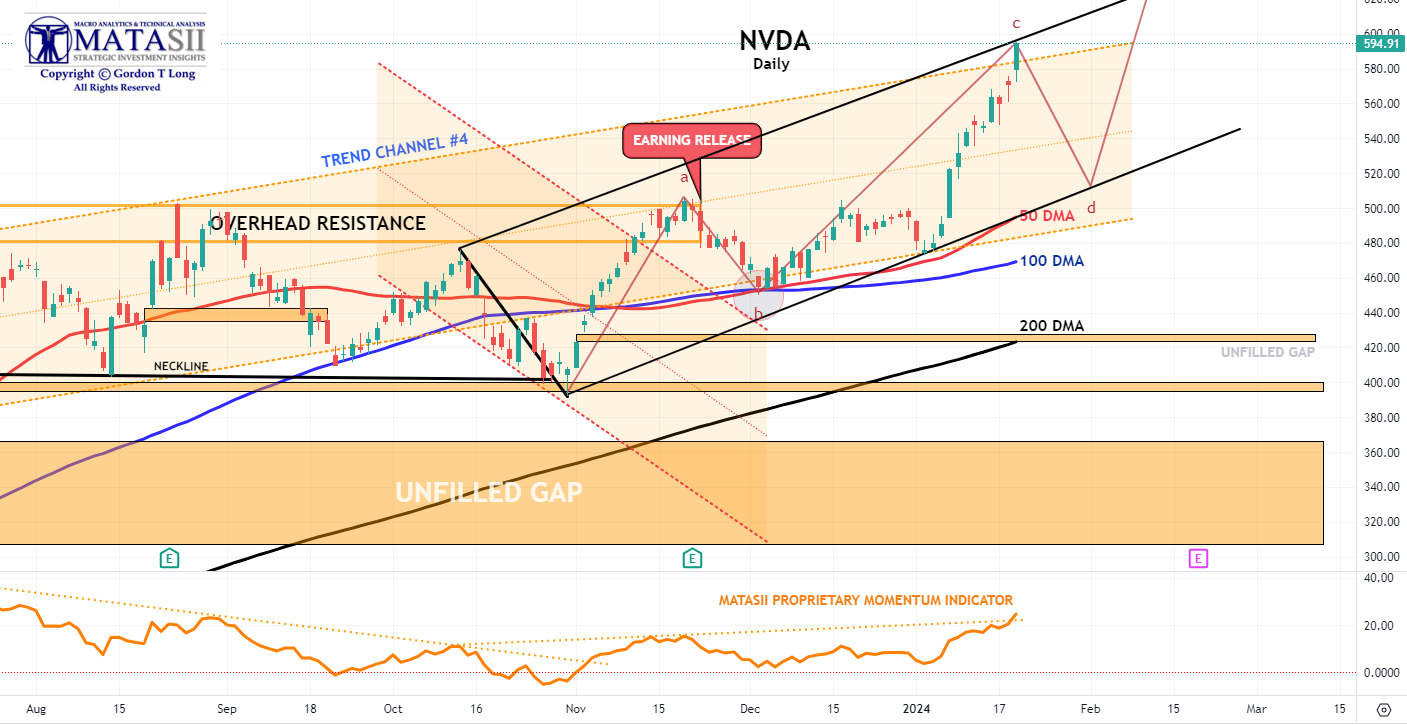
NVDA
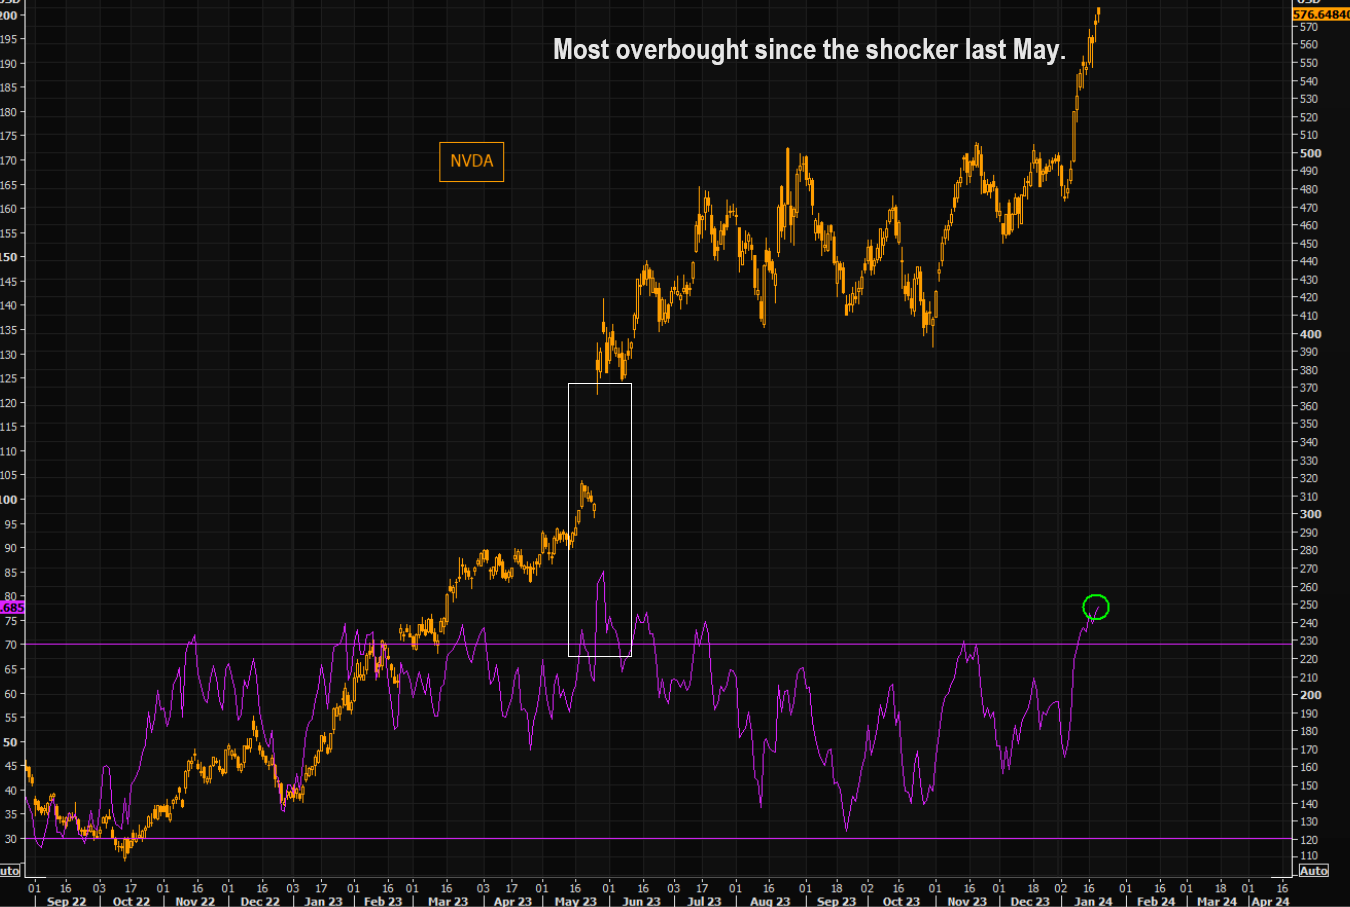 NVDA may be the most representative of what lies ahead for the equity markets.
We believe the major unfilled gap needs to be filled before NVDA can potentially significantly achieve further gains. Remember the analogy LINK
CHART RIGHT
NVDA is the most overbought since the shocker last May.
YOUR DESK TOP / TABLET / PHONE ANNOTATED CHART
Macro Analytics Chart Above: SUBSCRIBER LINK
FAIR USE NOTICE This site contains copyrighted material the use of which has not always been specifically authorized by the copyright owner. We are making such material available in our efforts to advance understanding of environmental, political, human rights, economic, democracy, scientific, and social justice issues, etc. We believe this constitutes a ‘fair use’ of any such copyrighted material as provided for in section 107 of the US Copyright Law. In accordance with Title 17 U.S.C. Section 107, the material on this site is distributed without profit to those who have expressed a prior interest in receiving the included information for research and educational purposes. If you wish to use copyrighted material from this site for purposes of your own that go beyond ‘fair use’, you must obtain permission from the copyright owner.
NOTICE Information on these pages contains forward-looking statements that involve risks and uncertainties. Markets and instruments profiled on this page are for informational purposes only and should not in any way come across as a recommendation to buy or sell in these assets. You should do your own thorough research before making any investment decisions. MATASII.com does not in any way guarantee that this information is free from mistakes, errors, or material misstatements. It also does not guarantee that this information is of a timely nature. Investing in Open Markets involves a great deal of risk, including the loss of all or a portion of your investment, as well as emotional distress. All risks, losses and costs associated with investing, including total loss of principal, are your responsibility.