Gordon T Long

Gordon T Long

Global Macro Research | Macro-Technical Analysis 

TIPPING POINTS

CREDIT CONTRACTION


DEBT: Borrowing Is Increasingly Problematic!

SIMPLY AN INADEQUATE RESPONSE!

====
 
THE FEDERAL RESERVE’S POOR RESPONSE TO HISTORIC US INFLATION IS NOW SERIOUSLY COMPOUNDING A NATIONAL PROBLEM!
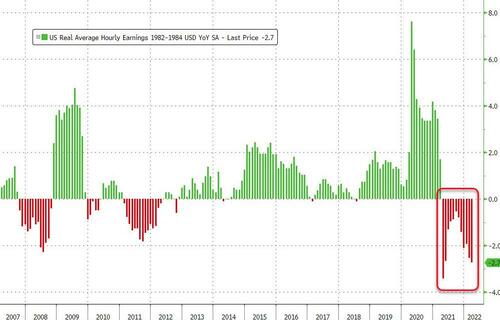
  • Real average hourly earnings to offset exploding inflation fell for the 12th straight month. It was -2.7% as last reported. This is now leaving borrowers unable to increase their existing debt burden.
  • The Federal Reserves slow response to inflation will likely result in Prices and Wages both continuing to spiral upward until the cumulative erosion in inflation-adjusted incomes causes the economy to collapse into a recession or worse!
  • Higher gasoline prices has accounted for the bulk of increases in retail sales as consumers pulled back in other areas. Online sales fell for the second straight month. It was the first back-to-back decline in online sales in over a year.
  • Consumers are paying more and getting less, which does not “underpin” an economy. Just because dollar widget sales increase doesn’t mean people bought more widgets. It could be that they bought fewer widgets but paid more for them.
  • In order to keep up with surging prices, Americans have been turning to plastic. Revolving credit, primarily credit card debt, rose by a whopping 20.7% in February. That helped fund a 0.8% increase in February retail sales – revised up in the latest data from 0.3%. This raises an important question: how much longer can over-indebted consumers keep paying these upward-spiraling prices? Especially given the fact that the Fed is now raising borrowing costs. They can’t. Savings are running dry and credit cards have limits.
  • Home Sales have reached the point of unaffordability based on both price and rates. Sales have recently noticeably dropped along with new mortgage applications.
  • Corporate Profit Margin pressure remains a concern as Producer Price acceleration (PPI up a stunning 11.2% YoY in March) outpaces the ability of companies to raise consumer prices.
  • Investor Margin debt dropped by $80 billion, or 8.8% in January when the market peaked. This was the largest dollar-drop ever and one of the largest percentage-drops ever. Margin debt continues to fall.
====
 
The Fed’s inadequate response to exploding inflation is directly resulting in the adoption of what is termed “Inflationary Psychology.” What occurs is that consumers purposely begin to advance their purchases in order to beat anticipated future price increases. Firms meanwhile readily pass along higher costs to consumers, including the future cost increases that they anticipate. That’s what happened in the last inflationary age, which started in 1965 and ended in 1982. Expected inflation became a self-fulfilling prophecy.
 
US Borrowing is Slowing on Multiple Fronts For Multiple Reasons!
 
The Commonality is Poor Monetary, Fiscal & Public Policies Driven Politically – Not Economically!
 
DEBT
 
We examine below just a few of the key metrics, indicators and areas of US borrowing that we follow at MATSII.com:
i) Current US Household Debt Levels. ii) Inflation, iii) Consumption, iv) Mortgage Borrowing, v) Corporate Borrowing and vi) Margin Debt. These centers of Debt creation is a continuation of our previous newsletter discussions on Liquidity and Credit.


CURRENT US HOUSEHOLD DEBT LEVELS
 
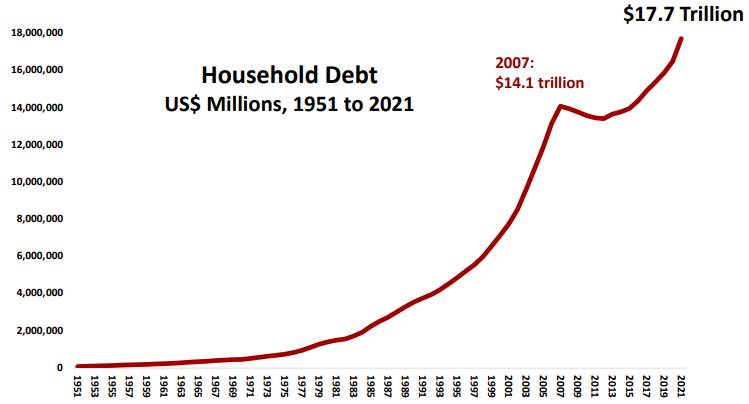
US Households now have $3.6 trillion more debt than they had during the 2008 Financial Crisis. This amount is not only dramatically larger, but even worse is that income has not risen fast enough to support it, higher rates and exploding inflation on the basic necessities of living.
 
 
In 2007, the Household Sector had more debt than it could afford to repay. When they defaulted on much of it, the Crisis of 2008 began.
 
 
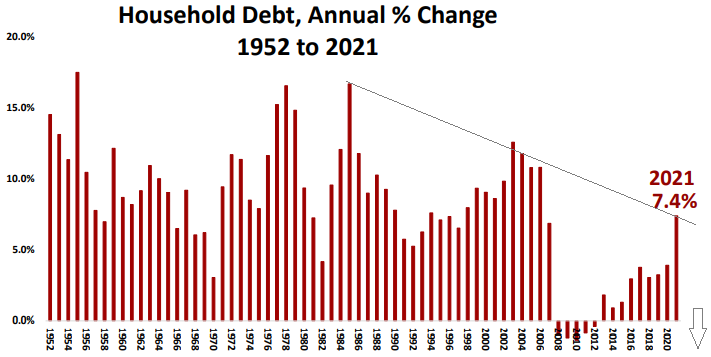
The 7.4% increase in 2021 was the highest since the Crisis of 2008, but still less than most years before the crisis.
 
INFLATION: IS NOW SERIOUSLY IMPACTING BORROWERS’ ABILITY TO INCREASE THEIR DEBT BURDEN
 
  • CONSUMER PRICE INDEX (CPI)
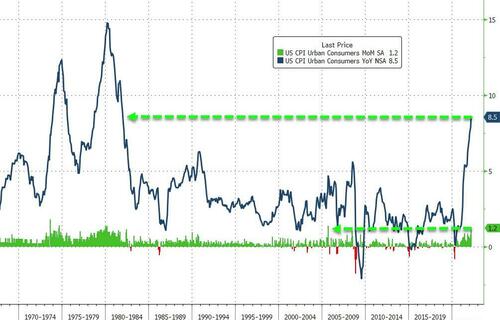
    •  Headline CPI rose 1.2% in March (vs +1.2% MoM) which sent the headline CPI up a shocking 8.5% YoY (vs +8.4% YoY exp and +7.9% prior) – the highest since 1981!
    • The 1.2% MoM rise is the biggest since Sept 2005 and CPI has risen for 22 straight months.
    • The shelter index was by far the biggest factor in the increase, with a broad set of other indexes also contributing, including those for airline fares, household furnishings and operations, medical care and motor vehicle insurance.
 
Real average hourly earnings to possibly offset inflation fell for the 12th straight month.


The word “rising” was used no less than 57 times, almost double the 32 times in March. This is usually in the context of prices or joblessness, indicating that things are getting worse, not better.


  • TELL-TALES
    • Recent NBC News polls showed 62% of Americans saying their incomes cannot keep up with the rising cost of living.
    • FOX News reports that average family is being impacted by approximately $3,000 against their revenue. Other sources are suggesting this number is higher and between $5 & $6,000 per family impact when services and utilities are all factored in.
  • “ACROSS THE BOARD” IMPACT
    • Grocery inflation jumps 10.0% in March vs. the February rate of +8.6%.
    • Cereals and Bakery Products +9.4%, Meats, Poultry, Fish, and Eggs were +13.7%.
    • Dairy and Related Products were +7.0% Fruits and Vegetables were +8.5%.
    • Airfares in March skyrocketed 10.7% and are now at their highest point since the pandemic began.
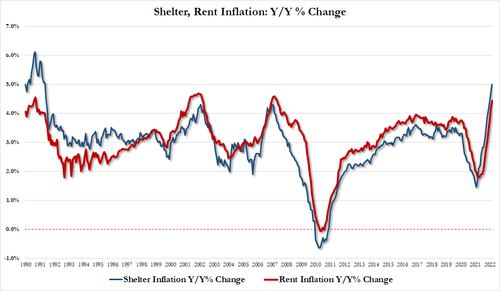
    • Shelter inflation 5.0% Y/Y in March vs 4.7% in Feb, and the highest since May 1991.
    • Rent inflation 4.44% Y/Y in March vs 4.17% in Feb, and the highest since May 2007.
    • The household furnishings and operations index rose 1.0%, the eighth consecutive increase.
    • The index for new vehicles increased 0.2 percent in March after rising 0.3 percent the previous month.
    • The index for communication was also among those few indexes which declined over the month, falling 0.5 percent.
 
 
SLOWING CONSUMPTION GROWTH: INADEQUATE REAL DISPOSABLE INCOME
 
  • US RETAIL SALES
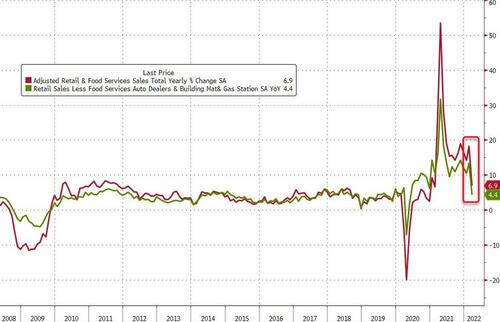
    • The rise in retail sales year-over-year is decelerating dramatically! It was up only 6.9% YoY in March. This was the lowest since Feb 2021.
    • Americans’ credit cards are taking a beating – as was evident in the plunge in the savings rate and the surge in revolving consumer credit to enable them to keep the dream alive and spend beyond their means. That “over-reach” enabled them to increase retail sales spending by an expected 0.5% MoM in March.
 
Both goods and services sales growth slowed dramatically in March.
 
 
  • TELL-TALES
    • The March advance in Retail Sales was led by a 8.9% jump in spending for gasoline. Excluding receipts at gas stations, sales fell 0.3% last month.
    • The ‘Control Group’ which filters to the GDP calculation unexpectedly dropped 0.1% MoM (vs a 0.1% MoM rise expected).
    • Both goods and services sales growth slowed dramatically in March…
 
MORTGAGE BORROWING: AFFORDABIILITY HAS PEAK
 
  • HOME SALES
    • Homebuying demand continued to falter this spring as new listings fell 7% from a year earlier.
    • The average 30-year fixed mortgage rate shot up to 5%.
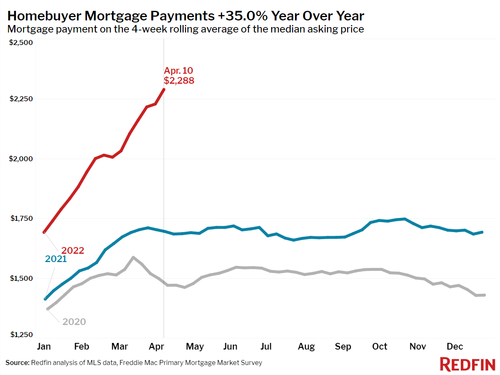
    • The median asking price climbed to $397,747, sending the typical homebuyer’s monthly payment up 35% year over year to an all-time high of $2,288.
    • The median home sale price was up 17% year over year to a record high of $389,178.
    • The median asking price of newly listed homes increased 14% year over year to $397,747.
    • The monthly mortgage payment on the median asking price home rose to a record high of $2,288 at the current 5% mortgage rate. This was up 35% from a year earlier, when mortgage rates were 3.04%.
    • Pending home sales were up 1% year over year, and have rolled over.
    • New listings of homes for sale were down 7% from a year earlier, the 21st-straight annual decline.
    • 58% of homes that went under contract had an accepted offer within the first two weeks on the market, an all-time high. This was up from the 55% rate of a year earlier.
    • Homes that sold were on the market for a median of 18 days, down from 26 days a year earlier.
    • On average, 3.2% of homes for sale each week had a price drop, with 13% dropping their price in the past four weeks. That’s up from 10% a month earlier and 9% a year ago.
    • The share of listings with price drops is climbing faster during this time of year than they have since at least 2015. Typically during this time of year the share of homes with price drops is slightly down month over month. The average sale-to-list price ratio, which measures how close homes are selling to their asking prices, rose to an all-time high of 102.4%. In other words, the average home sold for 2.4% above its asking price. This was up from 100.4% in 2021.
 
 
  • TELL-TALES
    • WELLS FARGO: Mortgage lending activity, plunged by 33% in the quarter on surging mortgage rates. “The Federal Reserve has made it clear that it will take actions necessary to reduce inflation and this will certainly reduce economic growth,” and “the war in Ukraine adds additional risk to the downside.”
    • Fewer people searched for “homes for sale” on Google-searches during the week ending April 9th, down 3% from a year earlier.
    • The seasonally-adjusted Redfin Homebuyer Demand Index—a measure of requests for home tours and other home-buying services from Redfin agents—has declined 3% in the past four weeks, compared to a 5% increase during the same period last year. The index was up 2% from a year earlier.
    • Touring activity from the first week of January through April 10 was 23 percentage points behind the same period in 2021, according to home tour technology company ShowingTime.
    • Mortgage purchase applications were down 6% from a year earlier, while the seasonally-adjusted index increased 1% week over week during the week ending April 8th.
    • For the week ending April 14th, 30-year mortgage rates rose to 5%–the highest level since February 2011. This was up from 4.72% the prior week, and the fastest three-month rise since May 1994.
CORPORATE BORROWING: SUPPLY CHAIN COSTS
 
  • PRODUCER PRICE INDEX (PPI)
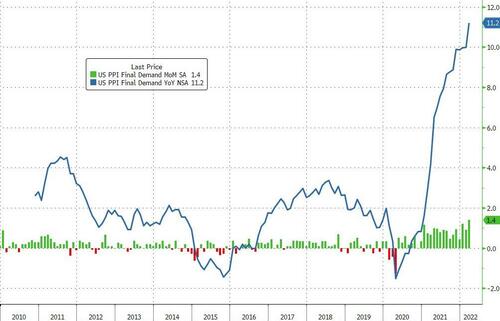
    • PPI rose 1.4% MoM – far higher than the +1.1% MoM expected and up a stunning 11.2% YoY.
    • This is the 23rd straight month of producer price rises. The monthly gain was broad across categories.
    • Core PPI rose 9.2% YoY – a new cycle high – far above the 8.4% jump expected.
    • Margin pressure remains a concern as Producer price acceleration outpaces the ability of companies to raise consumer prices.
  • TELL-TALES
    • The Fed’s Beige Book reports that:
    • Supply chain backlogs, labor market tightness and elevated input costs continued to pose challenges on firms’ abilities to meet demand. Worse, the Beige Book also noted that demand destruction from soaring prices is starting to emerge, and points out that “contacts in a few Districts noted negative sales impacts from rising prices. Firms in most Districts expected inflationary pressures to continue over the coming months.”
    • Several Districts reported “moderate employment gains despite hiring and retention challenges in the labor market.”
    • The Beige Book noted that “some contacts reported early signs that the strong pace of wage growth had begun to slow.” This will surely bolster the “peak inflation” thesis.
    • The highlight is that several districts noted negative sales impacts from rising prices.
CORPORATIONS CAN BE EXPECTED TO HAVE ALREADY STARTED FOCUSING ON OPERATING COST CUTTING TO PROTECT CASH FLOW
 
 
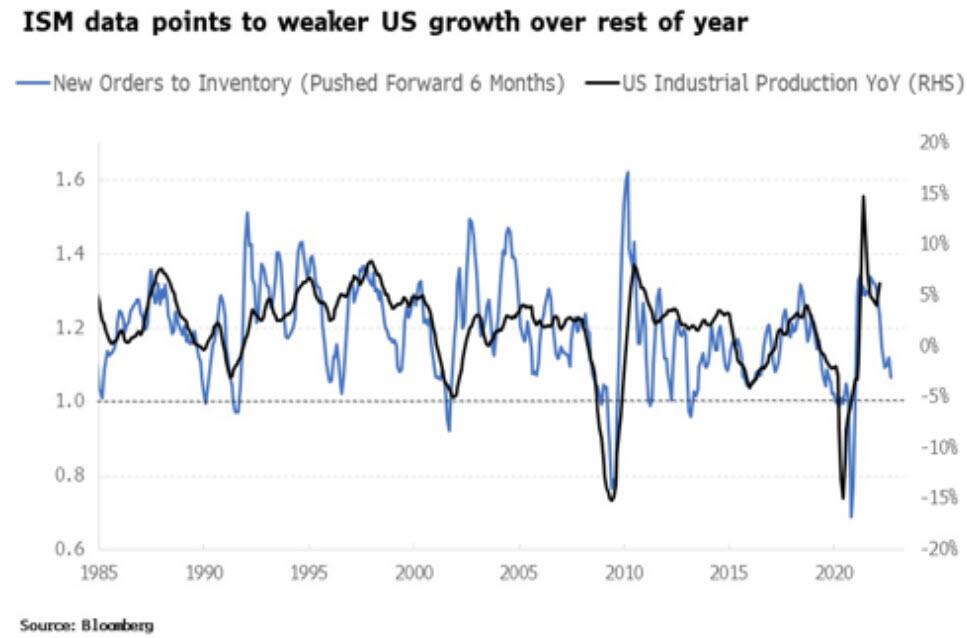
The ratio of the new orders and inventory subcomponents have slipped lower, closer to the critical value of one. This ratio gives a good lead on U.S. industrial production and indicates growth in the U.S. is set to slow quite sharply through the rest of the year.
 
 
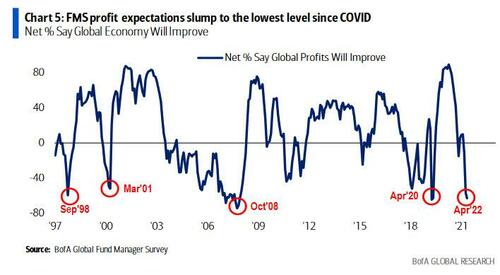
Profit expectations are now the lowest since Covid,(when the global economy shut down and corporate earnings cratered).
 
This also includes previous instances of such low levels like the collapse of LTCM, the bursting of the Dotcom bubble and the Lehman bankruptcy!
 
MARGIN DEBT: INVESTOR LEVERAGE
 
MARGIN DEBT
 
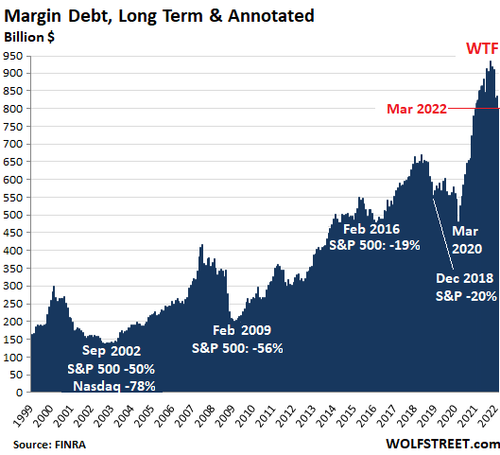
  • The S&P 500 peaked on January 3, followed by a sharp sell-off and has since declined 8.8%. In the month of January, margin debt dropped by $80 billion, or 8.8%, the largest dollar-drop ever, and one of the largest percentage-drops ever.
The percentage-drops that had been higher were:
    • Covid crash (March 2020: -12.1%);
    • Euro Debt Crisis (August 2011: -10.4%);
    • Financial Crisis (May 2010: -9.1%, November 2008: -18.1%, October 2008: -19.7%, August 2007: -13.0%);
    • Dotcom crash (March 2001: -12.1%; December 2000: -11.6%; April 2000: -10.4%).
CHART ABOVE
  • It’s not the absolute dollar amounts that matter over the decades, because they’re skewed by the effects of inflation. What matters are the steep increases in margin debt before the selloffs, and the steep declines during the sell-offs that followed.
  • But no increase in margin debt was more breath-taking than the huge surge during the Fed’s $4.8 trillion money-printing binge in 2020 and 2021, neither in dollars nor in percentages, and this has now started to unwind.
 
CONCLUSION
 
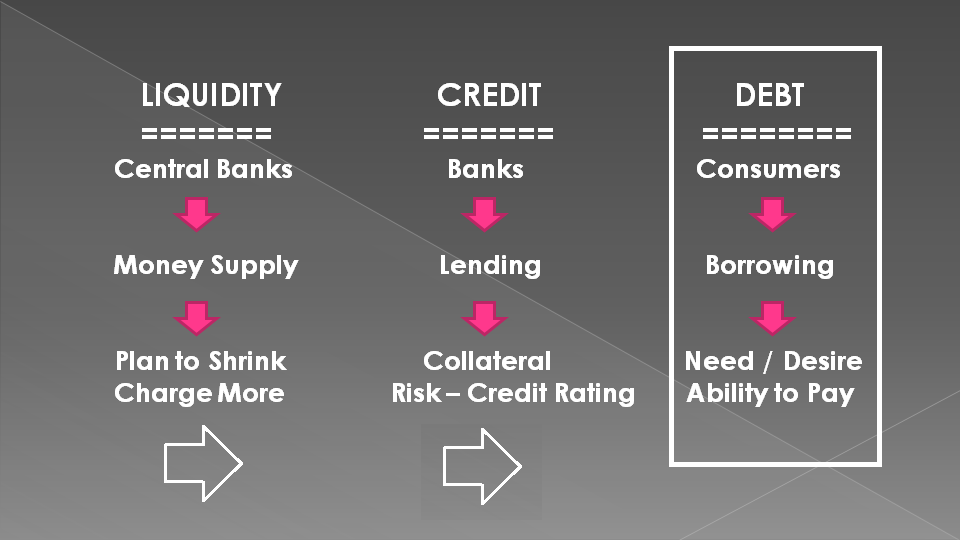
Liquidity is shrinking as the central banks implement Quantitative Tightening (QT) and raise rates to fight inflation.
 
Credit is tightening as banks increase loan loss reserves and tighten lending standards.
 
Debt growth is slowing as rising interest rates take a toll on the ability of borrowers to increase their existing debt loads. Additionally, shrinking real disposable income further aggravates the problem.
 
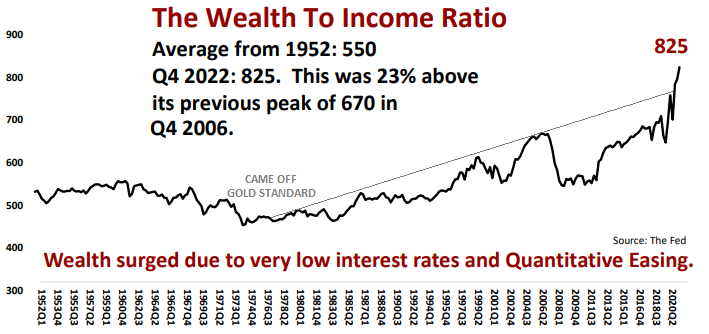
There is little double we have a stalled Wealth Effect which has sustained economic growth over the last decade via Quantitative Easing and ZIRP (Zero Interest Rate Policy).
 

FOLLOWING DETAILED ANALYSIS IS SUBSCRIBER CONTENT ONLY

Subscribe to view full post content with supporting live charts
 

FAIR USE NOTICE  This site contains copyrighted material the use of which has not always been specifically authorized by the copyright owner. We are making such material available in our efforts to advance understanding of environmental, political, human rights, economic, democracy, scientific, and social justice issues, etc. We believe this constitutes a ‘fair use’ of any such copyrighted material as provided for in section 107 of the US Copyright Law. In accordance with Title 17 U.S.C. Section 107, the material on this site is distributed without profit to those who have expressed a prior interest in receiving the included information for research and educational purposes.  If you wish to use copyrighted material from this site for purposes of your own that go beyond ‘fair use’, you must obtain permission from the copyright owner.


NOTICE  Information on these pages contains forward-looking statements that involve risks and uncertainties. Markets and instruments profiled on this page are for informational purposes only and should not in any way come across as a recommendation to buy or sell in these assets. You should do your own thorough research before making any investment decisions. MATASII.com does not in any way guarantee that this information is free from mistakes, errors, or material misstatements. It also does not guarantee that this information is of a timely nature. Investing in Open Markets involves a great deal of risk, including the loss of all or a portion of your investment, as well as emotional distress. All risks, losses and costs associated with investing, including total loss of principal, are your responsibility.