tipping points
BOND MARKET
PREPARATIONS FOR THE POST DEBT CEILING MARKET
The current Debt Ceiling wrangling will soon be resolved with the result being (as always) a dramatic increase in the debt ceiling. The establishment of a US debt ceiling has long been meaningless other than to mislead the uninformed public into believing there is any fiscal responsibility of tax payer money in Washington. It should be viewed as nothing more than a grand charade.
What is not a charade is the fall-out from this deceptive ritual. Massive amounts of new treasury debt and exisiting rolling over debt must now be sold to foreigners at higher costs to the naive and overly trusting taxpayer.
Until Unemployment surges and the US is clearly in the throws of a recession the Fed will not “pivot” on reducing the Fed Funds Rates. It will keep Fed Funds at elevated levels as long as possible. However, when it does finally reverse, it must be remembered that the Federal Reserve only controls short term rates. Longer Rates are controlled by the markets and more than ever by foreign investors! These investors will demand continued higher yields to purchase US debt. We explain the four reasons why in this week’s newsletter.
Eventually, the US will be forced to try to bring down long term rates through Yield Curve Control (YCC) and sacrificing the US dollar. However, those days are still well in the future, because presently the problems around the world are worse than those in the US. Also remember the 2008 financial crisis happened over a year after the Fed stopped raising interest rates. In fact, it was already cutting rates when the Great Recession kicked off. There is always a lag between changes in policy and the impacts of those changes. Since the Fed has pushed rates to up over 5% and nothing bad has happened, (if you consider three major bank failures nothing), people seem to believe that nothing bad is ever going to happen. History tells us otherwise.
WHAT YOU NEED TO KNOW
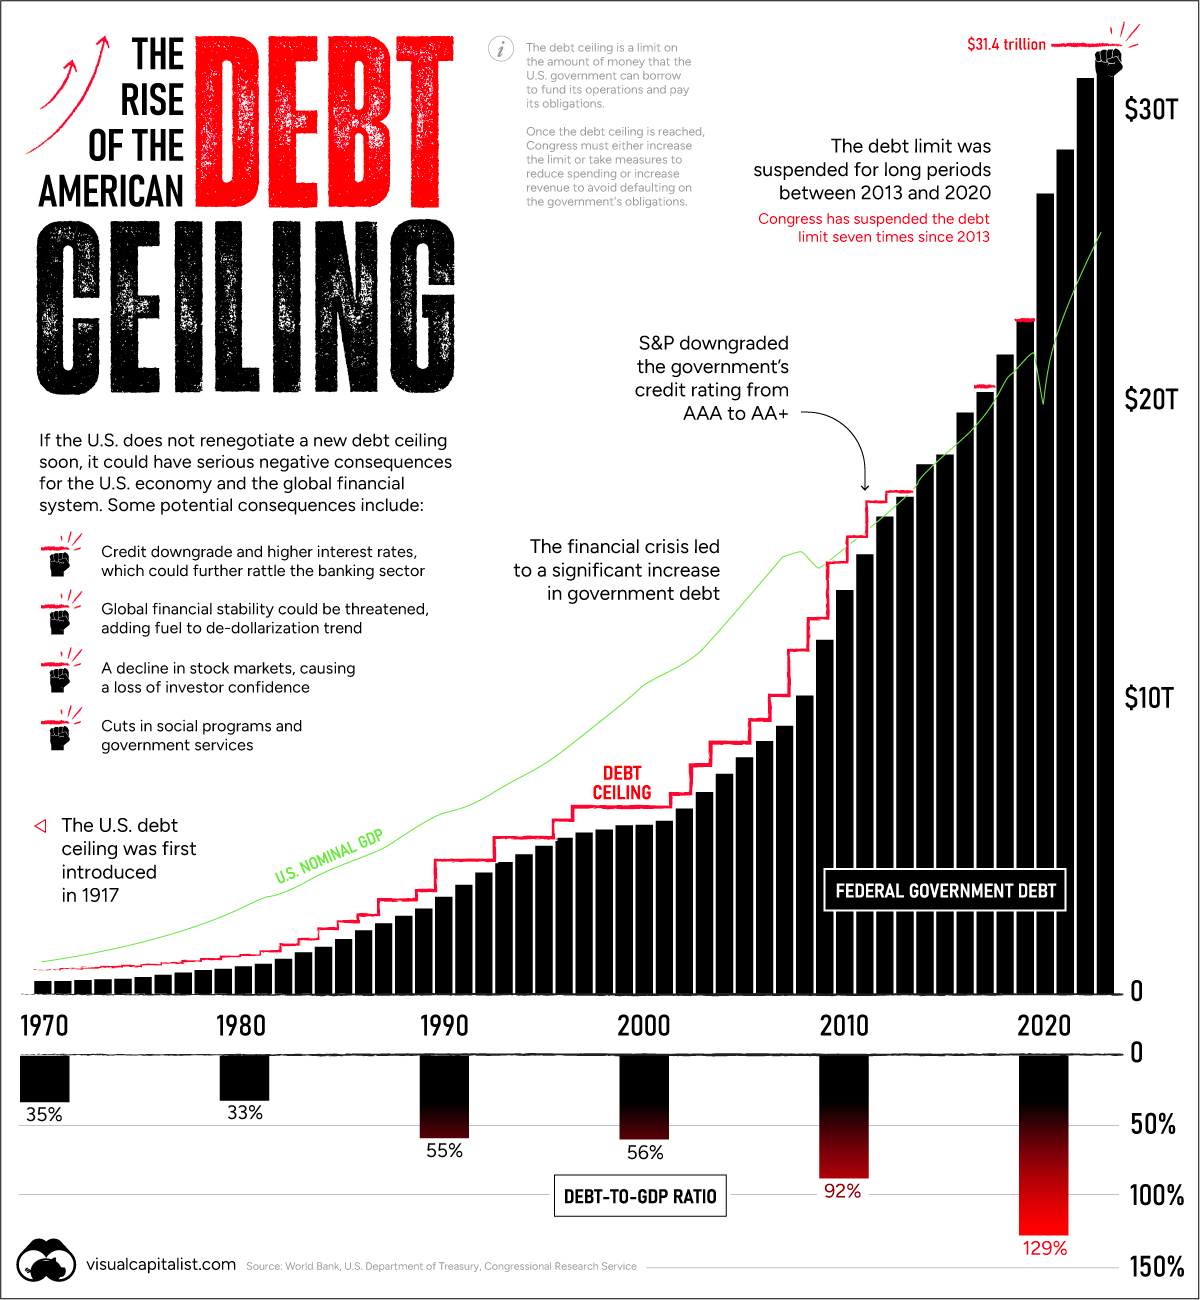 It appears that over the weekend a tentative agreement “in principle” has been reached. However, getting aproval of the changes made to the bill already approved by congress may be problematic. The Republican Freedom Caucus may not go along with the proposal.
Don’t pay much attention to the wrangling, rather watch closely next week what the foreign “Bond Vigilante’s” will dictate to the US debt bond market, since they are going to be asked to finance this debacle. How much “vig” will they demand?
NOTE: The US Treasury’s latest 21-day cash management bill – which is non-benchmark issue – drew a 6.2% rate yesterday, the highest rate in over two decades.
POST DEBT CEILING: Four Reasons Longer Term Treasury Yields to Remain Elevated
-
- SHORT TERM RATES – The Federal Reserve “Pivot” will soon lower the Fed Funds Rate.
- LONG TERM RATES – Will remain higher because the market controls them – Not the Fed.
-
- US Treasury Replenishment of the Treasury General Account (TGA)
- Re-Pricing of Risk in Post Great Moderation Era – Globalization, Financialization & 3 Mercantilism – (Risk Premia)
- Slowing Global Economy & De-Dollarization Pressures on FX Reserves
- Concerrns With a US Debt Rating Downgrade – Currently seeing historic Credit Default Swap (CDS) Levels
1- THE TREASURY GENERAL ACCOUNT – The Replenishment Surge
-
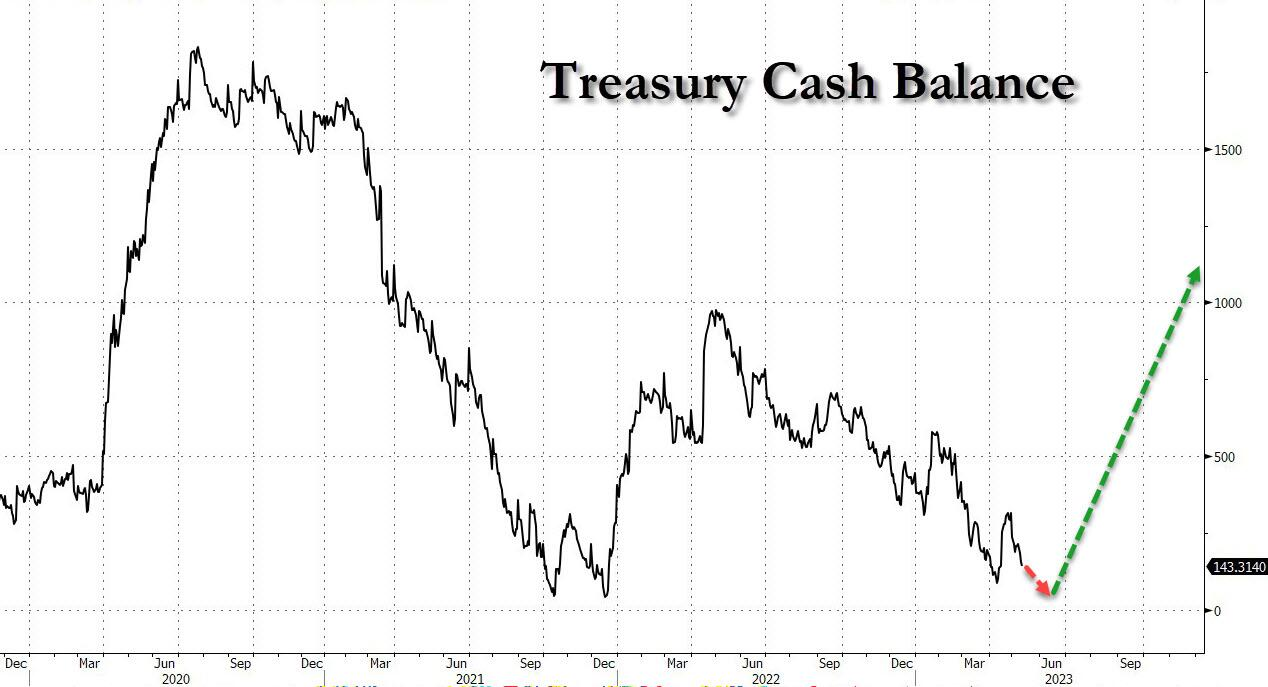
- The Treasury has recently been trying to hold $500 billion in its General Account at the Fed. If that balance gets close to zero, the Treasury will have to turn around and issue at least $500 billion in bills to replenish it, and as much as much as $1.2 trillion in the second half of the year after the debt limit is raised. Normally, when the supply of bills increases quickly, their yield also rises.
- INCREASED TREASURY ISSUANCE MEANS LOWER PRICES PAID AND HIGHER YIELDS REQUIRED.
2- REPRICING OF RISK – Higher Risk Premia
-
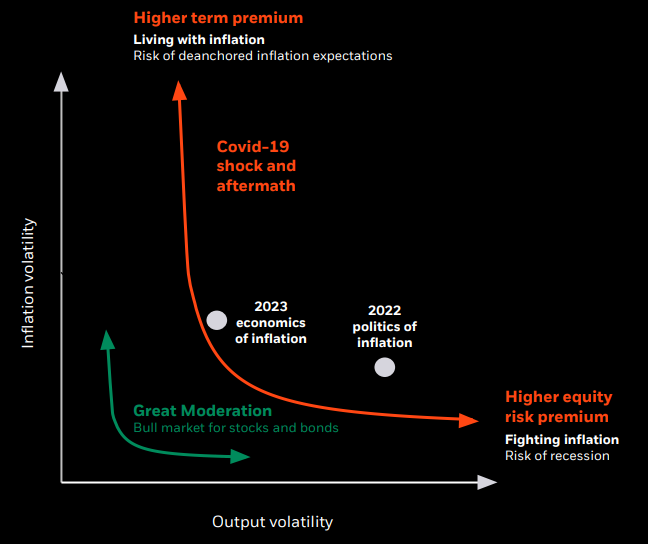
- The Re-Pricing of Risk in the form of rising Bond Risk Premia is occurring in the Post Great Moderation Era.
- This is a direct result of slowing and possible reversing in the three great drivers of the Great Moderation Era: i – Globalization, ii – Financialization & iii – Mercantilism.
- A HIGHER RISK PREMIA REQUIRES HIGHER BOND YIELDS.
3- SLOWING RATE OF GLOBAL FX RESERVES – Slowing Global Economy & US Recession
-
- We haven’t had real rates of the 10Y UST at current levels of 1.57 since the 2008 GFC.
- Because of the amount of US debt needing to be sold, it will be in the interest of the Fed and US Treasury to keep the longer term rates as high as possible and as long as possible to keep buyers absorbing the massive amounts of new debt issuances.
- The Federal Reserve only controls short term rates. Today Foreign buying controls Long Rates dictated by i – real rates, ii – Liquidity and iii – Safety of the currency’s value.
- A HIGHER REAL RATE WILL MAKE US DEBT MORE VALUABLE TO FOREIGN BUYERS. FOREIGN BUYING REQUIRES US DOLLARS ADDING TO US DOLLAR STRENGTH.
4- US CREDIT DOWNGRADE WORRIES – “On Watch” or Downgraded!
-
- FITCH: Fitch Places United States’ AAA Rating On Watch Negative, Blames “Political Partisanship”.
- MOODY’S: On June 15, the Treasury Department is due for about $2 billion in interest payments. “That’s a really important date for us. While the interest payment is relatively small, if it was missed, that’s a default. We’d downgrade the rating by one notch from AAA to AA1,” according to William Foster, a senior vice president at Moody’s on Wednesday.
- CCXI: Chinese Rating Agency Downgraded US To AA+ Citing High Inflation and the Debt Ceiling.
- LOWER CREDIT RATING PRESSURES WILL MAKE US DEBT LESS VALUABLE AND YIELDS REQUIRED TO FINANCE IT HIGHER.
CONCLUSION
 BANKRUPTCIES – Continue to Heat Up!
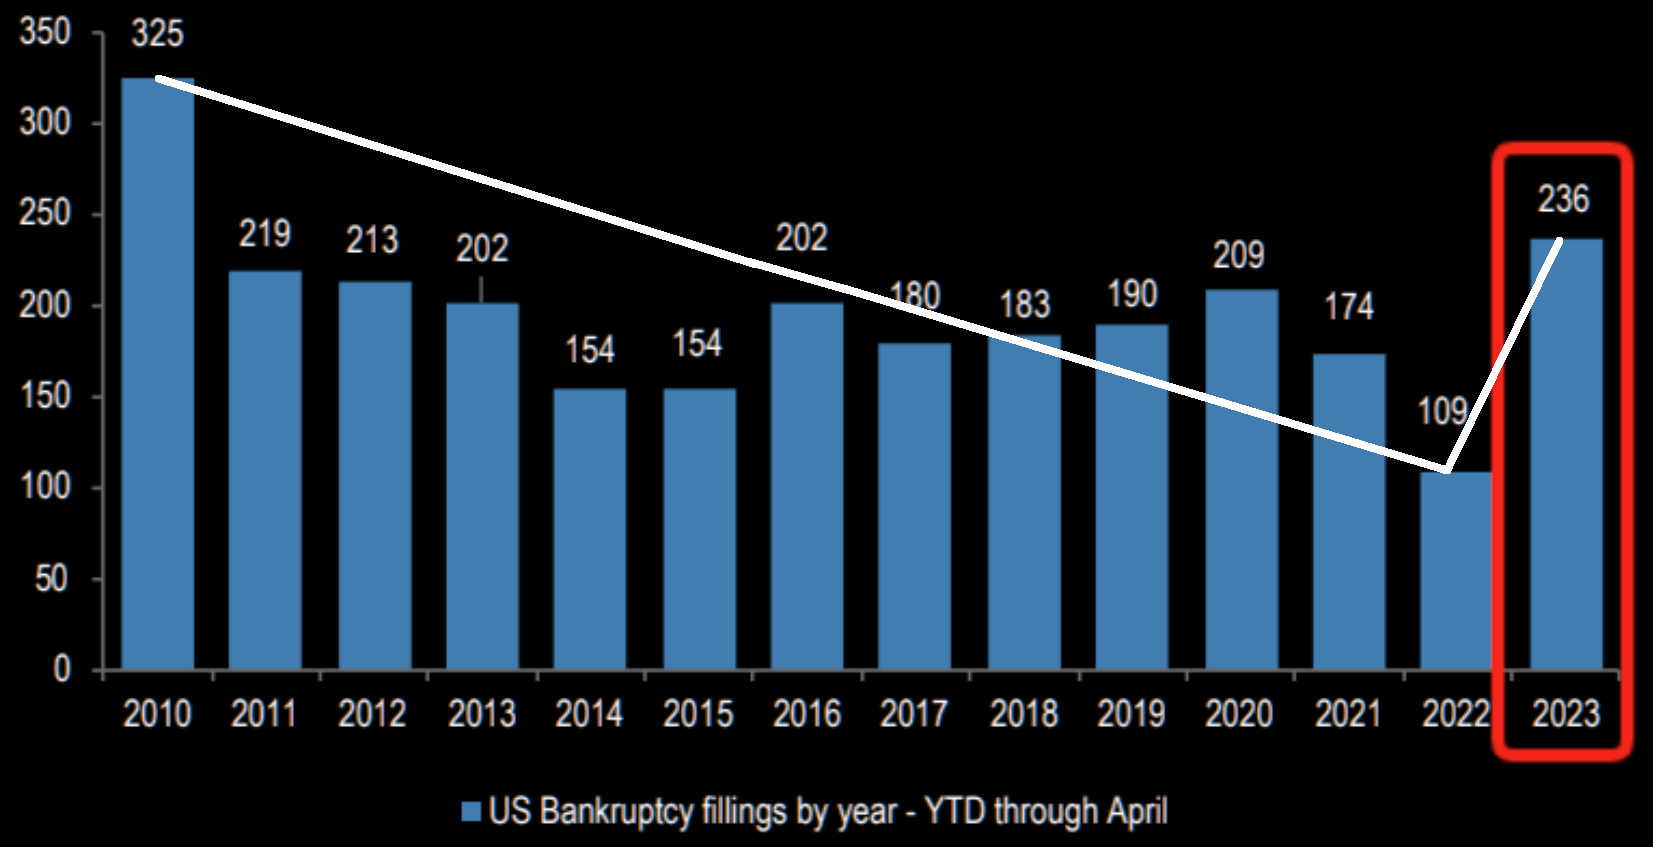
Last week we highlighted 7 specific bankruptcies that occurred in a 48 hour period, suggesting that the area is beginning to heat up. This week we see further developments as the bankruptcy crisis sweeping the US now sees filings for bankruptcy at the fastest pace in 13 years.
-
- The past week saw eight companies with more than $500 million in liabilities file for Chapter 11 bankruptcy, including five in a single 24-hour stretch last week, making this the busiest week for chapter 11 filings so far this year. In 2022 the monthly average was just over three filings.
- S&P Global forecasts that the 12-month trailing default rate for speculative-grade securities will jump from the current 2.5% to 4.5% by early 2024.
- According to the Becker Hospital Review there are now 646 hospitals at risk of closure. The details can be found HERE .
1- THE TREASURY GENERAL ACCOUNT – The Replenishment Surge
 INCREASED TREASURY ISSUANCE MEANS LOWER PRICES PAID AND HIGHER YIELDS REQUIRED
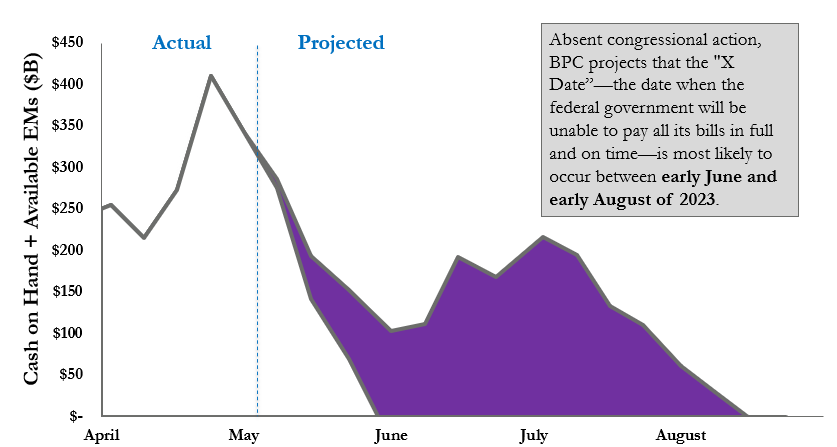
The Treasury has recently been trying to hold $500 billion in its General Account at the Fed. If that balance gets close to zero, the Treasury will have to turn around and issue at least $500 billion in bills to replenish it, and as much as much as $1.2 trillion in the second half of the year after the debt limit is raised. Normally, when the supply of bills increases quickly, their yield also rises.
CHART: ABOVE RIGHT: Absent congressional action, BPC projects that the “X Date” – the date when the Federal Government will be unable to pay all its bills IN FULL and ON-TIME – is likely to occur between early June and early August 2023.
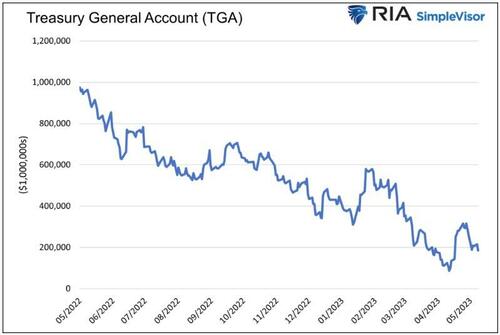 Since January, when the Treasury debt outstanding hit $31.4 trillion, the Treasury ceased adding additional debt. Instead, they have used their “checking account” held at the Fed to fund the nation. The formal name for the account is the Treasury General Account (TGA). The graph to the right shows the steady decline in the TGA. It is expected to hit zero by June 8, 2023.
CHART BELOW: Treasury will increase cash balances significantly very quickly. Dumping this much new Treasury debt on the market, PLUS ongoing rollovers at much higher rates, normally drives Treasury prices down and yields up!
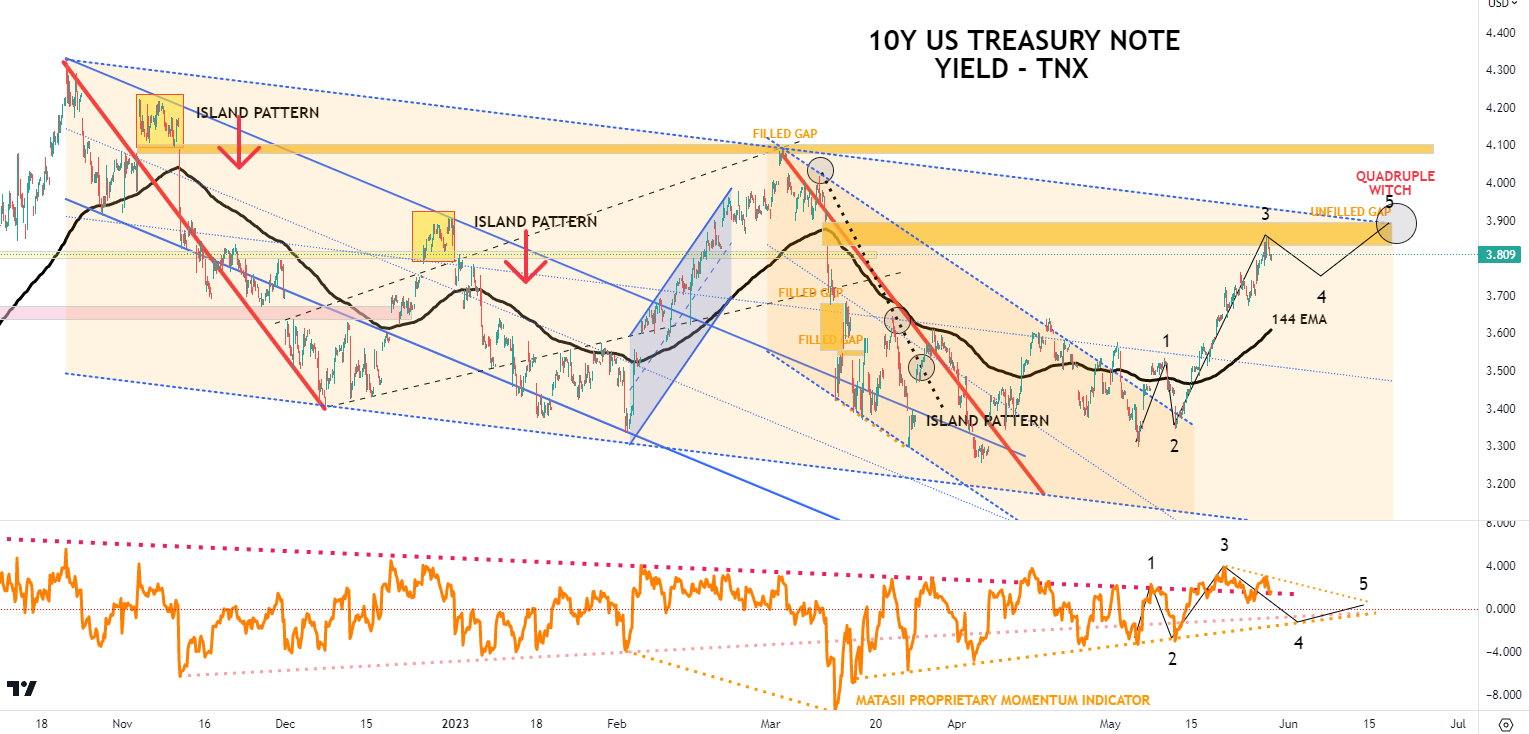
The market is already pricing in rising intermediate term yields, as we witness (below) a major surge in the 10Y UST yield.
2- REPRICING OF RISK – Higher Risk Premia
 A HIGHER RISK PREMIA REQUIRES HIGHER BOND YIELDS
THE GREAT MODERATION
Re-Pricing of Risk in Post Great Moderation Era – Globalization, Financialization & Mercantilism
1- GLOBALIZATION – Has lowered Product Costs
The development of global supply chains over the last 40 years to take advantage of labor arbitrage has resulted in cost savings and controlling cost-price push.
2- FINANCIALIZATION – Has Lowered Lending Rates
The explosion in investment vehicles, cross border rate arbitrage, the ability of capital to flow easily and central bank easy money policies has resulted is steadily falling interest rates for nearly 40 years. This has reduced lending rates and increased credit availability.
3- MERCANTILISM – Has Increased / Maintained US Consumption
The practice of first Japan and then China to return the surplus trade balances to the US in the form of purchases of US Treasuries has kept US Rates low and the Dollar strong. This process has resulted in US Consumers having the “luring” facility to buy more imported foreign goods. The US economy as a result grew to become a 70% consumption economy while consuming more than it produced.
THE THREE AREAS ABOVE HAVE SLOWED OR BEGAN REVERSING – THE ERA OF THE GREAT MODERATION HAS REVERSED.
BOND DURATION RISK PREMIA
Higher bond yields are an increasingly likely prospect as rising inflation expectations push bond holders to demand an extra premium to lend money. It’s been a testament to the Fed’s inflation-fighting credibility that – despite almost double-digit CPI – bond yields have not risen even more. The central bank’s own two-year forecast for PCE inflation never got above 3%, and based on the behavior of term premium – the extra yield bond holders demand above what is implied by long-run rate expectations – the market has taken the Fed at its word. Since bond yields bottomed in August 2020, virtually the entire rise has been accounted for by expectations of Fed rate increases.
CHART ABOVE RIGHT: Risk has been increasingly mispriced for over a decade. It is our expectations that Risk will increasingly be priced higher over the following decade.
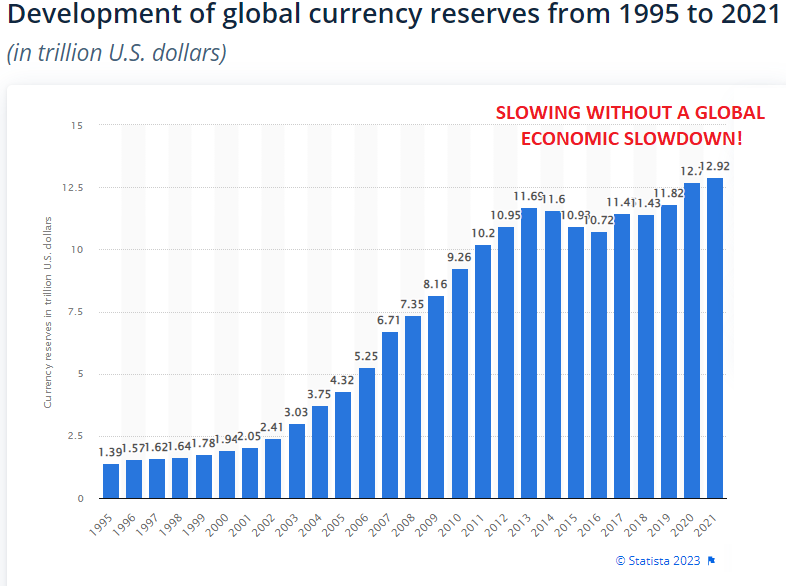
3- SLOWING RATE OF GLOBAL FX RESERVES – Slowing Global Economy &US Recession
A HIGHER REAL RATE WILL MAKE US DEBT MORE VALUABLE TO FOREIGN BUYERS. FOREIGN BUYING REQUIRES US DOLLARS ADDING TO US DOLLAR STRENGTH.
The significant rise in REAL Rates is presently receiving little coverage in the business media. As the chart below shows, we haven’t had real rates of the 10Y UST at current levels of 1.57 since the 2008 GFC. The trend had between down, hitting lows of -1.0–1.2% last fall. The rise has been abrupt as the Federal Reserve hiked rates to fight inflation. The bi-product has been that it has made US Treasury debt more attractive to foreigners.
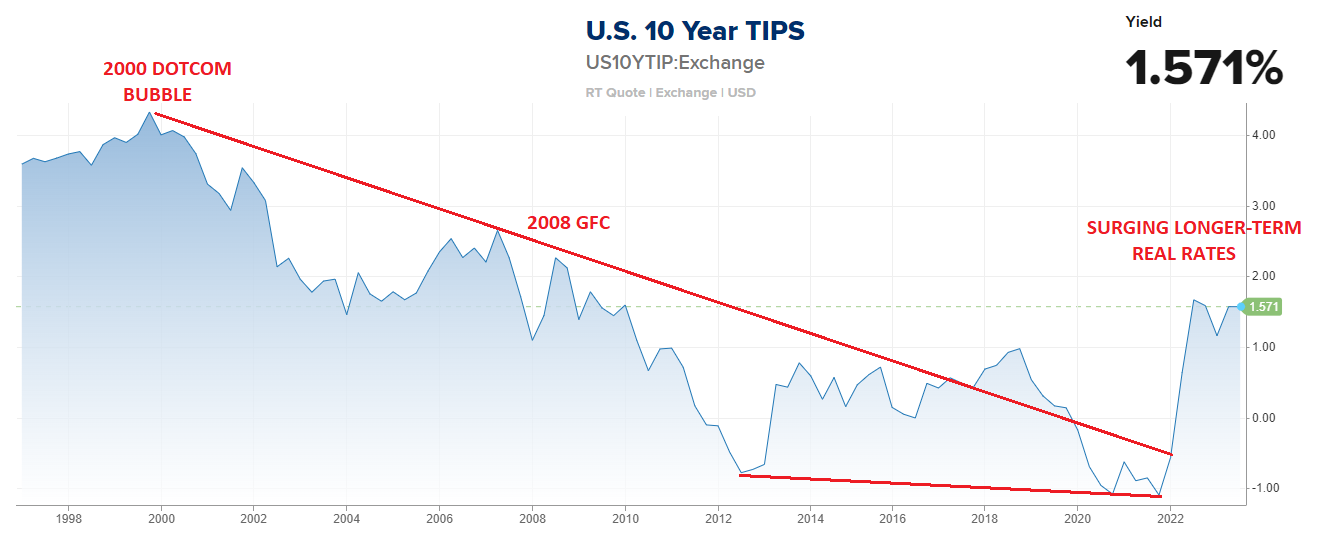
When rates are rising, making yields more attractive to buyers, it is however not the right time to buy because the value of the bonds purchased falls. For shorter term buyers this is problematic. However, when rates peak, this becomes the optimum time to buy.
We expect this to soon develop. Because of the amount of US debt needing to be sold, it will be in the interest of the Fed and US Treasury to keep the longer term rates as high as possible and as long as possible to keep buyers absorbing the massive amounts of new debt issuances.
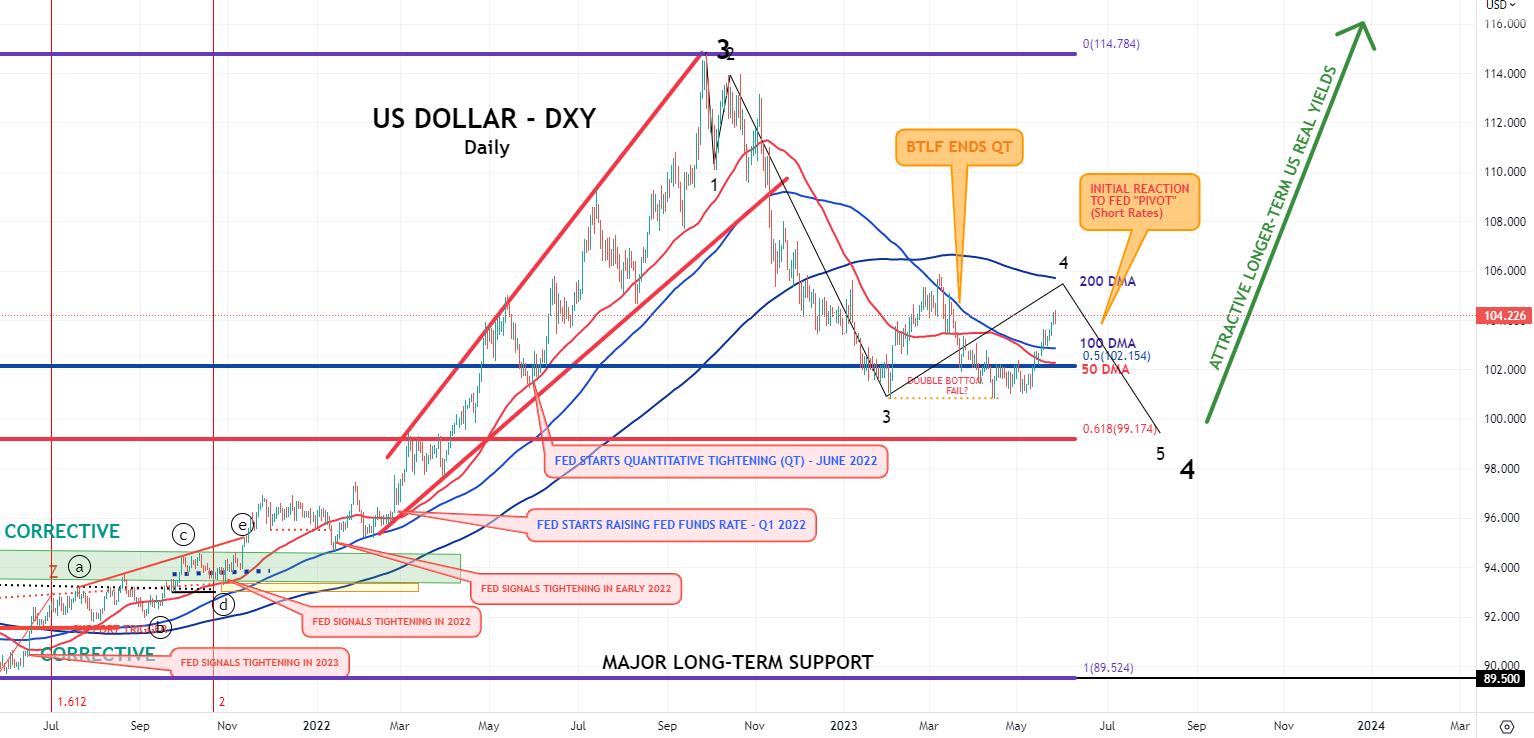
 Strong buying of US Treasuries normally keeps the US dollar strong.
CHART RIGHT
It is expected that high real rates and a stong US$ will mean foreigners will increasingly want to hold their slowing FX reserves in a better paying REAL yield sovereign debt. This is likely to be the UST, which will make US$ holdings more attractive, thereby putting potentially sustainable upward pressure on the US Dollar while other developed economies’ currencies come under pressure.
4- US CREDIT DOWNGRADE WORRIES – “On Watch” or Worse!
 LOWER CREDIT RATING PRESSURES WILL MAKE US DEBT LESS VALUABLE AND YIELDS REQUIRED TO FINANCE IT HIGHER
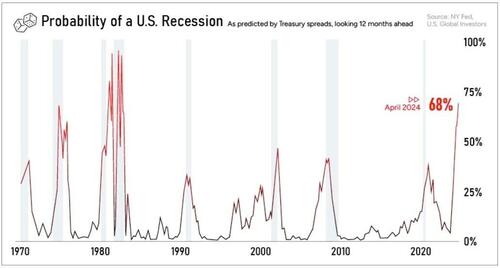
Credit Agencies see problems ahead for US debt. US Recession indicators (chart right) and the US LEI (chart below) are worrying signals for the US debt with significantly rising levels and rates required to finance it.
- FITCH: Fitch Places United States’ AAA Rating On Watch Negative, Blames “Political Partisanship”.
- MOODY’S: On June 15, the Treasury Department is due for about $2 billion in interest payments. “That’s a really important date for us. While the interest payment is relatively small, if it was missed, that’s a default. We’d downgrade the rating by one notch from AAA to AA1,” according to William Foster, a senior vice president at Moody’s on Wednesday.
- CCXI: Chinese Rating Agency Downgraded US To AA+ Citing High Inflation and the Debt Ceiling
FITCH
-
- On Wednesday, Fitch put the US on notice for a possible credit downgrade, pointing to the debt-level “brinkmanship” in political negotiations to raise the debt ceiling.
MOODY
-
- On Thursday, Moody’s said that a mid-June payment of interest on Treasuries will be critical for maintaining the top, AAA grade. On June 15, the Treasury Department is due for about $2 billion in interest payments. Treasury Secretary Janet Yellen warned Sunday on NBC that “the odds of reaching June 15th, while being able to pay all of our bills, is quite low”, if Congress doesn’t raise the debt limit.
- Foster emphasized that Moody’s does anticipate that Congress and the White House will strike a deal to raise or suspend the debt limit before the Treasury exhausts its special accounting measures to keep within the ceiling. Yellen has advised the Treasury risks running out of cash as soon as June 1.
- The AAA rating at Moody’s wouldn’t be restored unless Congress overhauled the current debt-limit legislation, according to Moody’s.
- “At that point, the debt limit is no longer a frustration of fiscal policymaking that leads to brinksmanship – it resulted in a default,” Foster said. “And we’d need to reflect that permanently in the rating. To bring it back to AAA, there would have to be significant reform of the debt-limit rule so that it’s no longer a material risk to default” going forward — or axing the rule, he said.
- For Moody’s, the key issue is whether the Treasury — if it does go past the so-called X-date when it runs out of sufficient cash — keeps up with its servicing of Treasury securities.
- “We consider a default to be a missed interest or principal payment,” Foster said. After a downgrade following any June 15 failure to pay interest, the firm “would keep the rating under review for further downgrade until the default is cured.”
 CCXI
CCXI
-
- China’s leading rating agency, China Chengxin International Credit Rating (CCXI) decided not to wait, and on Friday downgraded the US’ rating by one notch, to AA+ from AAA, citing high inflation and the widely watched debt-ceiling stand-off.
- “The intensification of political divisions between the two parties in the United States has increased the difficulty of resolving the debt-ceiling issue,” CCXI said in an online statement. It added that the political wrangling was likely to result in a delayed payment by the so-called X-date – the day the US government says it can no longer fulfill all its financial obligations. Apparently it was unaware that spineless GOP leadership was only pretending it is seeking a compromise and instead spending will be “cut” by a laughable 0.2% of GDP at most, at which point everyone will call it a day and pat themselves on the back.
“Deterioration in fiscal strength and frequent breaches of the debt ceiling continue to erode the credit base of the US dollar,” it added, according to SCMP.
-
- A downgrade by a Chinese agency is symbolic and while it may represent worries among Chinese market players, it will not have a substantial impact on US borrowing costs.
- This is the first time a Chinese institution has explicitly expressed worries on the US debt issues, but there has been no official response from Beijing, which slashed its holding of US Treasury bills by a total of US$143.9 billion, or 14.2%, in the past year up to March.
- CCXI, which placed the rating on review for a further downgrade, said the US debt sustainability is being challenged by its highest level of debt among the previously AAA rated countries, with debt being compounded by the US Federal Reserve’s continued interest rate hikes.
- The collapse of Silicon Valley Bank in March further added to the challenges facing the Fed’s policy path while increasing economic volatility, CCXI added.
CONCLUSION
 Further weakness in the US economy due to increasing bankruptcies and layoffs only worsens or strengthens the four factors outlined above, which together suggest the possibility of longer term yields remain elevated though short Term Fed controlled rates are expected to fall.
BANKRUPTCIES – Continues to Heat Up!
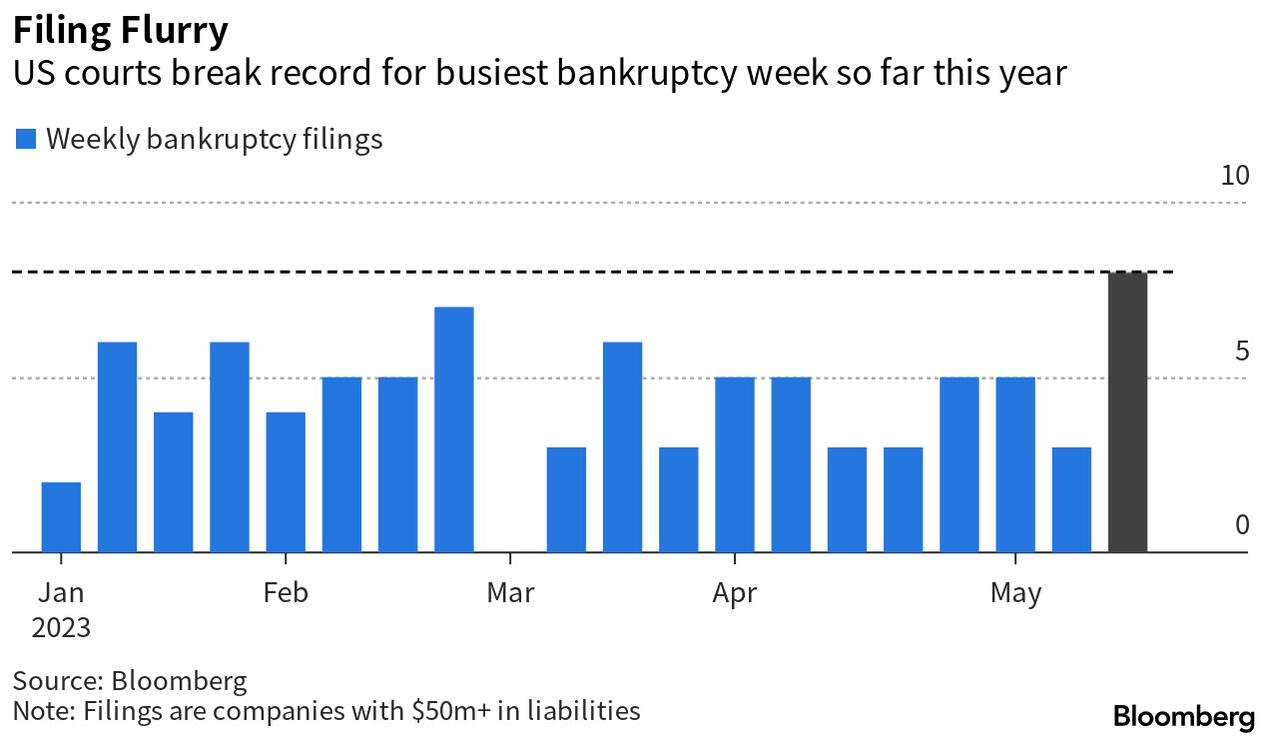
Last week we highlighted 7 specific bankruptcies that occurred in a 48 hour period, suggesting that the area is beginning to heat up. This week we see further developments as the bankruptcy crisis sweeping the US now sees filings for bankruptcy at the fastest pace in 13 years, in a clear sign of a tightening credit squeeze as interest rates rise and financial markets have locked out all but the strongest borrowers. The increase is most visible among large companies, where there were 236 bankruptcy filings in the first four months of this year, more than double 2022 levels, and the fastest YTD pace since 2010, according to S&P Global Market Intelligence.
The past week saw eight companies with more than $500 million in liabilities file for Chapter 11 bankruptcy, including five in a single 24-hour stretch last week, making this the busiest week for chapter 11 filings so far this year. In 2022 the monthly average was just over three filings.
Last week’s eight large filings, those with at least $50 million of liabilities, included those of now defunct woke “media empire” Vice Media, Envision Healthcare and Monitronics International. Prior to last week, the busiest seven-day stretch this year belonged to a week in late February that saw firms, including Covid-19 testmaker Lucira Health, generic drugmaker Akorn and former SPAC Starry Group, kick off insolvency proceedings.
-
- In total, twenty-seven large debtors have filed for bankruptcy so far in 2023, compared to 40 for all of 2022, according to figures compiled by bankruptcydata.com,
- There were about 16,200 bankruptcy filings among all types of companies in U.S. District Courts in the first quarter — up from 12,200 a year earlier, but still well below the 21,000-or-more-a-quarter in the pre-pandemic period, data from Moody’s Analytics shows. Even those pre-pandemic numbers were relatively low in historic terms, in part because low interest rates made it easy for companies to borrow.
- S&P Global forecasts that the 12-month trailing default rate for speculative-grade securities will jump from the current 2.5% to 4.5% by early 2024.
- Companies that sell nonessential consumer items have been harder hit than other sectors, as Americans curb their spending amid high inflation, S&P said Plant-Based Pizza Boston, catalogue retailer AmeriMark Interactive and the Party City retail chain are among the recent casualties.
- Last month, the dress retailer David’s Bridal filed for bankruptcy for the second time in 5 years, and said it was seeking a buyer, days after informing state labor departments that it planned to lay off more than 9,000 employees nationwide. The 70-year-old company said its business was weighed down by “the post-covid environment and uncertain economic conditions.”
HOSPITALS IN TROUBLE
According to the Becker Hospital Review, there are now 646 hospitals at risk of closure. The details can be found HERE .
EXTREME NARROW BREADTH ALWAYS A MAJOR WARNING!
WHEN THE SOLDIERS DON’T FOLLOW THE GENERALS – The War is Soon Lost!
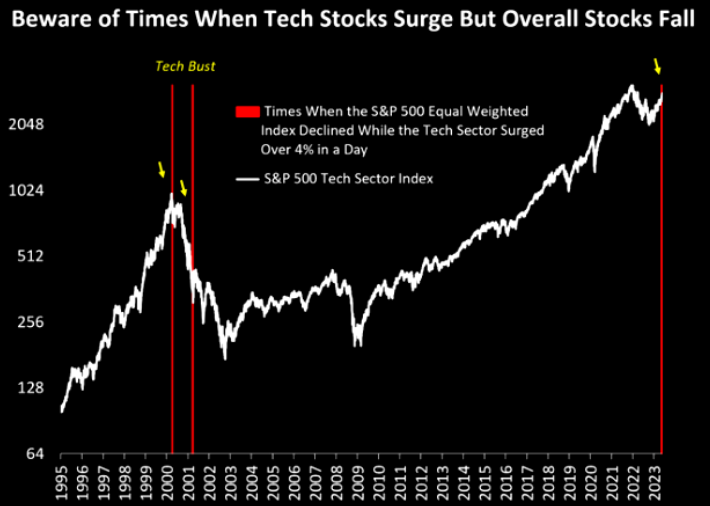 America’s Magnificent Seven stocks up 70% YTD (equal-weighted), the other 493 stocks in S&P 500 up only 0.1%!!
The only other times when the tech sector surged over 4% while overall stocks declined were at the onset and in the middle of the Tech Bust – April 2000 and March 2001.
LARGEST SINGLE DAY MARKET CAP GAINS IN US STOCK MARKET HISTORY
-
- Apple Nov 2022 $191B,
- Amazon Feb 2022 $184B,
- Nvidia Today $179B,
- Apple Jan 2022 $150B,
- Microsoft Mar 2020 $144B,
- Tesla Jan 2022
 10 YEAR RETURNS
-
- Nvidia: +10,519%
- AMD: +4,342%
- Tesla: +2,756%
- Netflix: +1,010%
- Meta: +985%
- Apple: +984%
- Microsoft: +846%
- Adobe: +816%
- Amazon: +779%
- Alphabet: +467%
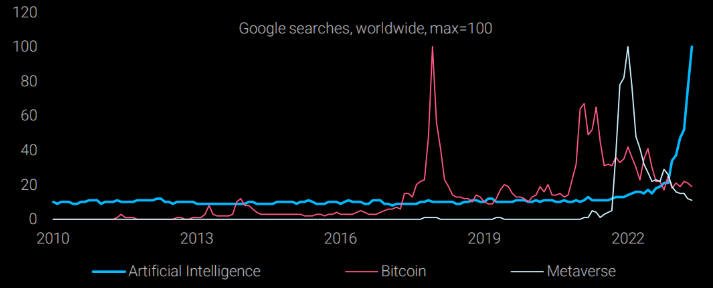
Riding big themes is an art. Most tend to get involved at a late stage. Recall the quote from one of the world’s best traders, Druckenmiller and his late dot.com era trade:
“I bought $6 billion worth of tech stocks, and in six weeks I had lost $3 billion in that one play. You asked me what I learned. I didn’t learn anything. I already knew that I wasn’t supposed to do that. I was just an emotional basketcase and I couldn’t help myself. So maybe I learned not to do it again, but I already knew that.”
CHART BELOW
WILDEST SINCE 1999
The 3-month performance spread between the S&P 500 and the S&P 500 Equalweight is the widest it has been since December 1999.
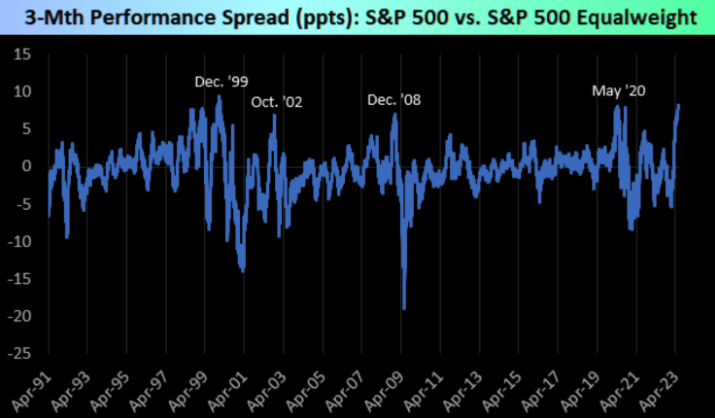
CHART BELOW
LOWEST SINCE 2000
Lowest number of S&P 500 stocks beating the “market” (SPY) since March 2000.
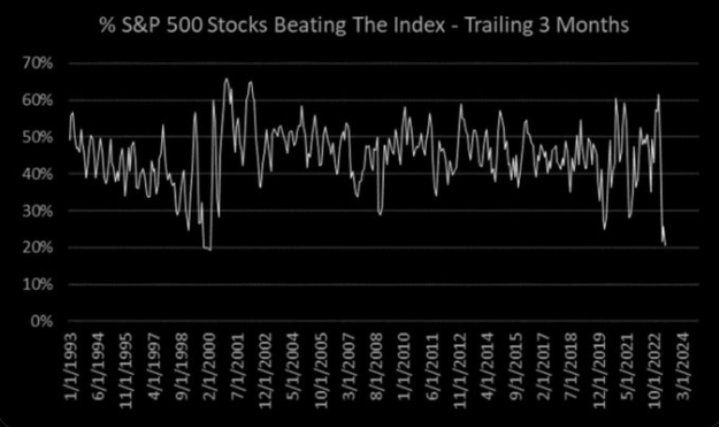
CHART BELOW
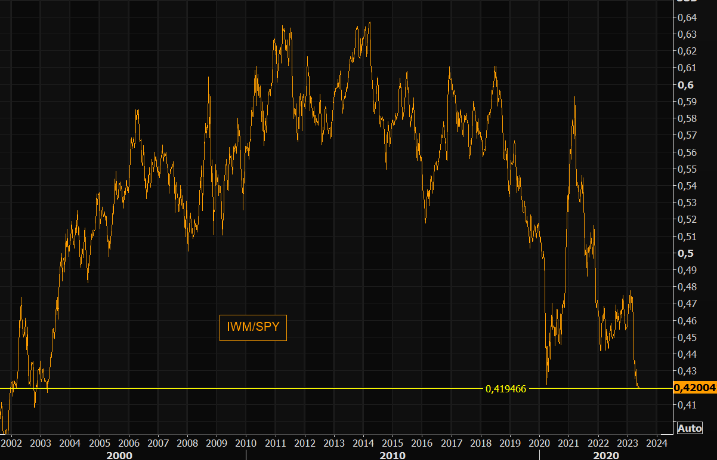
LOWER THAN 2000
The IWM is the ticker symbol for iShares Russell 2000 ETF, which is one of the main ETFs that track the Russell 2000 index. The SPY is an exchange-traded fund that owns all the stocks in the Standard & Poor’s 500 index. The S&P 500 is arguably the most important market measure used by investors and traders around the world — as it’s the benchmark for trillions in dollars of investment.
The IWM/SPY ratio is now at levels not seen since the Dotcom crash era!
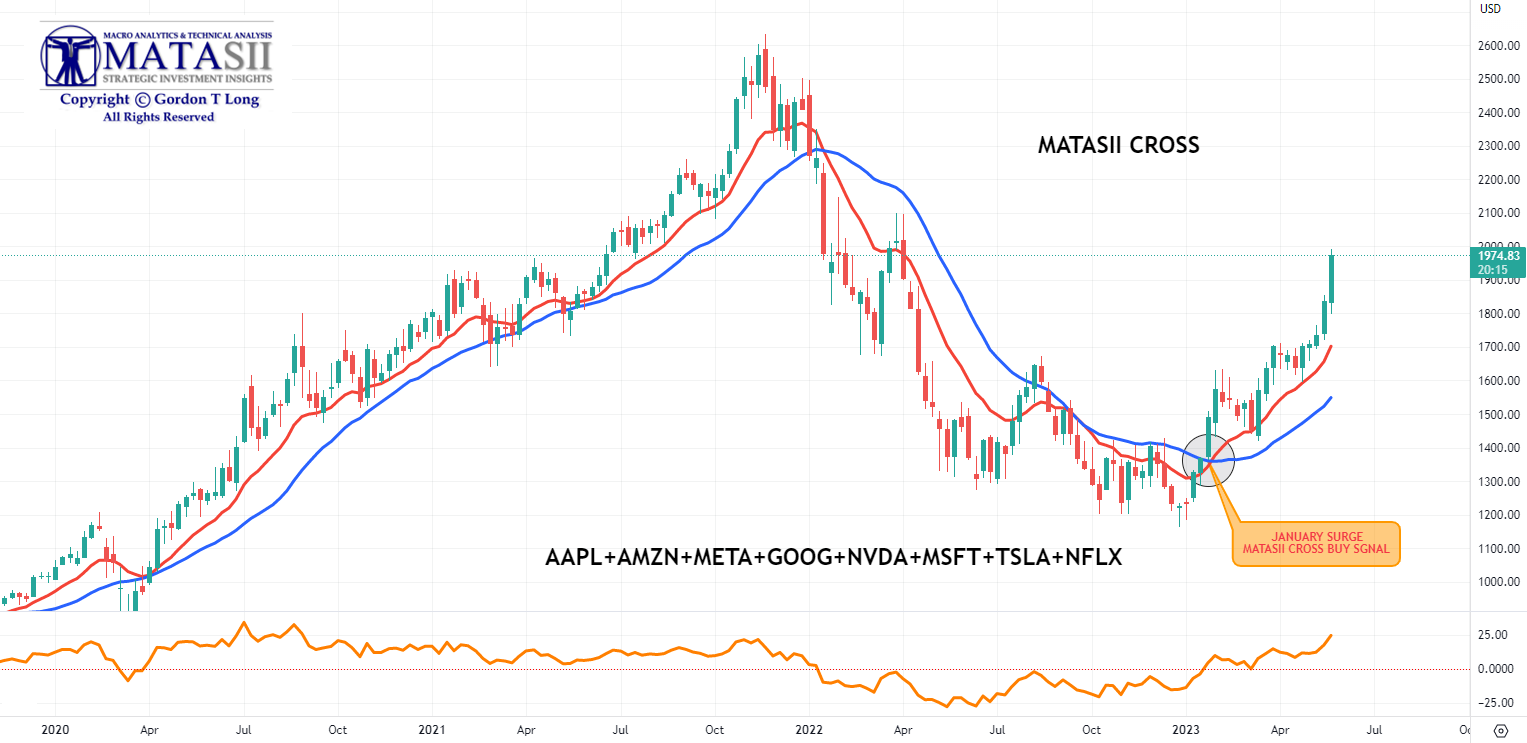
BUY SIGNAL IN JANUARY FOR BIG 8
Our Proprietary MATASII CROSS gave a BUY signal to the “Big 8” in January. See the circle at the red line crossing the blue line in the chart below. This was precisely when the newsflows spiked for AI. (the chart following)
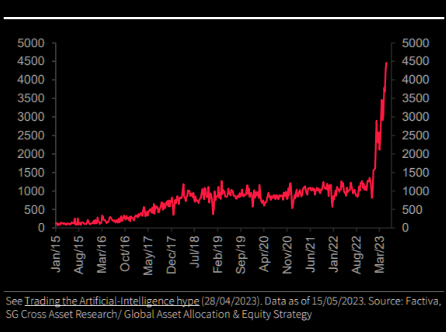
NEWSFLOWS DRIVE GAMMA TRADERS
The newsflows on AI commenced on January, coinciding with the sudden unexpected surge in the markets.
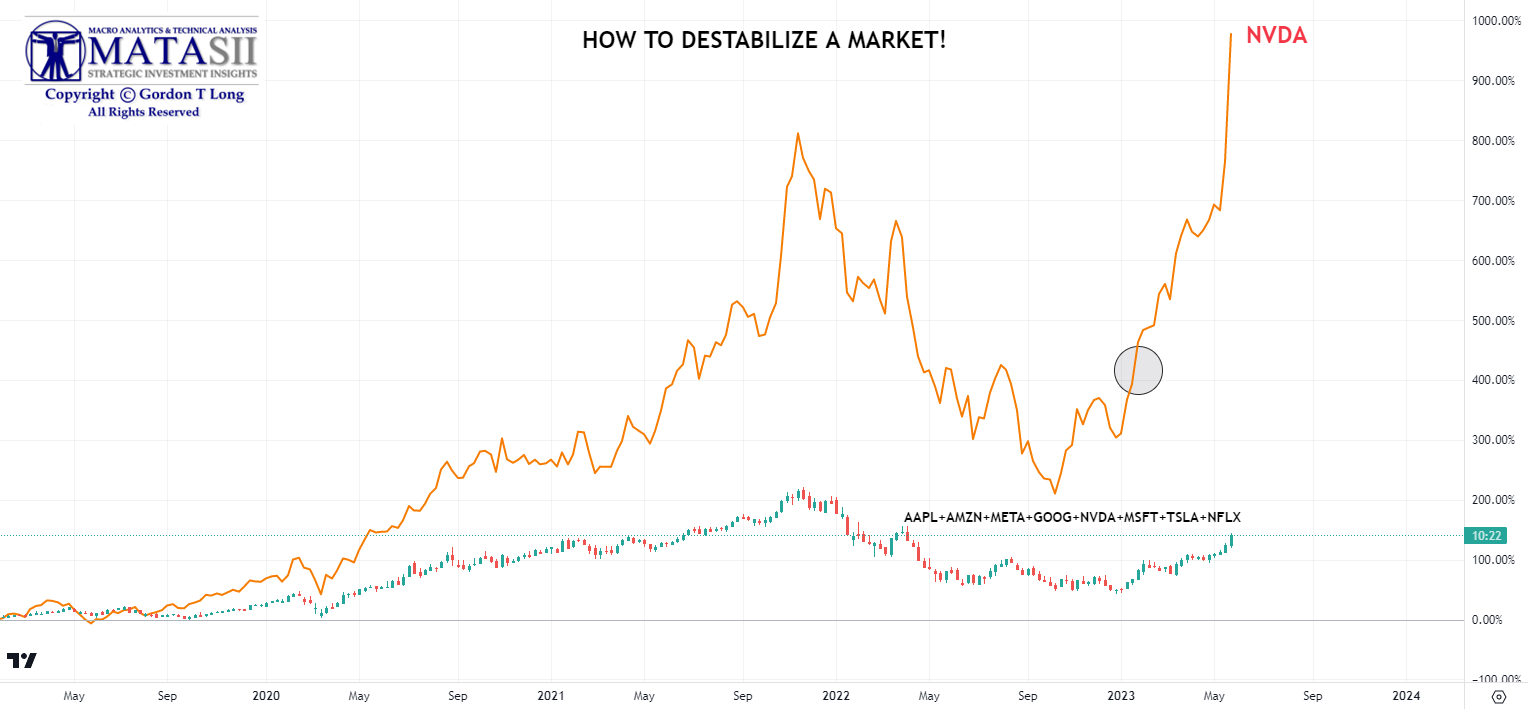
NVDA v BIG 8
We placed the SELL signal on the NVDA chart below and it seems clear that NVDA was the driver.
EXTREME CAUTION ADVISED
YOUR DESK TOP / TABLET / PHONE ANNOTATED CHART
Macro Analytics Chart Above: SUBSCRIBER LINK
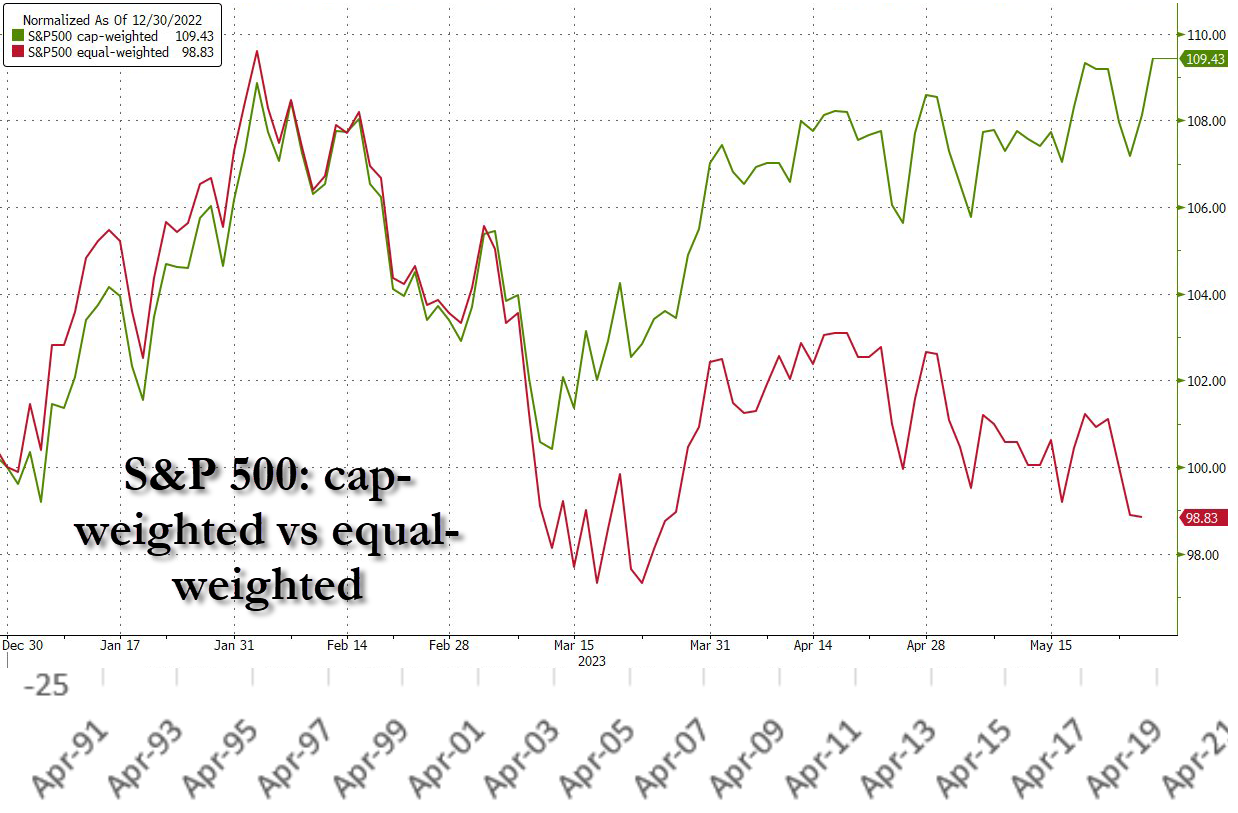
The equal-weighted S&P 500 is now underwater for the year, while the cap-weighted S&P is up around 10%…
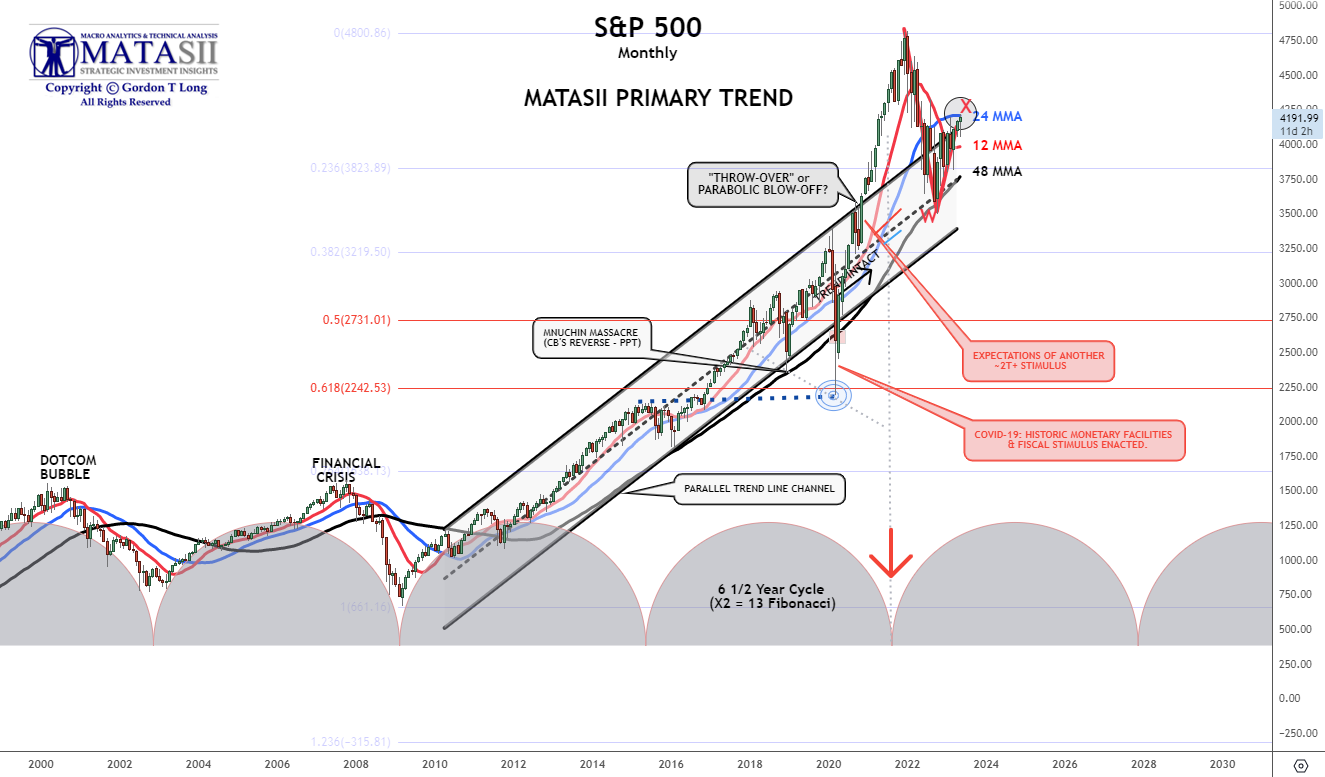
S&P 500 LONG TERM CHART
NVDA and the Big, 8 which it is a part of, are almost solely responsible for the rising WX leg shown below. We discussed this chart in last week’s chart package.
YOUR DESK TOP / TABLET / PHONE ANNOTATED CHART
Macro Analytics Chart Above: SUBSCRIBER LINK
WHEN THE BIG (REAL) GAINS OCCUR
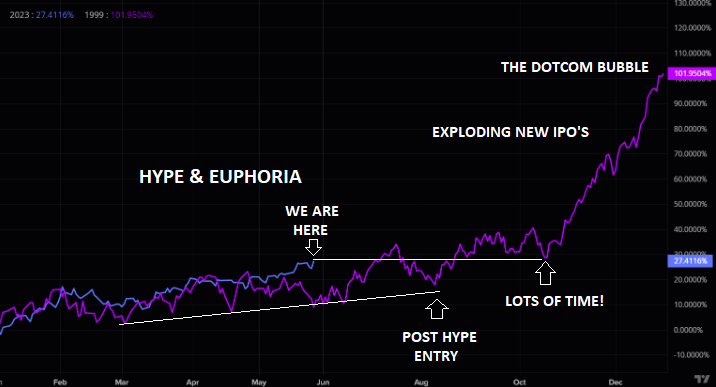
Is the AI narrative just getting started?
If the current AI hype is real (and there is a strong chance it is!), then you have plenty of time to enter at a better Price-to-Risk Ratio! There is a strong chance the AI will be fighting a Recessionary headwind on overall stock market performance. Take full advantage of this – keep your powder dry!
Most people underestimated the dot.com momentum back in 1999. Most managed losing tons of money, first shorting the hype, later chasing it before it all reversed and crashed. If AI is just another hype or not, we leave you to decide, but one thing is sure, most people underestimate all big narratives and trends tend to go on for much more than most think possible.
FAIR USE NOTICE This site contains copyrighted material the use of which has not always been specifically authorized by the copyright owner. We are making such material available in our efforts to advance understanding of environmental, political, human rights, economic, democracy, scientific, and social justice issues, etc. We believe this constitutes a ‘fair use’ of any such copyrighted material as provided for in section 107 of the US Copyright Law. In accordance with Title 17 U.S.C. Section 107, the material on this site is distributed without profit to those who have expressed a prior interest in receiving the included information for research and educational purposes. If you wish to use copyrighted material from this site for purposes of your own that go beyond ‘fair use’, you must obtain permission from the copyright owner.
NOTICE Information on these pages contains forward-looking statements that involve risks and uncertainties. Markets and instruments profiled on this page are for informational purposes only and should not in any way come across as a recommendation to buy or sell in these assets. You should do your own thorough research before making any investment decisions. MATASII.com does not in any way guarantee that this information is free from mistakes, errors, or material misstatements. It also does not guarantee that this information is of a timely nature. Investing in Open Markets involves a great deal of risk, including the loss of all or a portion of your investment, as well as emotional distress. All risks, losses and costs associated with investing, including total loss of principal, are your responsibility.
