Gordon T Long
Global Macro Research | Macro-Technical Analysis
TIPPING POINTS
INFLATION-DEFLATION
A DIS-INFLATION / DEFLATIONARY WAVE LOOMING
Deflation historically comes from rising job losses and elevated levels of national unemployment. Consumer stops spending, which in turn forces prices to be taken down by producers to sustain cashflow and financial survival at the sacrifice of profit margins.
Today we are beginning to see Deflation since consumers simply can’t afford to buy what they have previously because their real discretionary spending is not keeping up with Inflation. This leads to the same producer reaction!
The same process but different trigger and driver! This time slowing consumer spending is proceeding the layoffs versus being a result of it. The claim “you can’t have a recession without surging layoffs” is being lost on young economists who didn’t live through the 1970’s inflation era.
We are seeing this with falling used auto prices, which we highlight in this newsletter. Deflation is healthy in a working capitalist system. It rewards consumers, penalizes mal-investment and rewards producers delivering real vlaue. The creative destruction that capitalism is built on has been impaired by government intervention through government subsidies, over-regulation and monetary / fiscal mal-practice.
Unfortunately today we have a seriously impaired capitalist system which should more accurately be described as “Creditism”. Instead of “Savngs” being reinvested into “Productive Assets”, we have “Credit” being spent on “Consumption”. If the consumer can’t afford to buy, consumptions slows. Slowing consumptions tends to trigger lenders to immediately tighten lending standards. It is called the proverbial death spiral!
Unfortunately this has been going on so long in the US that it has resulted in an economy which consumes more than it produces. An economy that is quickly losing its competitive advantage in many industries which were once unassailable to foreign competitors.
The end of the “Era of the Great Moderation” is bringing this reality to light as Risk is Repriced, Collateral Re-Values and Credit becoming more restrictive.
The central driver is that the Regulatory State through Government debt and spendng is now crowding out the private sector!
WHAT YOU NEED TO KNOW
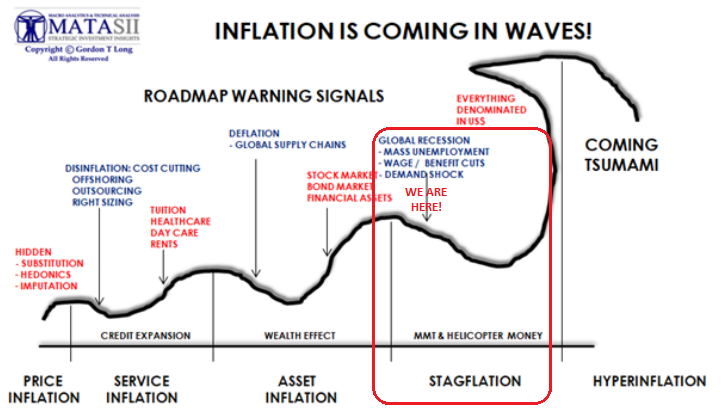 ANOTHER TROUGH / EBB BEFORE THE BIG ONE! – Inflation & Deffation Comes in Waves!
We believe we are entering the next Dis-Inflationary – Deflationary Wave down. Expect this to dominantly occur in Risk Assets and Assets we finance or WANT versus staples or things we NEED and typically pay cash for. We will have both Inflation PLUS Deflation, but only in separate areas with the media near term shifting its focus to Deflation.
DIS-INFLATION v DEFLATION
-
- We are witnessing slow but steady falling inflation rates around the world, though Core Inflation is proving stubbornly a problem!
- Given China’s re-opening stall, the general disinflationary trend (a falling inflation rate) shouldn’t be disrupted over the next 3-6 months.
-
- According to the World Bank, global growth in 2023 will slow to the lowest level since the 2008 financial crisis. Very uncharacteristically the World Bank (WB) is predicting the beginning of a potential Global Recession.
- The WB states “The world economy remains hobbled. Besieged by high inflation, tight global financial markets, and record debt levels, many countries are simply growing poorer.”’
- The WB sees growth in advanced economies slowing from 2.6% in 2022 to 0.7% this year and remaining weak in 2024. Global growth is projected to decelerate to 2.1% this year, falling from 3.1% in 2022.
- According to the World Bank, global growth in 2023 will slow to the lowest level since the 2008 financial crisis. Very uncharacteristically the World Bank (WB) is predicting the beginning of a potential Global Recession.
-
- We are witnessing the proof of mounting Dis-Inflation – Deflation wave in many areas, most clearly in falling global Commodity pricing accross the board. Crude oil (WTI) is down 38% in the past year, trading below pre-Ukraine invasion level. Gasoil (-44%), gasoline (-40%), heating oil (-44%), natural gas (Henry Hub -74% and NBP -65%) have all plummeted to pre-war levels. Even wheat is down 30% from a year before June 4th, 2023.
- The FAO Food Price Index has also corrected to a two-year low in May.
CONSUMER SPENDING – Has Hit A Wall!
-
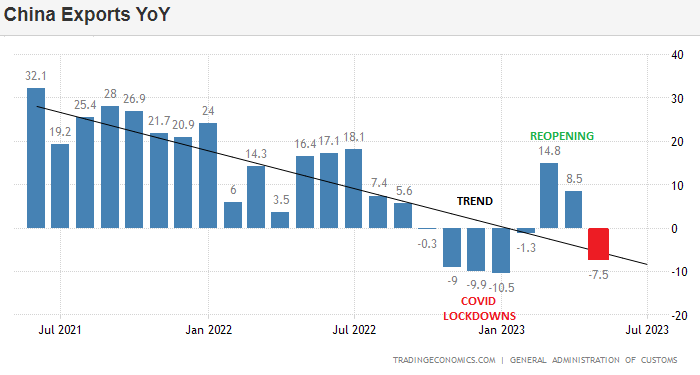
- China NEGATIVE Export Growth last quarter highlights the signs that Global Consumption Is slowing! (This supports the World Bank Report).
- US Wholesale Sales totals are have tumbled into the red on a Y-o-Y. basis (This is a strong US recession signal!)
- Falling US Used Car sales are a tellling example of looming deflation and a tapped out US consumer.
US & GLOBAL ECONOMIC REPORTING: “Deep Dive” of This Week’s Key Economic Reports
-
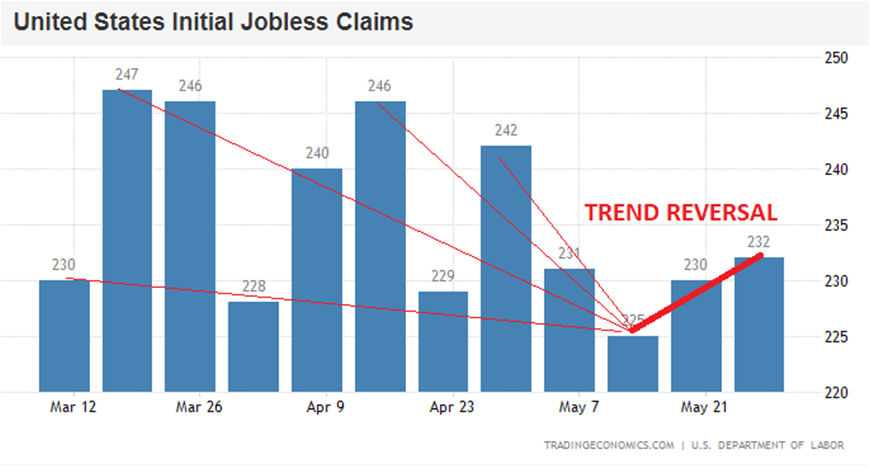
- US Jobless Claims, as we anticpated in this week’s video, accelerated significantly this week. This was the largest rise in initial claims year-to-date – ex-COVID – since 2009.
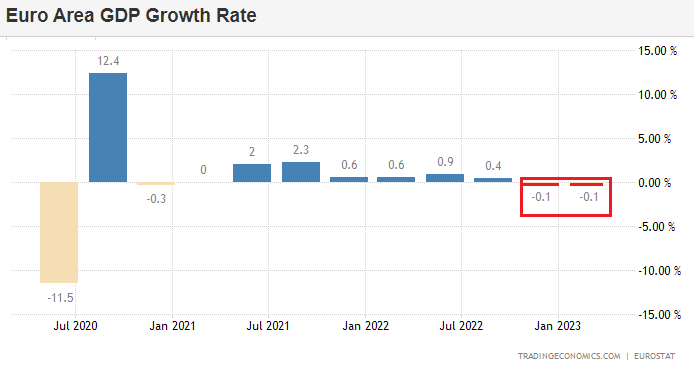
- EU officially fell into Recession with the newly released adjusted Q1 2023 and Q4 2022 both being negative on a move-over-month basis.
- Services Surveys Disappointed In May with Employment and New Orders Tumbling.
- Core US Factory Orders Unexpectedly Shrank In April – Weakest Since COVID-19.
 CONCLUSION
-
- CHINA RE-OPENING – Is Faltering on Weak Exports (Chart Right).
- THE TAYLOR RULE & CORE INFLATION Signals We Still Have An Inflation Problem.
- THE “TRILEMMA” (Dollar, Tech & Real Rates) Continues to Confuse!
- BANKRUPTCIES – The End Of Easy Money: Bankruptcy Filings Pile Up At Fastest Rate Since 2010.
- LAYOFFS – Tech Layoff Mania Sparks 200,000 Job Cuts As New Grads Pursue Careers On Wall Street. Initial Jobless Claims Surged To Highest Since Oct 2021.
- THE DEBT CEILING HIKE & CORPORATE DEFAULT – Deutsche Bank strategist Steven Zeng said in a recent research note, net bill issuance of $400 billion is expected in June, followed by $500 billion between July and September. In total, Zeng estimated $1.3 trillion in net bill issuance by the end of the year. All of which could well drain significant liquidity from the system.
- MERGER MONDAY’S RE-MERGE! – Mega Merger Monday: Chevron Buys PDC; Mubadala Buys Fortress; Mizuho Buys Greenhill.
DIS-INFLATION v DEFLATION
We are witnessing slowly but steady falling inflation rates around the world, though Core Inflation is still proving stubbornly a problem! Given China’s re-opening stall, the general disinflationary trend (a falling inflation rate) shouldn’t be disrupted over the next 3-6 months.
We outined how and why this occurs in our video (right): UnderTheLens – 09-23-20 – OCTOBER – Inflation PLUS Deflation? We encourage you to review it if you haven’t previously.
We believe we are entering the next Dis-Inflationary – Deflationary Wave down. Expect this to dominanty occur in Risk Assets and Assets we finance or WANT versus staples or things we NEED and typically pay cash for. We will have both Inflation PLUS Deflation, but only in separate areas with the media near term shifting its focus to Deflation.
VIDEO LINK: https://youtu.be/rDVsSVRqFpM
The Dis-Inflation – Deflation period is likely to last much shorter in time than the representative schematic above suggests. We will see a US Recession, markedly slow global growth, rising unemployment and a demand shock as the wealth effect reverses from high import costs to consumers.
We can expect the Federal Reserve to attempt to combat this by “Pivoting” and lowering rates while governments adopt even more aggressive policies based on the belief in MMT (Modern Monitary Theory). This will only stock the fire for the next major Wave of Infaltion!
 According to the World Bank’s Global Economic Prospects, global growth in 2023 will slow to the lowest level since the 2008 financial crisis. Very uncharacteristically the World Bank is predicting the beginning of a potential Global Recession. You might recall that the US Great Recession was neither short nor shallow!
“Global growth is projected to slow significantly amid high inflation, tight monetary policy, and more restrictive credit conditions. The possibility of more widespread bank turmoil and tighter monetary policy could result in even weaker global growth and lead to financial dislocations in the most vulnerable emerging market and developing economies (EMDEs). Comprehensive policy action is needed to foster macroeconomic and financial stability. Among many EMDEs, and especially in low-income countries, bolstering fiscal sustainability will require generating higher revenues, making spending more efficient, and improving debt management practices. Continued international cooperation is also necessary to tackle climate change, support populations affected by crises and hunger, and provide debt relief where needed.”
According to the World Bank:
-
- “The world economy is in a precarious position.”
- Global growth is projected to decelerate to 2.1% this year, falling from 3.1% in 2022.
- The bank forecasts a significant slowdown during the last half of this year. That would match the global growth rate during the 2008 financial crisis.
- Higher interest rates, inflation and more restrictive credit conditions will drive the economic downturn.
- Growth in advanced economies will slow from 2.6% in 2022 to 0.7% this year and remain weak in 2024.
- Emerging market economies will feel significant pain from the economic slowdown.
- Yahoo Finance reported, “Higher interest rates are a problem for emerging markets, which already were reeling from the overlapping shocks of the pandemic and the Russian invasion of Ukraine. They make it harder for those economies to service debt loans denominated in US dollars.”
- The world economy remains hobbled. Besieged by high inflation, tight global financial markets and record debt levels, many countries are simply growing poorer.”
We are witnessing the proof of mounting Dis-Inflation – Deflation wave in many areas, most clearly in falling global Commodity pricing accross the board. Crude oil (WTI) is down 38% in the past year, trading below pre-Ukraine invasion level. Gasoil (-44%), gasoline (-40%), heating oil (-44%), natural gas (Henry Hub -74% and NBP -65%) have all plummeted to pre-war levels. Even wheat is down 30% from a year before June 4th, 2023. The FAO Food Price Index has also corrected to a two-year low in May.
Additionally, we are also seeing it in more consumer tangible areas such as falling used car prices, which only a year ago were skyrocketing!
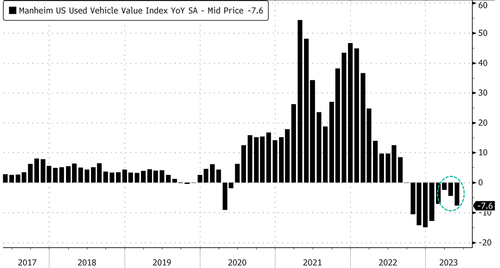 EXAMPLE: USED CAR SALES TELLS THE STORY
-
- Cox Automotive showed used car sales slid 11% year-over-year in May as affordability wanes.
- Consumers are forking out an average of $28,381 for a used car in the first quarter, which is considerably higher than the $19,657 level five years ago.
- According to figures from Cox Automotive, the Manheim Used Vehicle Value Index (MUVVI) fell by 2.7% in May from April to 224.5. This marks the second consecutive monthly decline and the lowest level in the index since January.
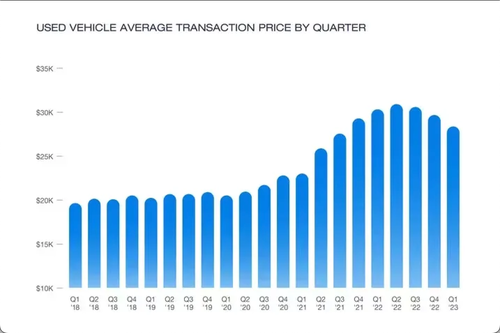
Consumers are forking out an average of $28,381 for a used car in the first quarter, which is considerably higher than the $19,657 level five years ago.
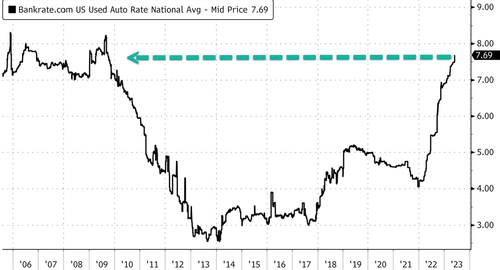
According to Bankrate data, borrowing costs for used cars have spiked to an average rate of 7.69%, the highest level since September 2009.
CONSUMER SPENDING – Has Hit A Wall!
What is happening in the “Pre-Owned” market is representative of how consumers are increasingly being “tapped out”.
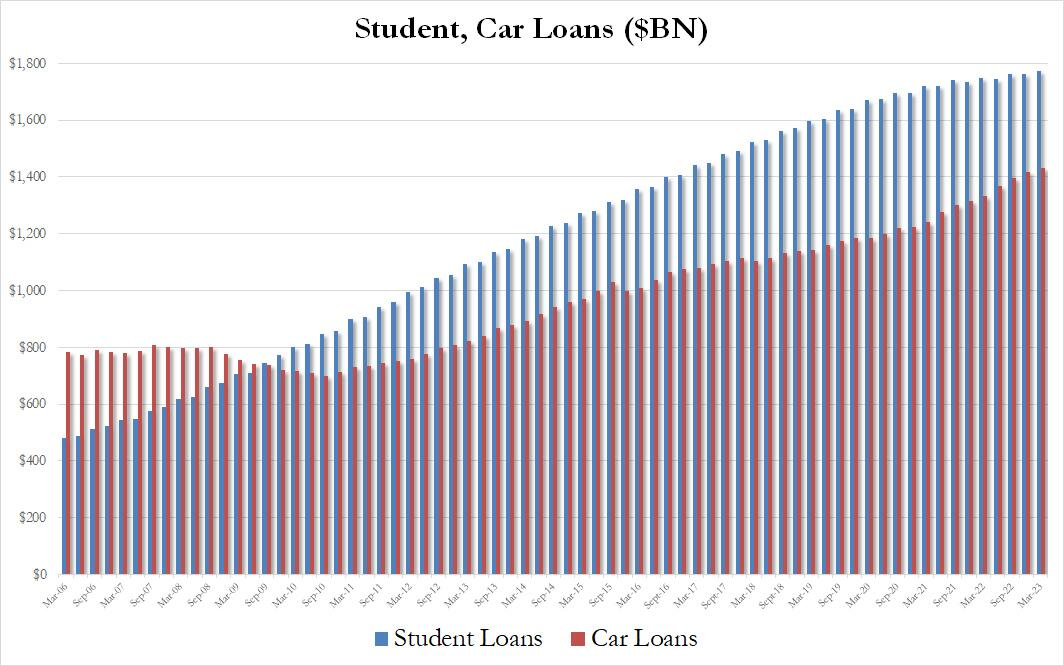
Many Americans are stuck with $1,000 monthly payments (some of which they can’t afford), since they have rolled over previous unpaid car loans to buy a new car or truck. This despite utility trucks costing $65K – +100K. Now they are simply unwilling or unable to lock in double digits interest rates on their auto loans and therefore demand for auto loans has collapsed.
As shown in the chart below, auto loans rose by just $13.9 billion, the weakest quarterly increase since 2020.
As a result, Wholesale Sales totals are tumbling into the red on a Y-o-Y basis This is a strong recession signal!
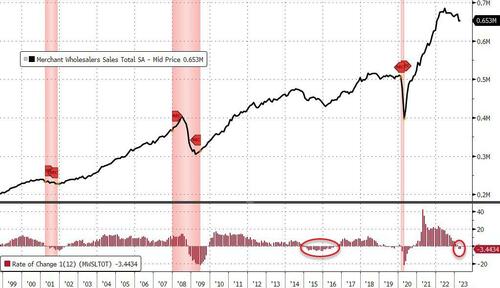
Because what is occurring is a global issue, it supports what the World Bank (and others) are pointing out.
Further evidence is in the just released China Economic numbers. China’s emergence from their Covid lockdowns is going nowhere near what many expected. China is being forced to pump stimulus it had previously indicated they didn’t expect (nor want) to do!
China NEGATIVE Export Growth last quarter highlights (chart right) the signs that Global Consumption Is slowing!! (This again matches the World Bank Report shown above).
GLOBAL ECONOMIC REPORTING: What This Weeks Key Global Economic Reports Tell Us
 IT JUST KEEPS GETTING WORSE!
Again this week we did another deep dive into the Economic Indicators being released with a particular expansion to include a broad mix of global countries.
The data around the world continues to only worsen!!
-
- The EU is in Recession and has been since Q1. This was announced with quietly revised data.
- China’s Exports went negative on a Y-o-Y basis. This is particularly bad, remembering that a year ago China was in full Covid lockdowns!
- The US Jobless Claims numbers surged this week (as we forecasted in this month’s video – charts below).
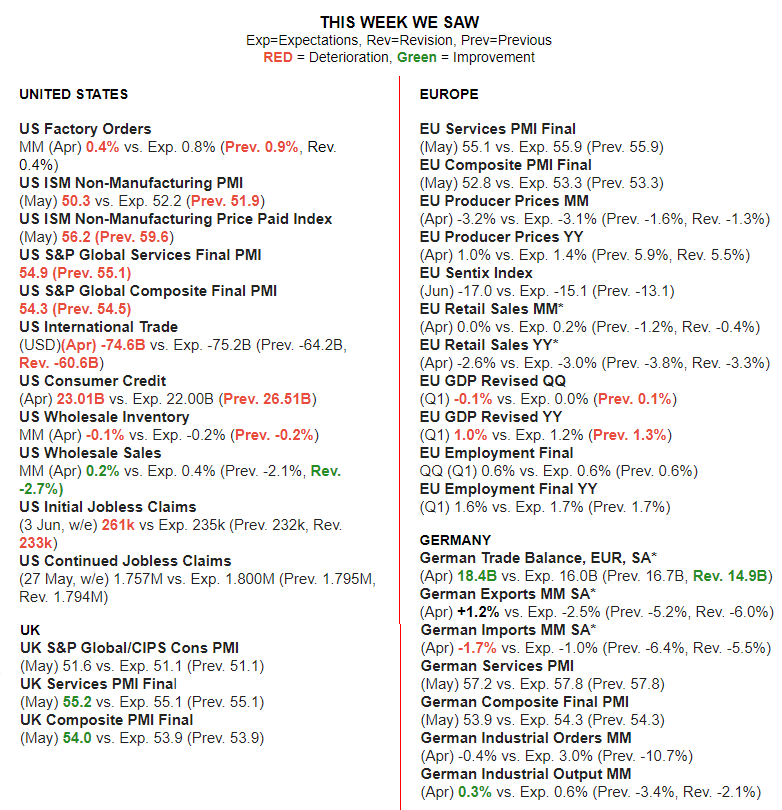
WHAT DOES A SCAN OF THE DATA BELOW TELL YOU? – THE MEDIA AVOIDS BAD NEWS!
We present the data in a way you can quickly see what is happening.
Anything in Red is further deterioration. Green is an imporvement over the last release.
INITIAL JOBLESS CLAIMS
 The number of Americans filing for unemployment benefits jumped to 261K in the week ending June 3rd 2023, which included the Memorial Day holiday, the highest figure since October 2021, and above market forecasts of 235K.
-
- Figures for the previous week were revised slightly higher to 233K from an initial 232K.
- It marks a third consecutive week of increases in the number of initial jobless claims, a sign the labor market strength may be fading.
- The 4-week moving average, which removes week-to-week volatility, was 237.25K, an increase of 7.5K from the previous week.
- Based on unadjusted data, the largest increases in initial claims were in Ohio (6.345K), California (5.173K), and Minnesota (2.746K), while the largest decreases were in Connecticut (-2.35K) and NY (-1.243K). Meanwhile, continuing claims fell to 1757K from 1794K, the lowest since mid-February and below forecasts of 1800K.
CHART ABOVE RIGHT: This week’s video release chart warns of the establishement of a new trend which in 2000 triggered the “popping” of the tech bubble (see video for 2000 charts)!
CHART BELOW: This week’s Jobless Report – Thursday 06-08-23 – No explanation required!
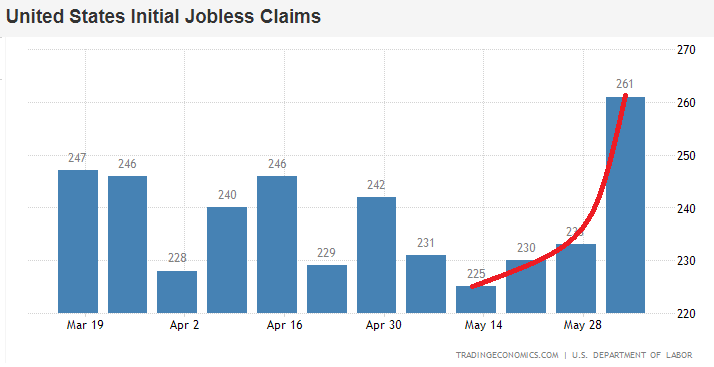
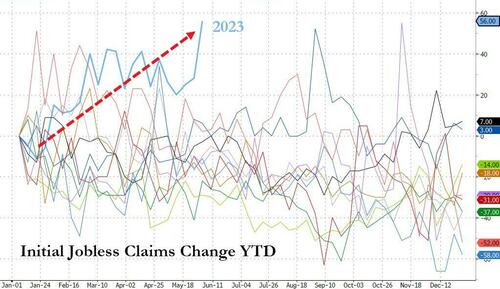
The biggest rise in initial claims year-to-date – ex-COVID – since 2009

Continuing Jobless Claims based on Historical comparisons is signalling a US Recesson.
ISM SERVICES
ISM Services PMI saw a surprise fall to 50.3 in May from 51.9 in April, against the consensus view for a rise to 52.2, indicating a slower pace of growth. The current Business Activity Index fell to 51.5 from 52, bucking the expected rise to 52.5. While the fall in Prices Paid to 56.2 from 59.6 was good news on the inflation front, it was accompanied by declines in both the forward-looking New Orders (52.9 vs prior 56.1) and Employment, (which slipped into contractionary territory at 49.2 from the prior 50.8), raising some growth concerns. The contraction in Employment counters the solid additions in Friday’s NFP report, and gives some more weight to the negative aspects of the Jobs Report last week, such as the fall in hours worked and spike in the unemployment rate. However, Pantheon Macroeconomics notes the ISM Services Employment and payrolls figures don’t have the clearest relationship, but warns, “the NFIB hiring intentions index has been a much more reliable guide to private payroll growth over the past couple years, and points to a slower pace of hiring.” The consultancy also says the fall in Prices Paid is consistent with a steep drop in wage growth, given wages are the largest expense for services firms, and should give policymakers some comfort given the links made between wages and core PCE services inflation ex-rent.
CANADIAN JOBS (Evidence of Global Problems)
Canadian jobs surprisingly fell 17.3k in May (prev. +41.4k) against the expected rise of 23.2k. Looking at the internals, the unemployment rate rose to 5.2% from 5.0% while participation rate dipped to 65.5% (prev. 65.6%). Average hourly wage moved lower to 5.1% (prev. 5.2%), but still remains too hot for the BoC, while total hours worked fell 0.4% M/M, the first material drop since September 2022, which is an early indication that GDP contracted in May. Oxford Economics notes, “the labour market finally loosened up in May, and we believe this is just the beginning as the economy slips into recession.” On Wednesday, BoC surprisingly hiked rates by 25bps (against expected unchanged), as it noted it needs to see wage growth slow to the 3%-3.5% range to be confident that underlying inflation will sustainably return to its 2% target. As such, the Bank has one more job report and one inflation report to assess before its next rate decision on July 12th, and Oxford adds “If labour markets, wage growth, and inflation don’t slow further as we expect, the BoC would likely hike rates again in July, with even more hike on the table this year.”
CONCLUSION
1- CHINA REOPENING IS FALTERING ON WEAK EXPORTS
Though the shrinkage of Chinese exports on a Y-o-Y basis reported this week was a blow to hopes for the re-opening of Post Covid Lockdowns, it is the trend that is more worrying!
Since the the world was hit with Covid-19 in early 2020, Chinese exports have been in a steady down trend. Global demand is simply not returning!
2- THE TAYLOR RULE & CORE INFLATION SAYS WE STILL HAVE A PROBLEM!
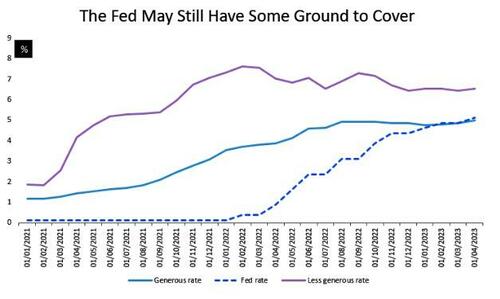 Though many no longer see the Taylor Rule to be reliable, this long held methodology by central banks says the Federal Reserve is still markedly short on where it needs to be to effectively combat the Inflation monster.
Core PCE inflation is now running at 4.7%, way above the Fed’s estimate that sees it crumbling to 3.6% this year before settling at 2% over the longer run.
Even though the Fed has raised rates by a phenomenal 500 basis points in the current cycle, core PCE has come off just 70 basis points from its peak of 5.4%.
Interest-rate traders are yet to fully wake up to the possibility that the Fed will have to raise rates again. They are currently assigning only an 80% chance of one 25-basis point move in the cycle. The Fed may well have to hike by more than that!
3- THE “TRILEMMA” CONTINUES TO CONFUSE
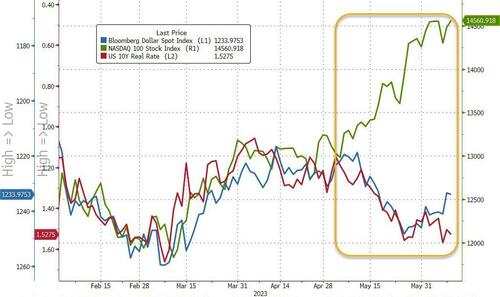 The dollar, tech stocks and real rates are not supposed to act like this into a recession.
The dollar rallies (fact) on higher real rates (check) OR rising risk aversion (not present), tech rallies (fact) on lower real rates (not present) OR higher risk appetite due to US exceptionalism (check).
Goldman believes that the dollar is right and equities aren’t.
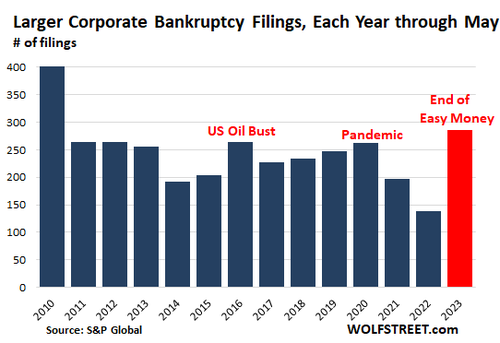 4- BANKRUPTCIES
-
- The End Of Easy Money: Bankruptcy Filings Pile Up At Fastest Rate Since 2010.
5- LAYOFFS
-
- Tech Layoff Mania Sparks 200,000 Job Cuts As New Grads Pursue Careers On Wall Street.
- WEEKLY JOBLESS CLAIMS: Initial Jobless Claims Surged To Highest Since Oct 2021.
6- THE DEBT CEILING HIKE & CORPORATE DEFAULTS
-
- Deutsche Bank strategist Steven Zeng said in a recent research note, net bill issuance of $400 billion is expected in June, followed by $500 billion between July and September. In total, Zeng estimated $1.3 trillion in net bill issuance by the end of the year. All of which could well drain significant liquidity from the system.
7- MERGER MONDAY’S RE-MERGE!
-
- Mega Merger Monday: Chevron Buys PDC; Mubadala Buys Fortress; Mizuho Buys Greenhill.
ONE MORE HIKE, THEN FED ATTEMPTS “ON-HOLD”
THE TRICK WILL BE MAINTAINING RISING “REAL” RATES!
THE FED PIVOT IS FURTHER AHEAD THAN MOST YET APPRECIATE!
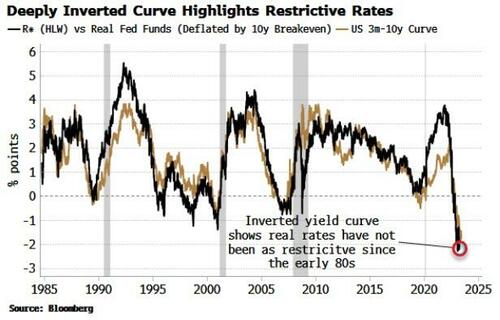 By several measures, rates are already very restrictive. Real policy rates are about to be above r*, the estimate of neutral. It’s an imperfect measurement with many assumptions.
The Inflation-fixing swaps see the REAL Fed rate at 2-2.5% through summer, well enough above the latest r* estimate of about 0.6% to indicate policy is indeed restrictive.
With the Fed Funds Rate expected to be increased by 0.25% at the next FOMC meeting, then held at 5.5%, the inflation fixing swaps are suggesting the Fed is expecting inflation to fall to around 3.0% in Q3. This would likely price the 10Y UST in a trading range of 3.85 – 4.15%, with an upward limit of potentially 4.473%. However, with the US Treasury General Account having to increase its Debt Ceiling lows by ~1.4T by year-end, a 10Y UST yield of 5.25% is not out of the realm of being a real possibility, if Treasury Secretary Janet Yellen isn’t extremely “orchestrated” in how this is carried out..
This is underscored by the yield curve’s inversion, which is giving us a transparent read on how restrictive rates are. The 3m-10y curve (above right) is almost a facsimile of the degree of restriction in the real policy rate. It’s no wonder some banks went under. The heavily inverted curve is a barometer of rate stress building up in the system and a reminder that other unexpected grenades could go off and upend the Fed’s current outlook.
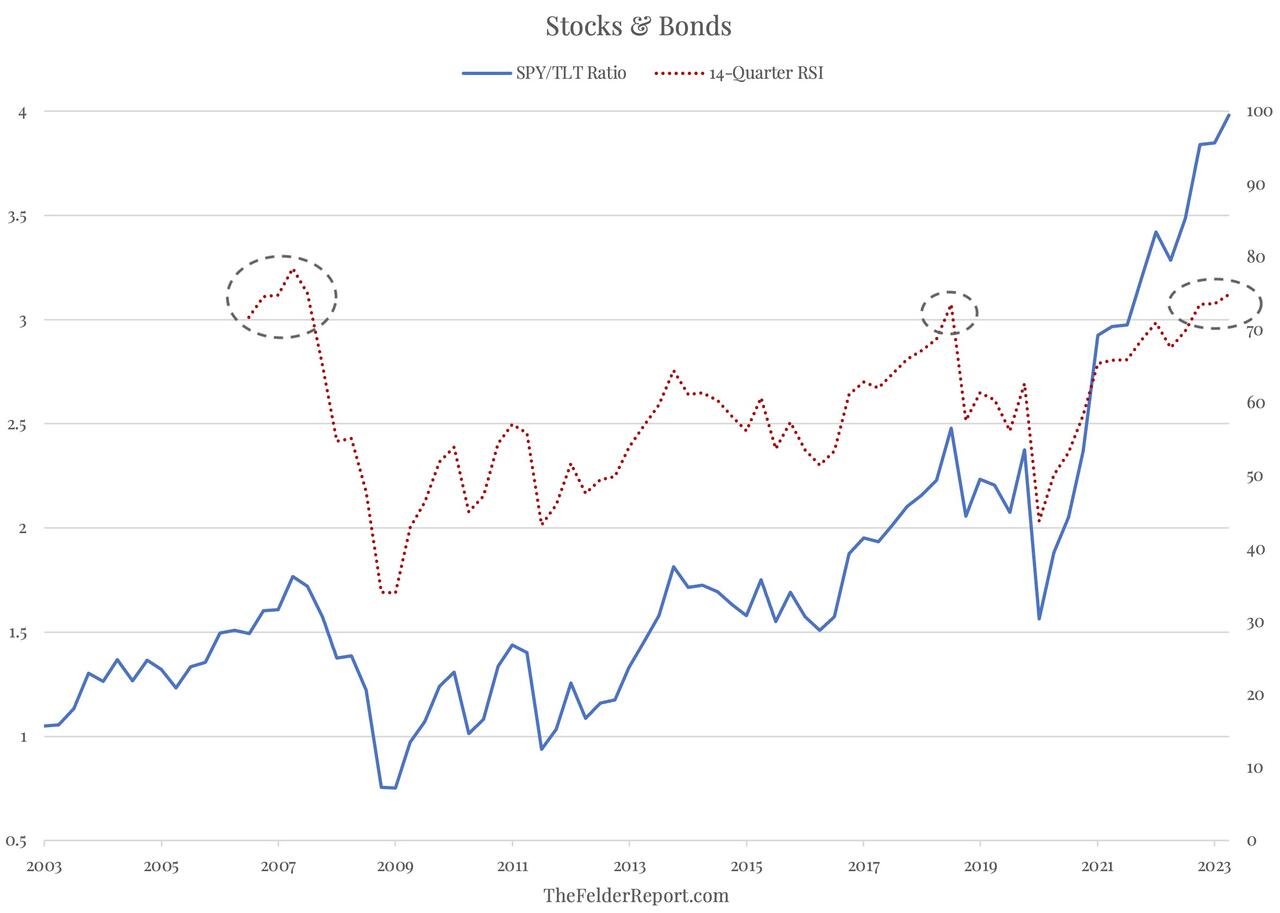
THE FED CONTROLS SHORT RATES – THE MARKET (WITHOUT QT / YCC) CONTROLS LONG RATES
The chart below is an excellent representation of the divergence that is soon likely to be closed. This will likely take the form of weakening equities, while experiencing relatively stable longer term treasury debt yields and prices as the Fed attempts to maintian rates “on-hold”. The Fed is likely counting on disinflation to bring inflation below the on-hold Fed Funds Rate.
|
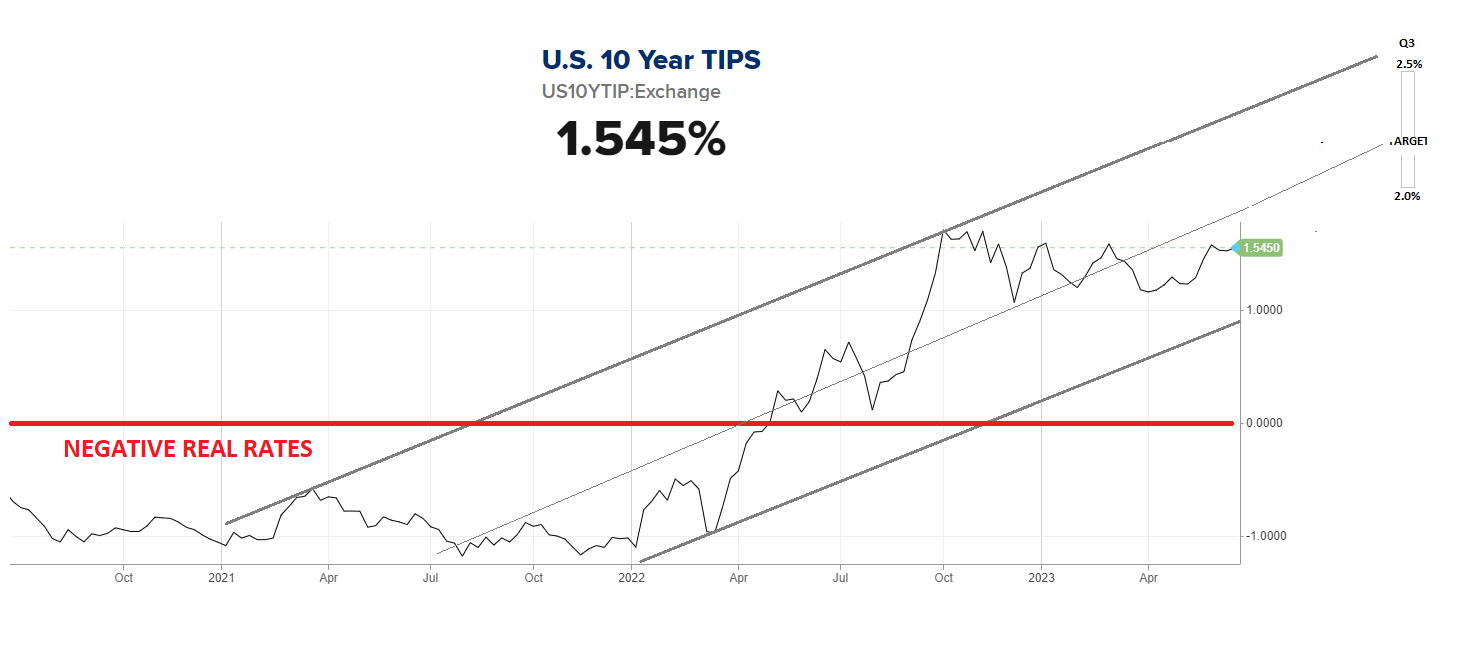
THE FISHER EQUATION & REAL RATES INFLATION BREAKEVENS:
APPLYING THE FISHER EQUATION (10Y UST): 2.25 Real (highligted in bold above earlier) + 2.223% Inflation (directly above) = 4.473% Nominal Rate |
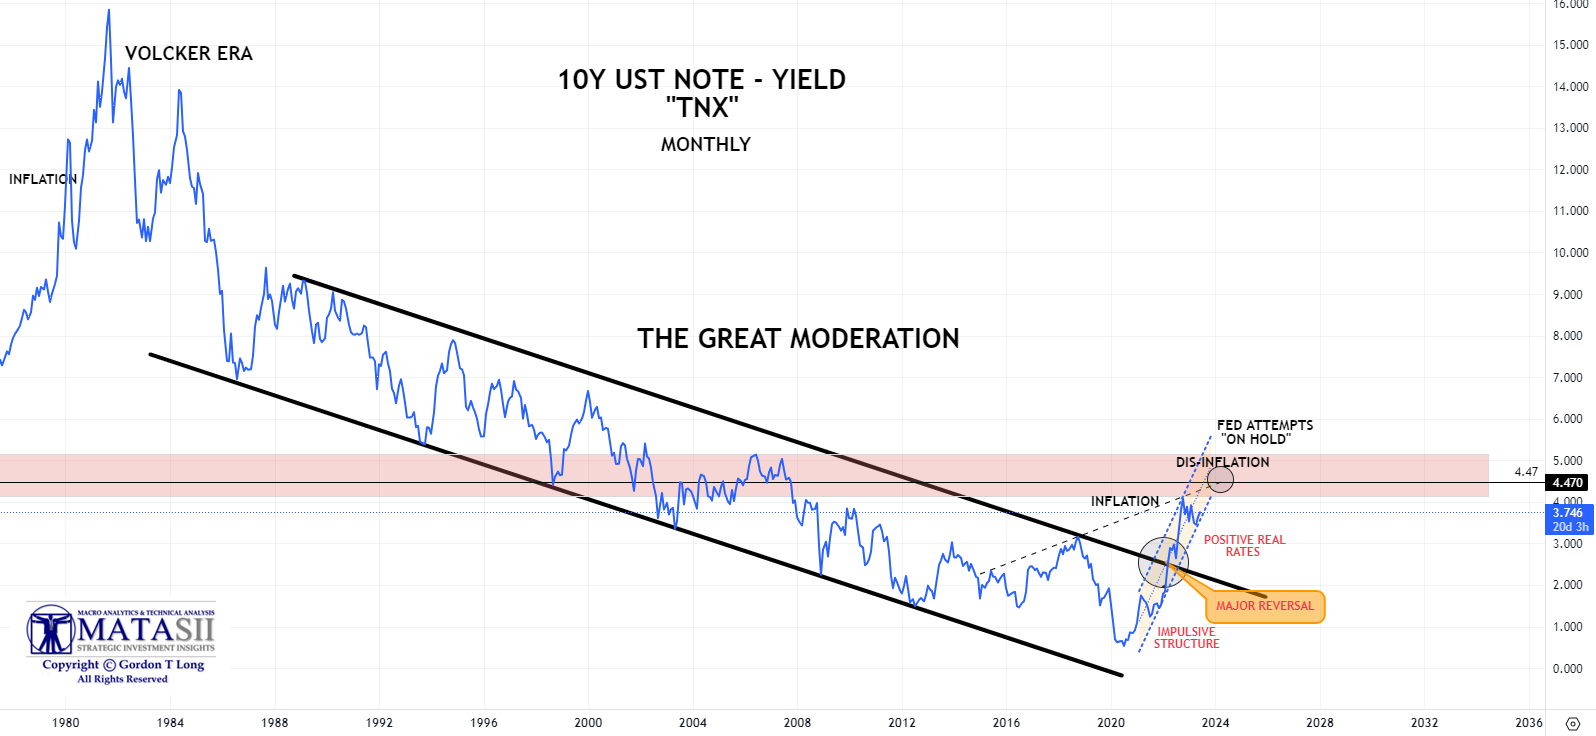
LONG TERM US TREASURY YIELDS (10Y UST – “TNX”)
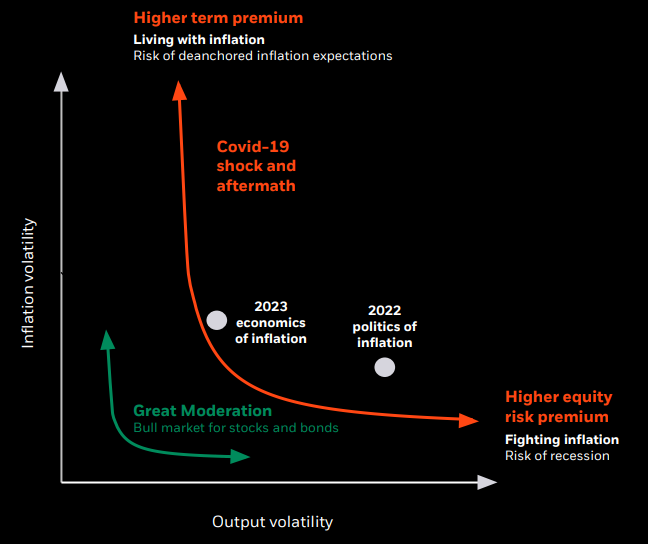 In the Long-Term, the 10Y UST (TNX) Yield has broken a 40 year trend channel marking the “Great Moderation Era”.
The period was driven by 3 structural drivers that no longer support low equity risk premiums and low bond duration premia.
The three drivers were:
-
- Globalization,
- Financialization and
- Mercantilism through using trade surpluses to buy US Treasuries and hold FX Reserves in US dollars. (Note: All these were detailed in this year’s Thesis paper – “The Great Stagflationary Debt Crisis”).
YOUR DESK TOP / TABLET / PHONE ANNOTATED CHART
Macro Analytics Chart Above: SUBSCRIBER LINK
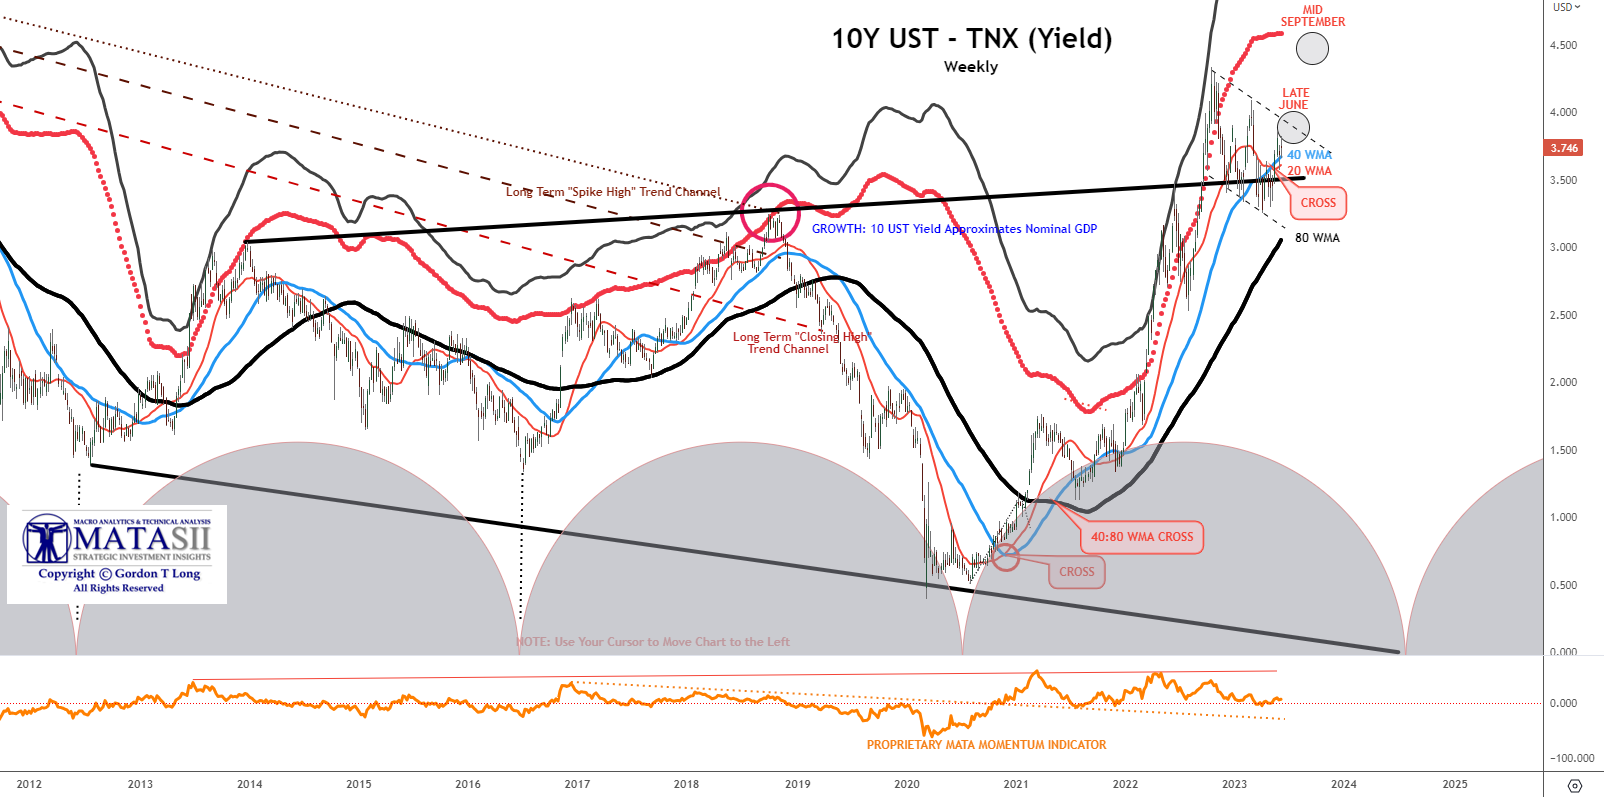
INTERMEDIATE TERM US TREASURY YIELDS (10Y UST – “TNX”)
In the Intermedaite Term, the US 10Y Treasury Note will be absorbing new Treasury issuances to “replentish” the TGA by an unprecedented ~ $1.4T by year-end. This would be expected to drive up yields and bond prices down.
YOUR DESK TOP / TABLET / PHONE ANNOTATED CHART
Macro Analytics Chart Above: SUBSCRIBER LINK
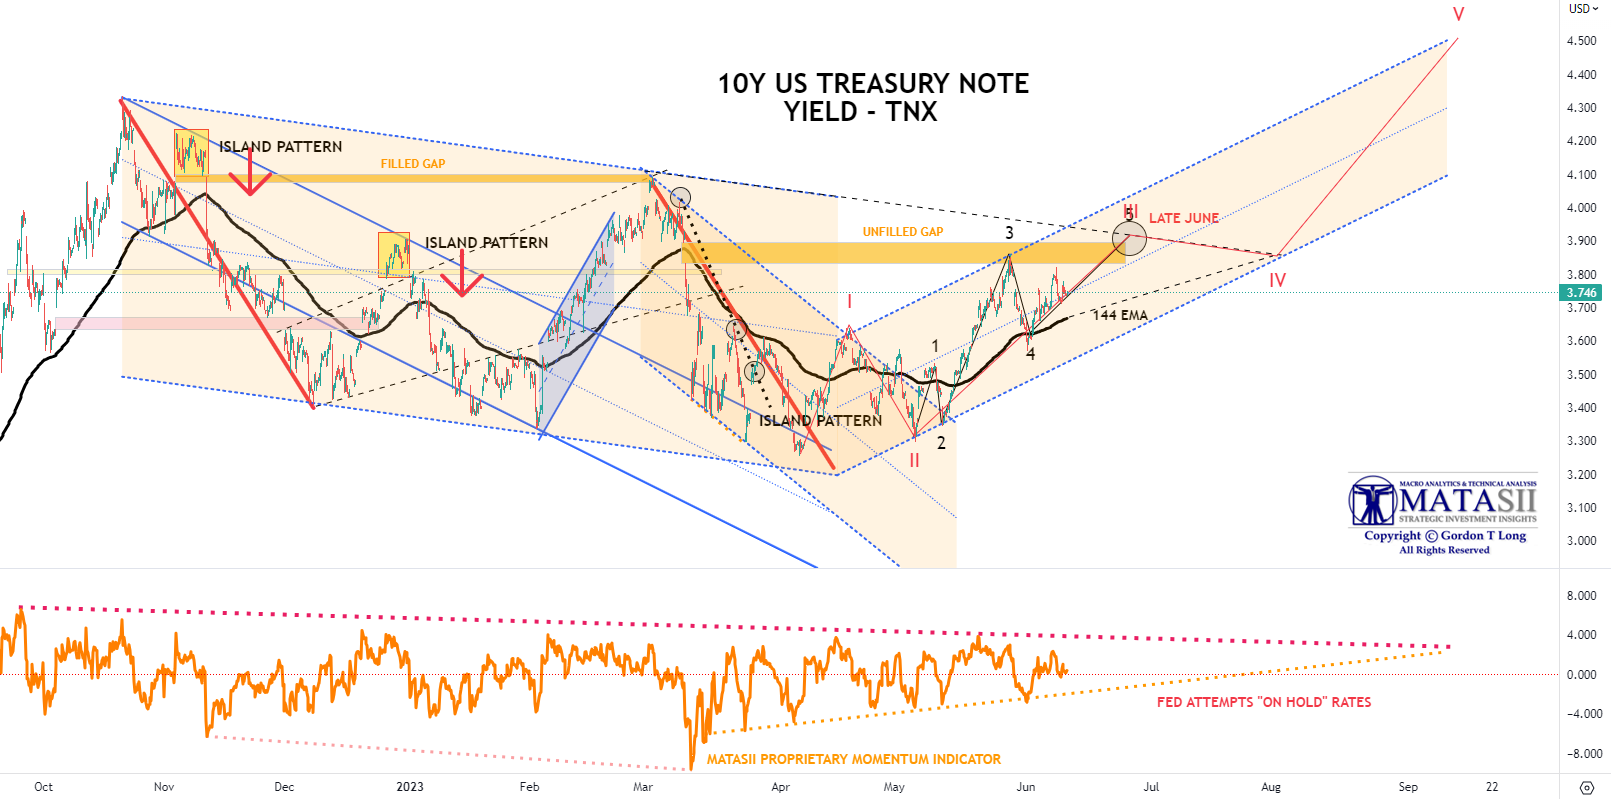
NEAR TERM US TREASURY YIELDS (10Y UST – “TNX”)
The Near Term is about the reaction to rising jobless claims, increasing layoff announcemnets and bankruptcies hitting the headlines. All of these indicators only further confirm the US is in a recession, as the GDI is already reporting (see last week’s video release) and the EU confirmed with the requisite two quarters of negative growth last week. The US 10Y Treasury Note is likely to start reacting to the expected new Treasury issuance to ‘replentish’ the TGA with the debt ceiling increase now signed into law by President Biden.
YOUR DESK TOP / TABLET / PHONE ANNOTATED CHART
Macro Analytics Chart Above: SUBSCRIBER LINK
FAIR USE NOTICE This site contains copyrighted material the use of which has not always been specifically authorized by the copyright owner. We are making such material available in our efforts to advance understanding of environmental, political, human rights, economic, democracy, scientific, and social justice issues, etc. We believe this constitutes a ‘fair use’ of any such copyrighted material as provided for in section 107 of the US Copyright Law. In accordance with Title 17 U.S.C. Section 107, the material on this site is distributed without profit to those who have expressed a prior interest in receiving the included information for research and educational purposes. If you wish to use copyrighted material from this site for purposes of your own that go beyond ‘fair use’, you must obtain permission from the copyright owner.
NOTICE Information on these pages contains forward-looking statements that involve risks and uncertainties. Markets and instruments profiled on this page are for informational purposes only and should not in any way come across as a recommendation to buy or sell in these assets. You should do your own thorough research before making any investment decisions. MATASII.com does not in any way guarantee that this information is free from mistakes, errors, or material misstatements. It also does not guarantee that this information is of a timely nature. Investing in Open Markets involves a great deal of risk, including the loss of all or a portion of your investment, as well as emotional distress. All risks, losses and costs associated with investing, including total loss of principal, are your responsibility.