Gordon T Long
Global Macro Research | Macro-Technical Analysis
GLOBAL MACRO
REGIONAL
THE STRATEGIC IMPERATIVE OF DE-RISKING, ON-SHORING AND FRIEND-SHORING
OBSERVATIONS: We Have Become A Lazy, Obsolete Industrial Nation
Manufacturing is an area I spent many years involved in. I started my career as an IBM Manufacturing specialist in pioneering new computer processes across a range of emerging leading edge concepts. In the 70’s & 80’s I lead teams in implementing new game changing manufacturing strategies such as JIT (Just in Time), KanBan, Pull Systems, Cycle Time & Six Sigma Quality. In the 80’s and 90’s I spearheaded operations for the Motorola Corporation in moving manufacturing offshore in the first waves of what subsequently became a global tidal wave. Subsequently I was involved in the strategic development of supporting global Supply Chains and vendor engineering. I state this in the way of background to support why I have serious reservations about our current strategic push towards “Re-Shoring”, “Friend-Shoring” and “De-Risking”.
Not for one moment do I believe this isn’t critically important and a strategic imperative to the future of America. Rather I believe we no longer have “What It Takes”! We neither have sufficiently trained Industrial Engineers, Process Technicians, Quality Engineers et al, nor overall expertise to even manage what is involved in the design, set-up and execution of what is being suggested. Our University and Trade Schools are currently iill equipped to train the people required. We have let the whole support services edifice decay while those who could “carry the water” have retired or been obsoleted with lack of any longer having a strong US Manufacturing base for growth and advancement.
Sure all these barriers can be resolved but that will take a decade to achieve. Realisticaly that is time the current competitive urgency doesn’t allow for!
What many forget was the reason off-shoring could happen in the first place. The US had the expertise and desire to do it. We drove the process of off-shoring! It was India, China and the other countries that were fortunate enought to benefit! Today those countries have the expertise but not the desire to share nor deliver the “Golden Eggs” to allow any of it to return to the US. It simply isn’t in their interest! Matter of fact they can be exepcted to fight it every step of the way.
Like Green Energy and Climate Change it is a good idea but has no realistic nor achievable plan to actually make it all happen. It is currently more political “Blue Sky” without any substance. Politicians can be expected to throw money at the problem but that won’t deliver “the baby in 1 month versus 9 months”!
We have waited too long and appear to be incapable of leadership in marshalling the forces and efforts which previous generations did with the Marshall Plan or “Putting a man on the moon by the end of the Decade” . America has become a country of talkers, not doers!. We have become a superficail nation where perception is seen to be reality. We are the land of Hollywood and Day Traders.
Manufacturing I learned first hand is at its core about people who consistently deliver by rapidly solving endless problems through personal committment and tenacity.
When I read that our youth think 40 hour work weeks are “archaic” and takes away their time for friends and personal interest. When I also see they no longer have the math, science and process proficiency and aptitudes for such work. All this suggests we may not even have the trainable raw material to actually do what previous generations achieved?
We also forget why manufacturers left the US in the first place. It wasnt’t just labor cost advantage and less predatory tax rates but about excessive and never ending government regulations & politically destructive industrial policies. When I read that Space X had to stop from launching a satelite because some agency had suddenly decided to do another environmental wild life survey it is quite evident that we are no longer a receptive, business friendly & supportive industrial nation. We have become a country of social media addicts who don’t like getting their hands dirty. Unfortunately, manufacturing is the dirty work that great nations are built on!
WHAT YOU NEED TO KNOW!
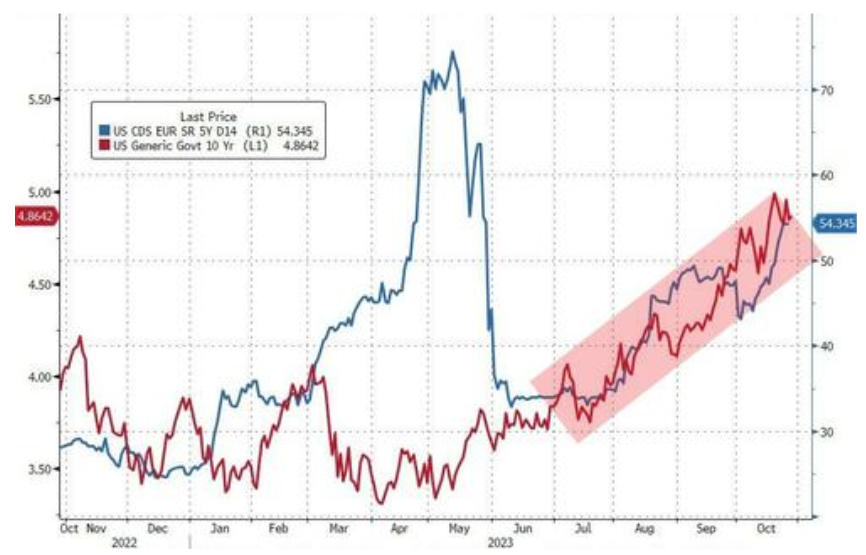 US SOVEREIGN CREDIT RISK CONTINUES HIGHER
Equity Risk Premiums (ERP) and Bond Duration Risk Premia are rising in concert with rising US Sovereign Credit Risk (CDS).
This is more than the result of rising Geo-Political Risk. There is concern with the growing size of the US debt and the possibility of resulting US Dollar currency debasement.
RESEARCH
THE STRATEGIC IMPERATIVE OF DE-RISKING, ON-SHORING AND FRIEND-SHORING
-
- Washington talk has all been about “decoupling” the U.S. economy from China’s. Decoupling suggests a radical separation. The talk is now about “De-risking”—a term that initially comes from the financial sector which implies curbing risks while avoiding a clean break.
- U.S. policymakers have never presented a precise definition of de-risking. In a broad sense. It entails mitigating the vulnerabilities posed by deep economic ties between the United States and China. Looking at the end goals of de-risking is probably the best way to define the concept.
- De-risking is a selective process: In contrast to decoupling, the United States does not seek to cut all ties to China. Instead, Washington will focus its efforts in three areas: information technology, energy, and biotech.
- There are three factors explaining why most U.S. policymakers now assume that cutting all economic ties with China is both undesirable and (probably) impossible:
- The Chinese economy is too big for decoupling to be a realistic prospect,
- A U.S.-China decoupling would accelerate the fragmentation of the global economic landscape,
- Cutting all ties to China would diminish those economic interdependences that give Washington leverage over Beijing.
- The de-risking enterprise is prompting a major overhaul of the United States’ economic policy toolkit. Three types of policies, in particular, have been resurrected from the past.
- The first resurrection is that of export controls,
- Second, industrial policy is making a comeback,
- The third revival has to do with U.S. cooperation with allies and like-minded partners.
Q3 EARNINGS:
-
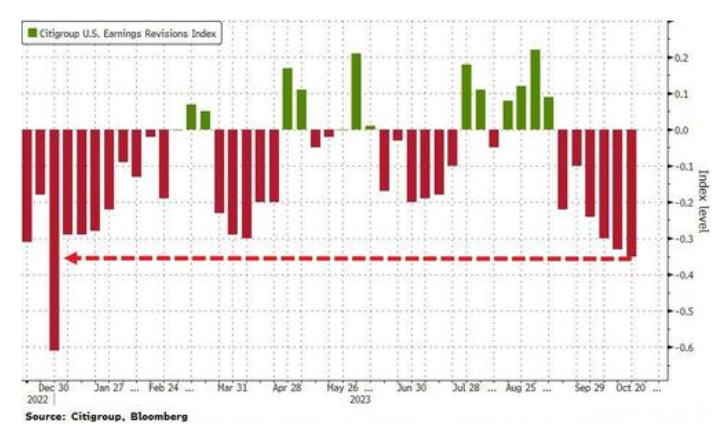
- The US earnings outlook is deteriorating rapidly. Full-year guidance looks unusually soft for this time of year, while the number of profit warnings are already trending toward season-highs with about half of the S&P 500 still to report.
- The Eanrings being delivered are not in the overall S&P 500 nor the overall Nasdaq and Russell 2000 but rather in the Nasdaq 100.
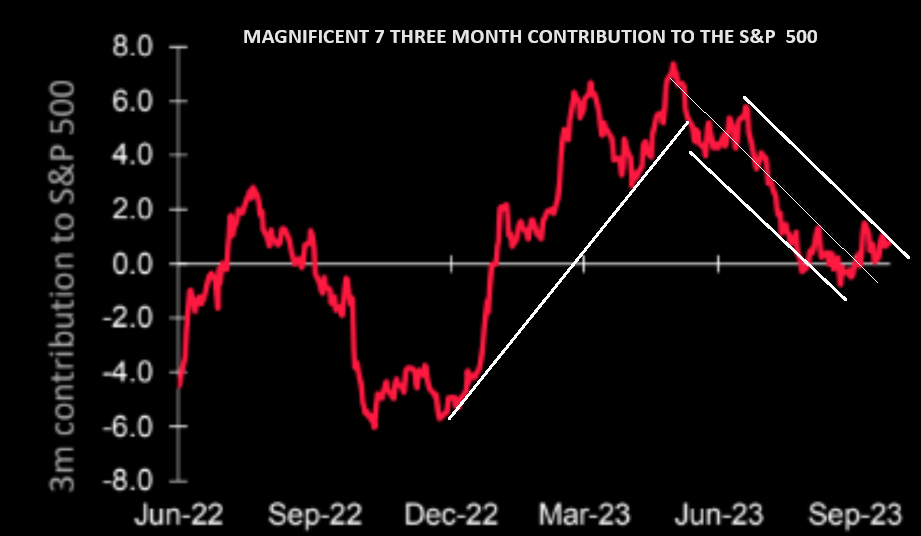
- The Magnificant Seven’s valuation after reported earnings is well off its high. Though Mega-cap Tech still trades at a significant premium to the other 493 stocks in the S&P 500, momentum is clearly waning with half a trillion gone in just one day of reported Q3 earnings and $4 trillion since the summer peak. The pain is huge!
GLOBAL ECONOMIC REPORTING: What This Week’s Key Global Economic Reports Tell Us?
-
- US ADVANCED Q3 GDP: Headline Q3 Advanced GDP print was hot, rising 4.9%, above the 4.3% forecast and accelerating from the 2.1% growth in Q2 with a large jump in consumer spending to 4.0% from 0.8% in Q2.
- US PCE: The spike in inflation in “core services” (all services except energy services) was the big nasty surprise.
 DEVELOPMENTS TO WATCH
INDICATIONS OF LATE CYCLE
-
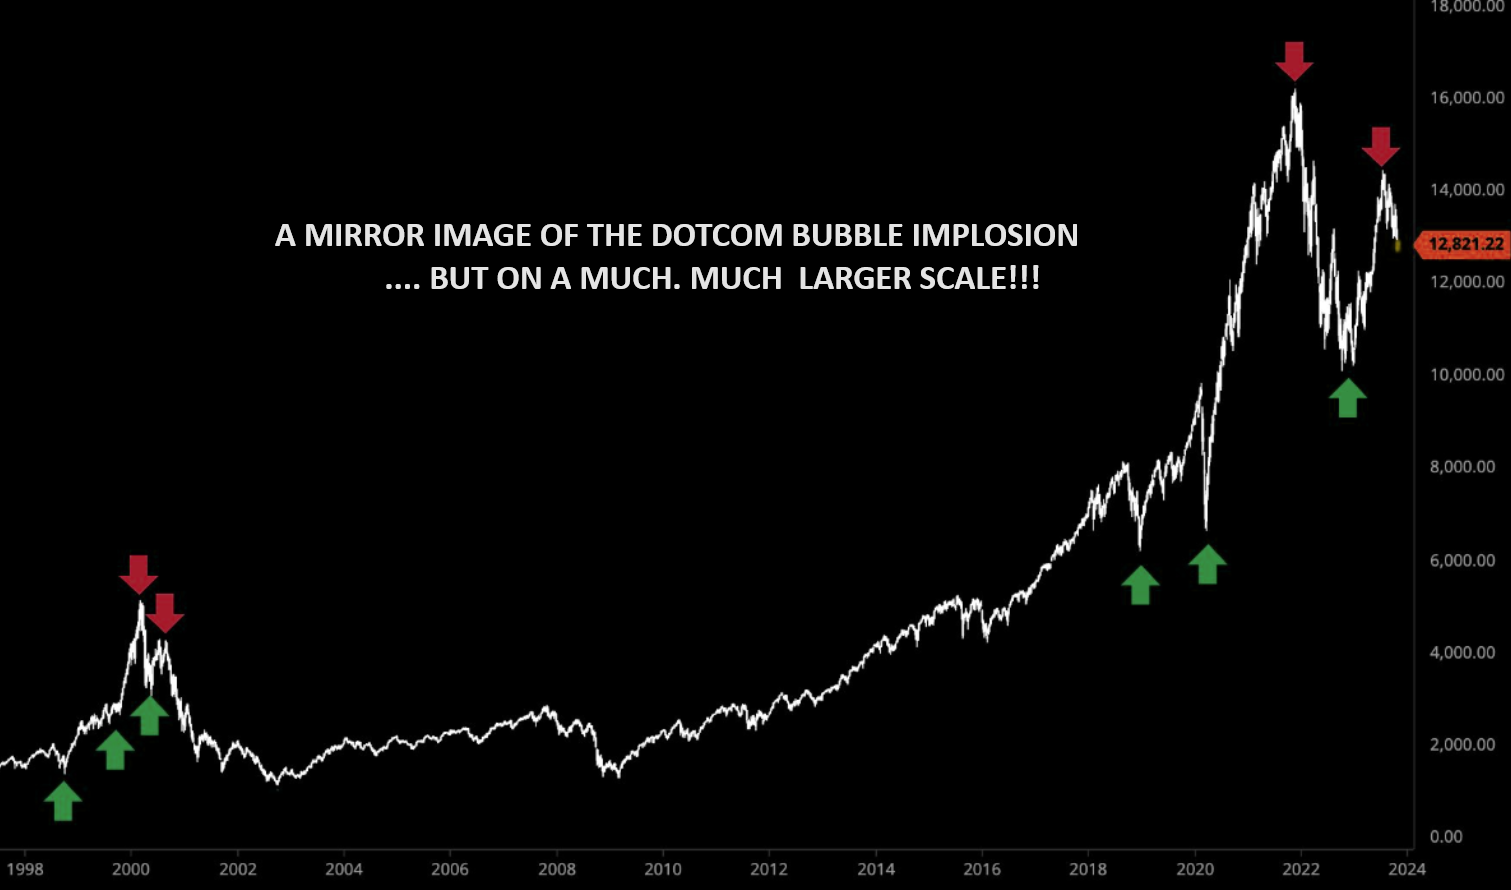
- The current Macro backdrop supports the notion that we are in late cycle environment when viewed by the Conference Boards Leading Economic Indicator (LEI).
- We have long held that the market operates in “Fractals” at various levels of degree. The fractal to the right suggests the late cycle Dotcom Bubble implosion was just a “warm up” for the bubble we have been in since 2000 and what now possibility lies ahead?
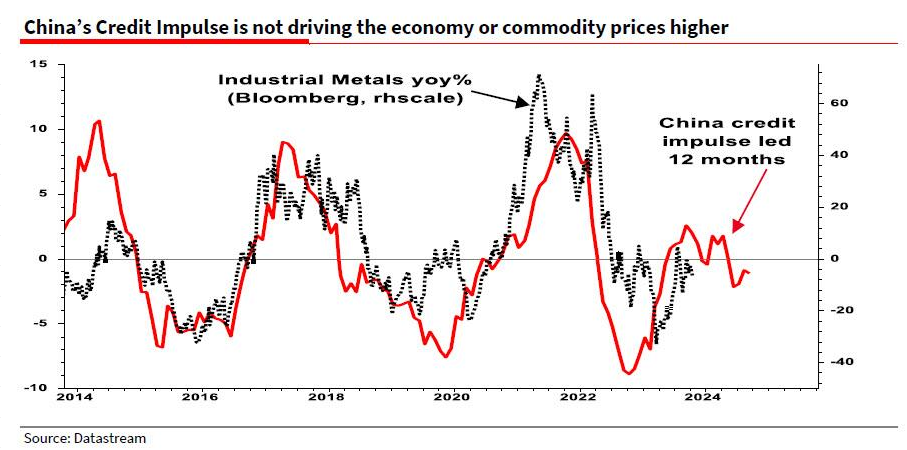
CHINESE CREDIT SPIGOT BEGINNING TO OPEN
Badly trailing US economic growth, President Xi Jinping stepped up support for the world’s second-biggest economy by:
-
- Issuing additional sovereign debt,
- Raising the budget deficit ratio,
- Making an unprecedented visit to the central bank.
THE STRATEGIC IMPERATIVE OF DE-RISKING, ON-SHORING AND FRIEND-SHORING
UNDERSTANDING THE NEW TERMINOLOGY
- RESHORING: Reshoring is the practice of bringing offshored manufacturing or industrial operations back to the company’s home country. It’s a strategic choice that can often be motivated by aspects like: quality assurance, financial concerns, supply chain resiliency, and market responses.
- FRIEND-SHORING: Friend-shoring happens when a government pushes businesses to restructure supply chains, shifting production away from geopolitical rivals to friendly powers. The Biden administration’s ban on American investment in Chinese technology is one such example.
- DE-RISKING: De-risking is an ideological term that the United States uses to describe its trade and investment policies toward China. It involves:
-
- Reducing dependence on China
- Preventing technologies with security implications from spreading to China
- Strictly reviewing and restricting outbound investment in China
- Mitigating the vulnerabilities posed by deep economic ties between the United States and China
- Cementing the United States’ role as the world’s technological leader
- Persuading more semiconductor suppliers to move out of China
NOTE: The term “De-Risking” was first used by European Commission President Ursula von der Leyen in March 2023. The Biden administration and G7 have both embraced the term. China insists that the United States’ “de-risking” push is a thinly veiled attempt to decouple and block China’s development. Chinese officials cite US President Joe Biden’s most recent executive order curbing technology investments as the latest evidence of this. However Commerce Secretary Gina Raimondo said that the U.S. doesn’t want to decouple from China. She said Biden’s message was: “We are derisking, we’re investing in America, but we are not decoupling or trying to hold down China’s economy”
 THE PROBLEM ACCORDING TO THE IMF
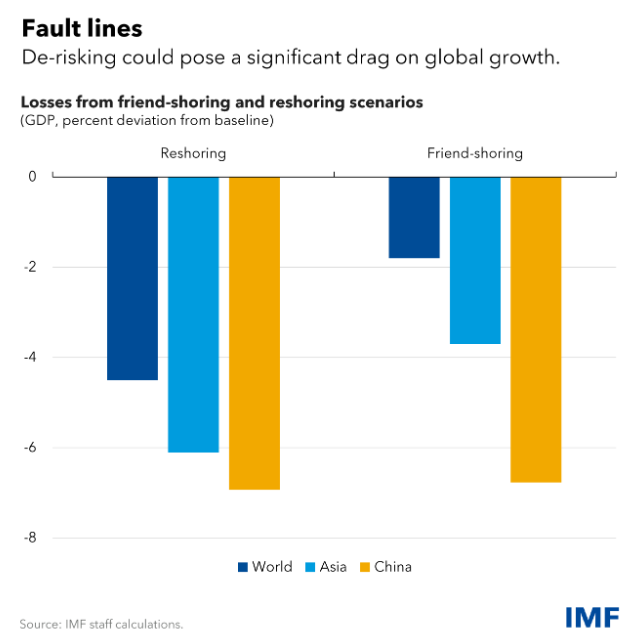
Harm From ‘De-Risking’ Strategies Would Reverberate Beyond China
The negative impact of ‘de-risking’ strategies by major economies would be felt beyond China, while comprehensive reforms in China could generate significant positive spillovers
China’s importance in the global economy has increased dramatically in recent decades, and it has been a particularly crucial driver of trade integration in Asia.
China’s medium-term growth prospects, like that of other countries, will be determined in part by major forces such as convergence to advanced economies’ income levels and demographics. Yet key structural policy drivers, including domestic reform momentum, and external factors, including geoeconomic fragmentation, also significantly affect this path.
What would be the potential implications for Asia and beyond from these different growth paths? In our latest Regional Economic Outlook for Asia and the Pacific, we assess the potential effects of a downside scenario from ‘de-risking’ between China and Organisation for Economic Co-operation and Development economies.
As the Chart of the Week shows (ABOVE RIGHT), so-called de-risking strategies by China and the United States and other OECD countries that aim to reshore production domestically or friend-shore away from one another can result in a significant drag on growth around the world even assuming no new trade restrictions with third countries—especially in Asia.
While reshoring would be particularly painful to everyone, it is notable that friend-shoring does not generate net benefits for third countries in the long term. That’s because the benefits from trade diversion are offset by the effects of the contractions in both China and the OECD.
For the region, the results suggest that third countries should not expect to passively benefit from friend-shoring policies, but rather actively pursue reforms that can help them further integrate into global supply chains. For systemic economies around the world, there is an urgent need for constructive dialogue to resolve underlying sources of tensions and resist costly fragmentation outcomes.
In China, the risks that fragmentation poses on medium-term growth underscore the need for comprehensive structural reforms that would help income levels converge more rapidly with those in advanced economies—such as closing productivity gaps between state-owned and private firms and further opening up sectors to competition. Our research shows that achieving this would also have significant positive spillovers for other economies in Asia.
DE-COUPLING v DE-RISKING
Extracted and reformated from Foreign Policy
De-risking is the new buzzword in Washington. This marks a notable shift, because until April, when U.S. National Security Advisor Jake Sullivan gave a speech on the topic, the talk was all about decoupling the U.S. economy from China’s. Decoupling suggests a radical separation, whereas de-risking—a term that initially comes from the financial sector—implies curbing risks while avoiding a clean break.
Decoupling reflected a simple idea: The fewer ties to China—an authoritarian state with little interest in playing by the rules—the better for the United States, both in economic and security terms. The concept of “de-risking,” on the other hand, remains murky and vague. What is de-risking, why does the vocabulary change matter, and how does de-risking work in practice? This brief user’s manual tries to answer these questions.
1. THE BACKGROUND: Why did U.S. policymakers abandon decoupling? Three factors explain why most U.S. policymakers now assume that cutting all economic ties with China is both undesirable and (probably) impossible.
1- The Chinese economy is too big for decoupling to be a realistic prospect. China is the world’s largest manufacturer of goods, with an output equivalent to that of all U.S., German, and Japanese factories combined. Under a decoupling scenario, goods shortages would be likely, and inflation would spike as U.S. firms struggle to source products. In addition, Chinese supremacy in producing dishwashers, computers, or toys does not threaten U.S. interests. Cutting ties to China in such noncritical sectors—as decoupling would —is not needed.
2- A U.S.-China decoupling would accelerate the fragmentation of the global economic landscape. Under a decoupling scenario, all countries around the world would have to pick sides between the United States and China. This could yield unpleasant surprises for Washington. China is the biggest trading partner of the majority of countries, and the citizens of many emerging economies appear to prefer China over the United States. As a result, decoupling could well backfire: It would deepen China’s global influence by forcing countries to shift away from the United States.
3- Cutting all ties to China would diminish those economic interdependences that give Washington leverage over Beijing. Partners have much to lose if relations sour, but adversaries do not. U.S. sanctions on China—for instance, the ones that would be imposed if a conflict were to erupt in Taiwan—would be toothless if Washington and Beijing did not have trade and financial ties anymore. To put things differently, economic interdependences between the United States and China benefit U.S. security; they act as a deterrent against China’s territorial ambitions.
2. THE CONCEPT: What is de-risking, and what are its objectives? U.S. policymakers have never presented a precise definition of de-risking. In a broad sense, it entails mitigating the vulnerabilities posed by deep economic ties between the United States and China. Looking at the end goals of de-risking is probably the best way to define the concept.
The first objective is to cement the United States’ role as the world’s technological leader. One key U.S. assumption is that technology will be an ever-growing determinant of economic might in a digitalized, connected world. The Biden administration believes that Chinese technological firms closing the gap with their U.S. counterparts presents a risk to U.S. superiority. In other words, U.S. policymakers are coming to terms with the idea that despite the current bout of grim economic problems, China will still become the world’s largest economy by 2040. They’re (almost) fine with this, but they want the United States to remain the economy that matters the most.
In practice, de-risking seeks to curb China’s access to top-notch U.S. innovation, thereby preventing Chinese firms from using U.S. know-how to climb the innovation ladder. Unlike decoupling, de-risking does not seek to curb Chinese access to less sophisticated U.S. technology.
The second goal is to slow the progress of the Chinese military. The United States remains the world’s leading military power, but the Chinese army is catching up fast, supporting Beijing’s ambitions to control Taiwan. De-risking seeks to prevent the Chinese army from accessing advanced U.S. technology with military applications—for instance, dual-use microchips that can be deployed in missiles. This second objective highlights how de-risking spans both economics and defense.
The third objective is to reduce overreliance on China for critical goods. The COVID-19 pandemic made the world realize that China is a major producer of medicines, medical equipment, and other crucial goods—presenting a risk to the safety of U.S. supplies in times of crisis. Mitigating risk by relocating the production of critical raw materials and goods to U.S. soil is therefore a key feature of Washington’s de-risking plans.
3. THE PRIORITIES: Where will U.S. policymakers focus their efforts? De-risking is a selective process: In contrast to decoupling, the United States does not seek to cut all ties to China. Instead, Washington will focus its efforts in three areas: information technology, energy, and biotech.
The information technology sector is the first area of focus, notably in semiconductors, artificial intelligence (AI), and quantum computing. The U.S. reasoning is simple: Because these three technologies can be used for both civilian and military purposes, a situation where Chinese firms become the most advanced in these fields presents a security risk. U.S. firms are still the market leaders here, but Chinese institutions are doubling down on efforts to catch up. Two data points say it all: First, Chinese financing for AI at least matches that of the Pentagon. Second, China accounts for half of global public financing for quantum computing—and seven times that of Washington.
The energy sector will be another priority, highlighting how de-risking is linked to the fight against climate change. As Sullivan noted, the United States wants to avoid seeing clean-energy supply chains weaponized like oil was in the 1970s. Although the United States would not suddenly come to a standstill like it did during the Arab oil boycott, a Chinese green tech embargo would put the energy transition at risk. Washington wants to ensure the safety of supplies for critical raw materials (such as lithium), technologies (including electric-vehicle batteries), and equipment (such as solar panels) that will be crucial to a net-zero economy.
Biotech is the third-priority sector for U.S. policymakers. China’s biotech sector has gone through a rough patch lately, but it is still growing fast, and the country wants to become a global leader in the field in the coming decade. To an even greater extent than the IT sector, biotech relies on knowledge and access to data or algorithms that can be transmitted via email or a simple digital storage medium. For U.S. policymakers, this is an additional headache; blocking the transfer of knowledge and data will be far harder than stopping the physical export of sensitive goods.
4. THE TOOLBOX: How will Washington implement de-risking? The de-risking enterprise is prompting a major overhaul of the United States’ economic policy toolkit. Three types of policies, in particular, have been resurrected from the past.
The first resurrection is that of export controls. Such policies were widely used during the Cold War to prevent the former Soviet Union from accessing dual-use technologies (i.e., those that have both civilian and military applications). After roughly two decades of disuse, these policies now form the linchpin of U.S. efforts to slow down China’s technological advances. After semiconductors last year, quantum computing and AI are the likely next targets of sweeping U.S. export controls.
The Second, industrial policy is making a comeback. The $369 billion Inflation Reduction Act, which focuses on energy security and climate policy, marked a U-turn for U.S. economic policy. After decades of relative laissez faire, Washington is seeking to help U.S. companies grow and make de-risking an opportunity for U.S. workers. That the Biden administration is now seeking to control both inbound and outbound investment, which would restrict the ability of U.S. firms to set up production lines in China, is another U-turn. It highlights how Washington will not shy away from imposing policies that would have looked too intrusive only a few years ago.
The third revival has to do with U.S. cooperation with allies and like-minded partners. The G-7 summit, for instance, used to be of little relevance; now it is a key forum for advanced democracies to discuss de-risking and China’s advances. Washington is also doubling down on bilateral initiatives such as the United States-Japan Critical Minerals Agreement and the U.S.-EU Trade and Technology Council—the latter a trans-Atlantic platform where topics for discussion include AI, technology standards, and critical materials.
None of this will be friction-free. U.S. plans to cooperate with allies do not mean that de-risking will work in those allies’ interests. The United States, much of Europe, and some of the Asian democracies are military allies, but they are also economic competitors—and economic interests are often a zero-sum game. Even if the United States and its allies are increasingly on the same page regarding the challenges posed by China, it is a safe bet that U.S. de-risking policies will fuel tensions with Europe and other partners instead of curbing them.
Q3 EARNINGS SEASON
 Q3 EARNINGS REPORTS SO FAR:
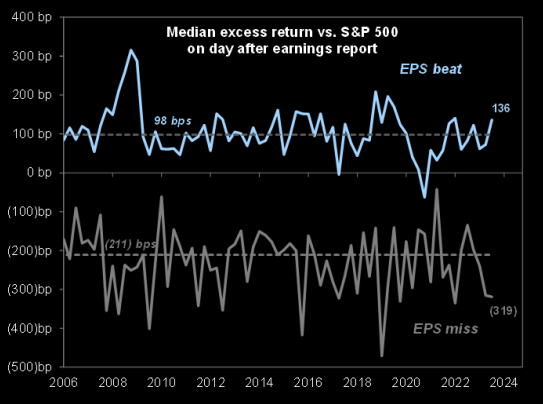
1. 56% beat earnings estimates by >1SD.This is higher than the historical average of 48%.
2. Only 10% missed estimates by >1SD. This is lower than the historical average of 13%.
3. Firms beating earnings by at least 1SD:Outperformed the S&P 500 by +136bps post-reporting. This is better than the historical average of +98bps.
4. Companies missing earnings by at least 1SD:Underperformed the S&P 500 by -319bps. This is worse than the historical average of -211bps. (via GS)
CHART ABOVE RIGHT: Trading Reaction to “Beats” and “Misses”./
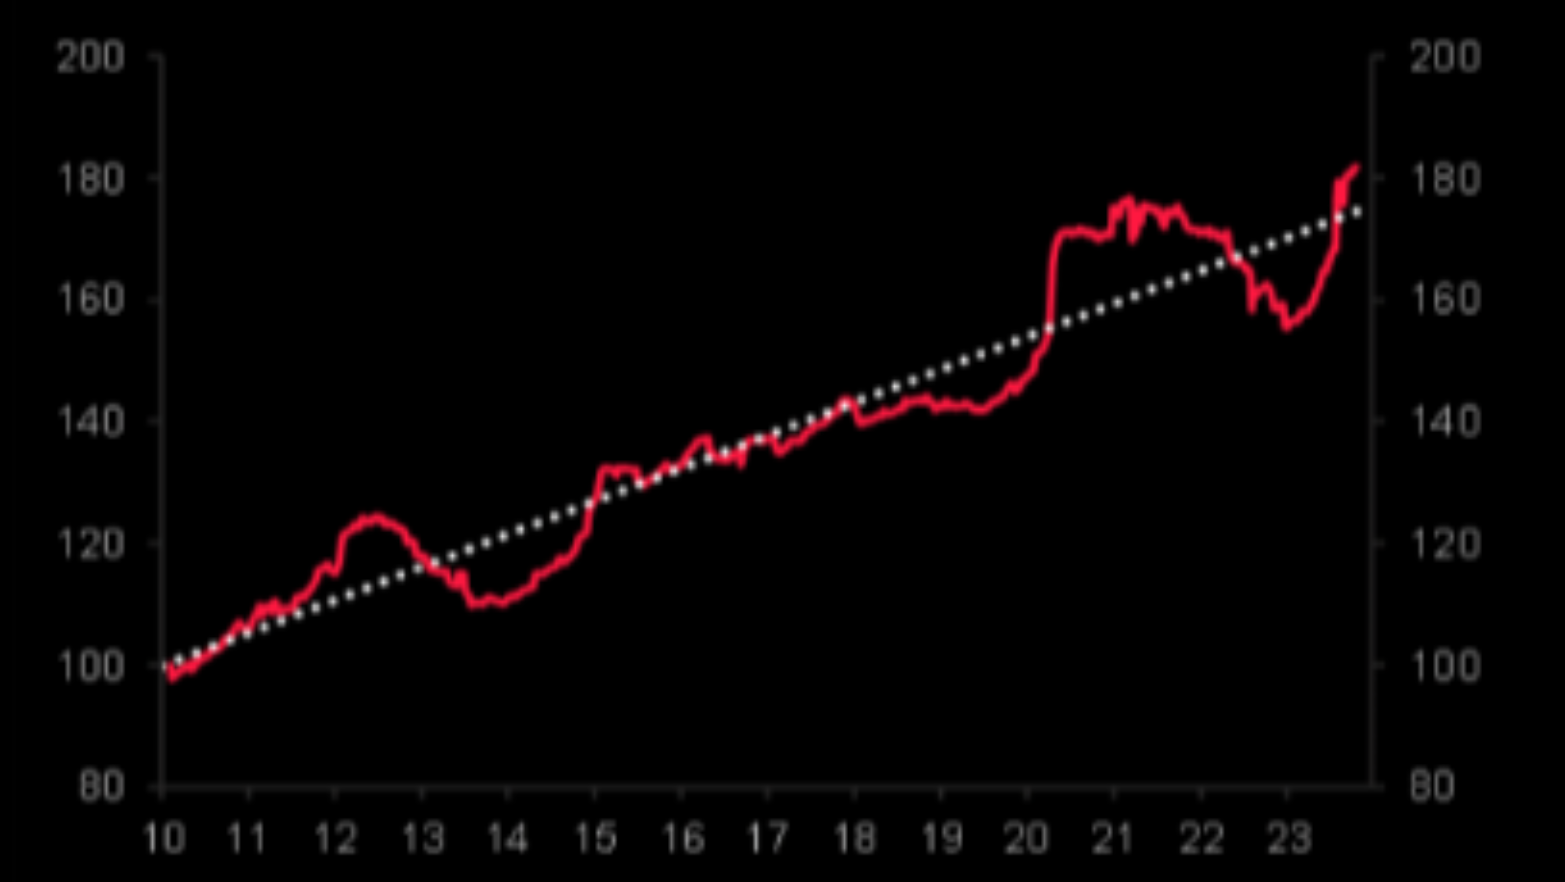 CHART RIGHT: The Eanrings being delivered are not in the overall S&P 500 nor the Nasdaq and Russell 2000 but rather in the Nasdaq 100.
The chart to the right compares EPS of the Nasdaq 100 to the S&P 500.
CHART BELOW: The US earnings outlook is deteriorating rapidly. Barclays strategists say full-year guidance “looks unusually soft” for this time of year, while the number of profit warnings are already trending toward season-highs with about half of the S&P 500 still to report.
MAGNIFICENT SEVEN – AAPL+AMZN+META+GOOG+NVDA+MSFT+TSLA
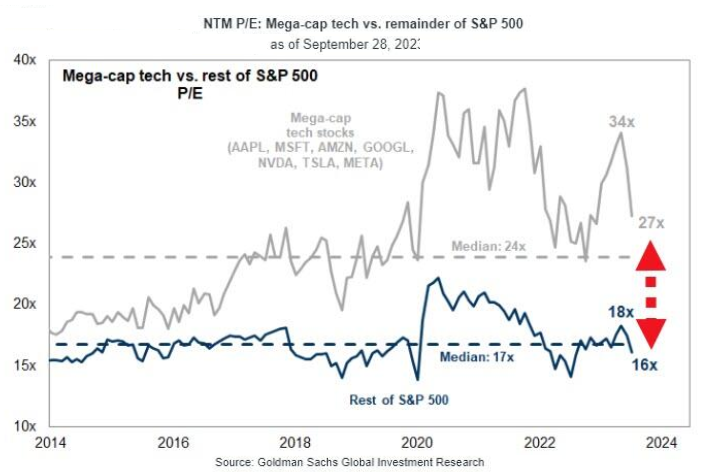 The Magnificant Seven’s valuation is well off its high. Mega-cap Tech still trades at a significant premium to the other 493 stocks in the S&P 500. (Chart Right)
CHART BELOW
Meanwhile momentum in the Magnificent Seven is clearly waning. In the chart below we show the rolling 3-month contribution of “magnificent 7” to overall S&P 500 performance.
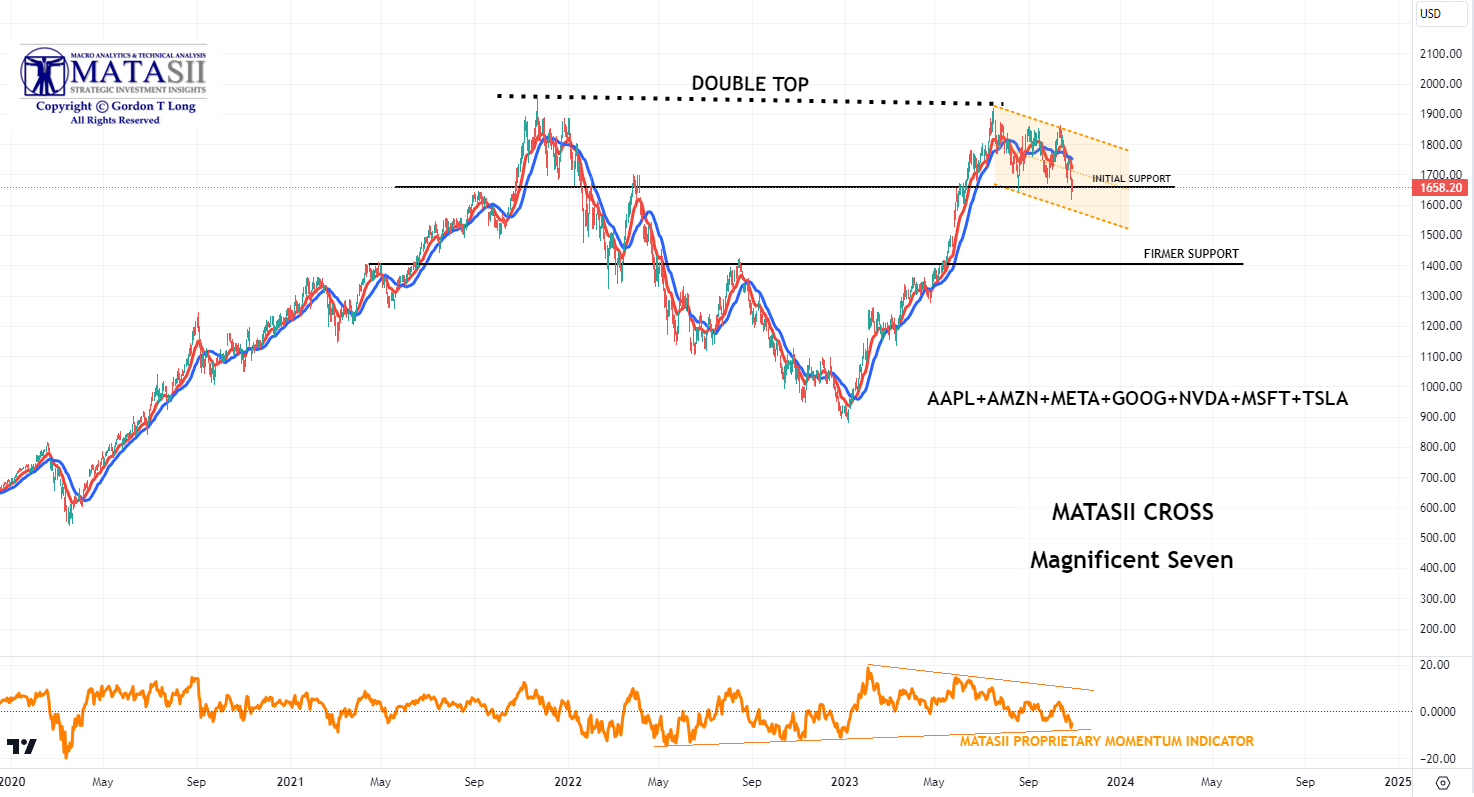
MAGNIFICENT SEVEN – WEEKLY
WE ARE A POTENTIAL MATASII CROSS SELL SIGNAL (Weekly Chart)!
For the MATASII Cross to give a SELL signal the red line must decisively cross the blue line. We are potentially close but we do not have an Intermediate Term Cross.
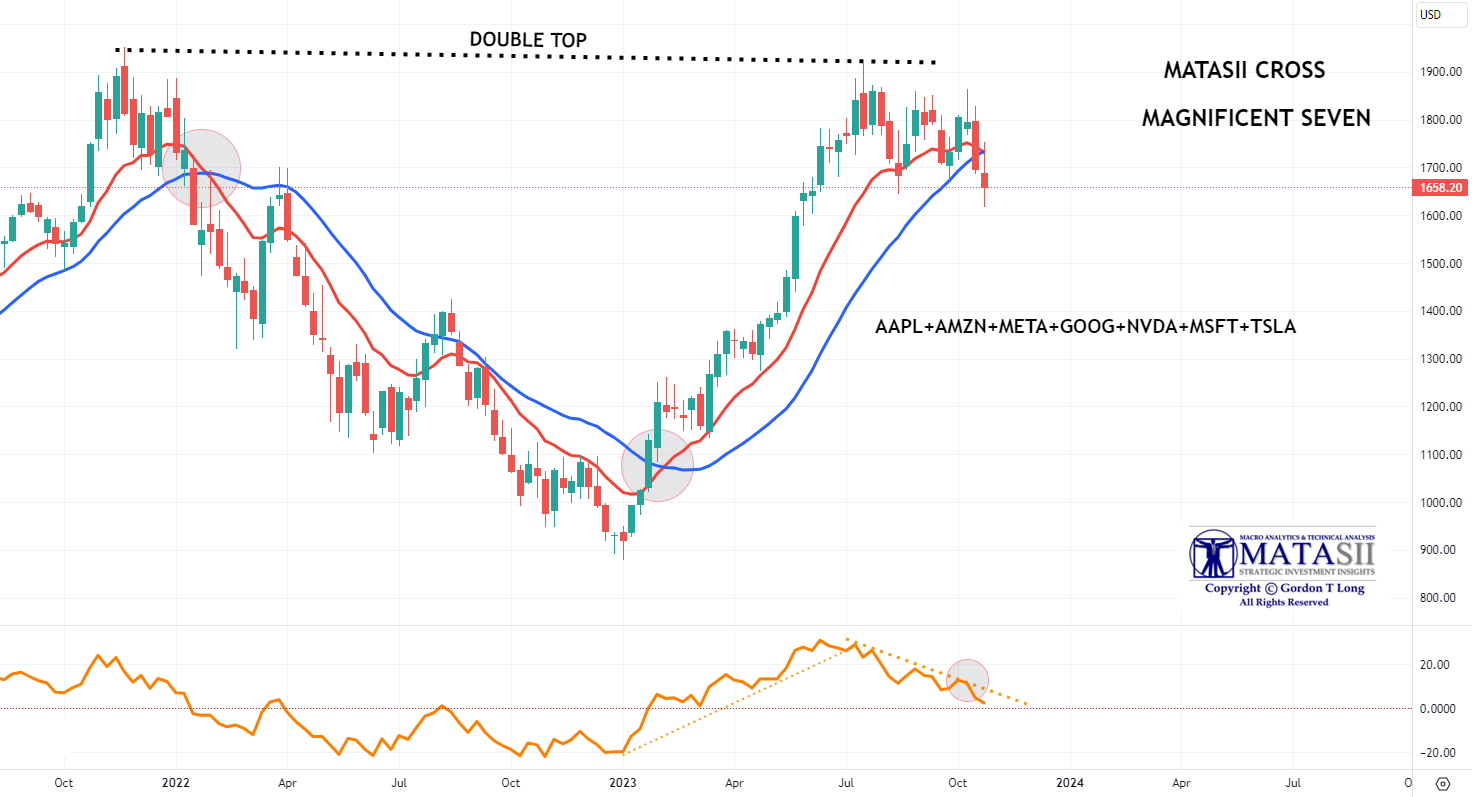
MAGNIFICENT SEVEN – DAILY
WE HAVE A MATASII CROSS SELL SIGNAL (Daily Chart)!
We have a short term MATASII Cross SELL Signal but it needs further development based on the prior reversals since the recent high.
YOUR DESK TOP / TABLET / PHONE ANNOTATED CHART
Macro Analytics Chart Above: SUBSCRIBER LINK
-
- Apple (AAPL): Apple today announced financial results for its fiscal 2023 third quarter ended July 1, 2023. The Company posted quarterly revenue of $81.8 billion, down 1 percent year over year, and quarterly earnings per diluted share of $1.26, up 5 percent year over year
- Amazon.com Inc (AMZN) Q3 2023 (USD): EPS 0.94 (exp. 0.58), Revenue 143.1bln (exp. 141.41bln). Q4 23 net sales view 160-167bln (exp. 167bln). Q3 23 Operating income USD 11.19bln (exp. 7.71bln). Online stores net sales USD 57.27bln (exp. 56.82bln). Physical Stores net sales 4.96bln (exp. 4.99bln). Third-Party Seller Services net sales 34.34bln (exp. 33.4bln). Subscription Services net sales 10.17bln (exp. 10.13bln). AWS net sales USD 23.06bln (exp. 23.13bln). North America net sales USD 87.89bln (exp. 87.12bln). International net sales USD 32.14bln (exp. 32.08bln). Operating margin 7.8% (exp. 5.46%). Co. said it is seeing the pace and volume of closed AWS deals pick up. CFO said the Co. still sees customers being cautious on price, is using AI to show more relevant ads to shoppers. Lower inflation helped it with regard to certain shipping rates. Cost optimisation work in cloud is starting to slow down
- Meta Platforms Inc (META) Q3 2023 (USD): EPS 4.39 (exp. 3.63), Revenue 34.15bln (exp. 33.56bln); Q4 revenue view 36.5-40bln (exp. 38.76bln). Operating margin 40% (exp. 33.9%). REVENUE BREAKDOWN: Advertising 33.64bln (exp. 32.94bln). Family of Apps 33.94bln (exp. 33.08bln). Reality Labs 210mln (exp. 313.4mln). Other 293mln (exp. 212.7mln)
- Alphabet Inc (GOOGL) – Q3 2023 (USD): EPS 1.55 (exp. 1.45), Revenue 76.69bln (exp. 75.9bln), Revenue ex-TAC 64.05bln (exp. 63.04bln). Operating income 21.34bln (exp. 21.44bln). Google Services operating income 23.94bln (exp. 22.89bln). Google Cloud operating income 266mln (exp. 433.6mln). Operating margin 28% (exp. 28.1%). Click here for the full earnings. GUIDANCE: Q3 cloud growth reflects customer optimization efforts; expects Q4 headwinds in hardware segment. CEO says customers are ‘starting to optimize spend’ on cloud computing. CFO feels “good about where we’re sitting” with cloud computing growth – Shares fell 5.9% after-market.
- Nvidia (NVDA) – For the third quarter of 2023, NVIDIA (NVDA) reported Revenue of $5.93 billion, down 12% from the previous quarter and 17% from the previous year. Earnings per share (EPS) of $0.58, adjusted, versus $0.69 expected. GAAP earnings per diluted share of $0.27, down 72% from the previous year and up 4% from the previous quarter. NVIDIA’s record data center and automotive revenue was offset by declines in gaming and pro visualization platforms. The company returned $3.75 billion to shareholders in the form of share repurchases and cash dividends. NVIDIA’s Q3 2024 earnings report is scheduled for November 21, 2023. The consensus EPS forecast is $3.32.
- Microsoft Corp (MSFT) – Q1 2024 (USD): EPS 2.99 (exp. 2.65), Revenue 56.5bln (exp. 54.5bln). Cloud Revenue 31.8bln (exp. 31.19bln). Productivity Revenue 18.59bln (exp. 18.29bln). Returned USD 9.1bln to holder. Dynamics products and cloud services revenue increased 22%. Click here for the full earnings. GUIDANCE: Q2 Productivity and Business 188.8-19.1bln (exp. 18.83bln). Intelligent Cloud 25.1-25.4bln (exp. 24.94bln). More Personal Computing 16.5-16.9bln (exp. 14.52bln). Bookings growth guided about flat Y/Y. Operating Expenses 15.5-15.6bln (exp. 15.06bln). COGS 19.4-19.6bln (exp. 19.09bln)
- Tesla (TSLA) – reported its third quarter 2023 earnings on October 18, 2023. Tesla’s earnings per share (EPS) were $0.66, which was lower than the expected $0.73. Revenue was $23.35 billion, which was lower than the expected $24.1 billion. Earnings were down from $1.05 per share in the same quarter a year ago. Revenue rose nearly 9% from $21.45 billion a year ago. Energy and service contributed over $0.5 billion to quarterly profit. FCF was $848M, down 74.28% year over year. Current ratio was 1.69, up 15.58% year over year. For the full year, ending in December, earnings are expected to decline 17.7% year over year to $3.35 per share. Revenue is expected to rise 21.7% year over year to $99.13 billion
GLOBAL ECONOMIC INDICATORS: What This Week’s Key Global Economic Releases Tell Us
 US Q3 ADVANCED GDP
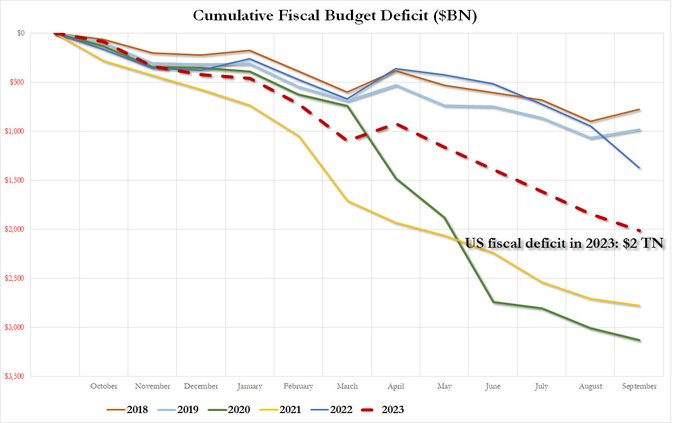
All it took was a “crisis-era” $2 trillion budget deficit (chart right)
Headline Q3 Advanced GDP print was hot, rising 4.9%, above the 4.3% forecast and accelerating from the 2.1% growth in Q2 with a large jump in consumer spending to 4.0% from 0.8% in Q2.
-
- The headline was within the wide range of forecasts with the most optimistic view forecasting 6% growth, and the most pessimistic seeing 2.5% growth, and it was beneath the Atlanta Fed GDPNow estimate of 5.4%.
- The PCE data for Q3 was slightly softer than expected at 2.4% (exp. 2.5%) and down from the prior 3.7%, while the PCE Price Index ex-Food/Energy/Housing rose 1.8%, easing from the 3.1% pace in Q2, while ex-Energy/Housing rose 3.6% (prev. +3.5% in Q2).
- It is worth noting that although the price metrics were softer than expected, Q3 covers from July-September, we have already seen the September CPI data and the September PCE report is due on Friday for a more timely picture.
- Although Q3 was hot, ING (and many other analysts) expect this growth to slow for Q4, noting “the headwinds facing the economy and the household sector in particular are intensifying and we look for the pace of growth to slow to 1.5% in the final three months of the year”.
US PCE
 The US PCE was overall in line with expectations.
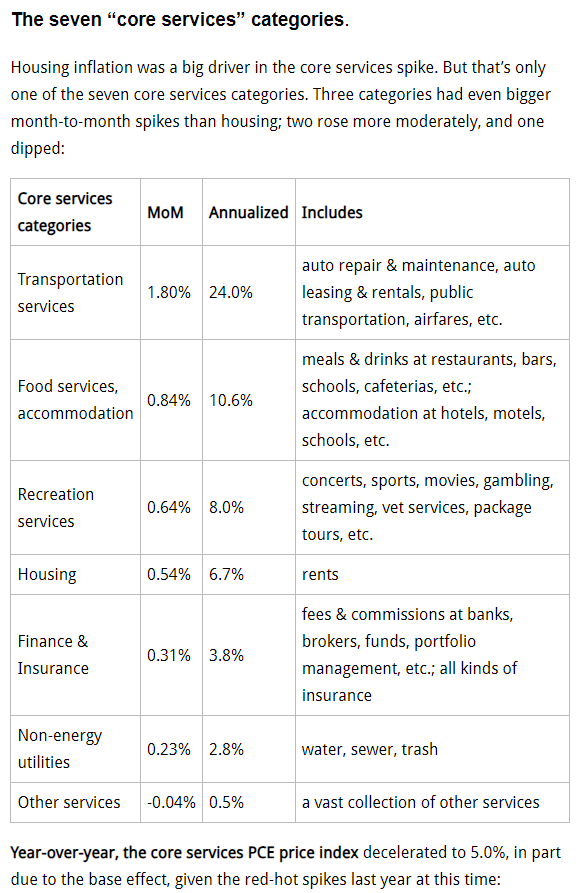
The spike in inflation in “core services” (all services except energy services) was the big nasty surprise.
The PCE price index for September. “Core services” is the index that Fed chair Jerome Powell has been hammering on, especially “core services without housing” because housing inflation is already coming down, and it’s just lagging etc., etc.. The other core services were in his focus because their inflation rates sort of refused to come down. The “Core Services” PCE price index spiked by 0.45% in September from August (5.5% annualized), driven in part by the spike in housing, and in part by even bigger spikes in three of the remaining six core services categories. (see chart right)
-
- The Core rose 3.7% Y/Y and the M/M rose 0.3%, in line with expectations, while the Headline Y/Y matched the consensus at 3.4% but the M/M was a touch above the forecast 0.3% at 0.4%.
- Personal Income rose by 0.3% in September, slightly beneath the 0.4% expectation but consumption beat, rising 0.7% (exp. 0.5%).
- ING summarises the data as “US inflation remains somewhat sticky, but intensifying concerns are now coming to the fore over the path for real household disposable income – the key driver of consumer spending.” The desk notes that unless this turns around quickly, a recession will start to look more likely which would see inflation fall faster than the Fed expects.
- The first rate cut is currently fully priced in by July, with a high probability of it occurring in June, with markets largely leaning towards the Fed being done with rate hikes.
- Nonetheless, the FOMC is next week and although no hike is expected, Powell may opt to maintain optionality and stress rate cuts are not expected any time soon.
GLOBAL MACRO
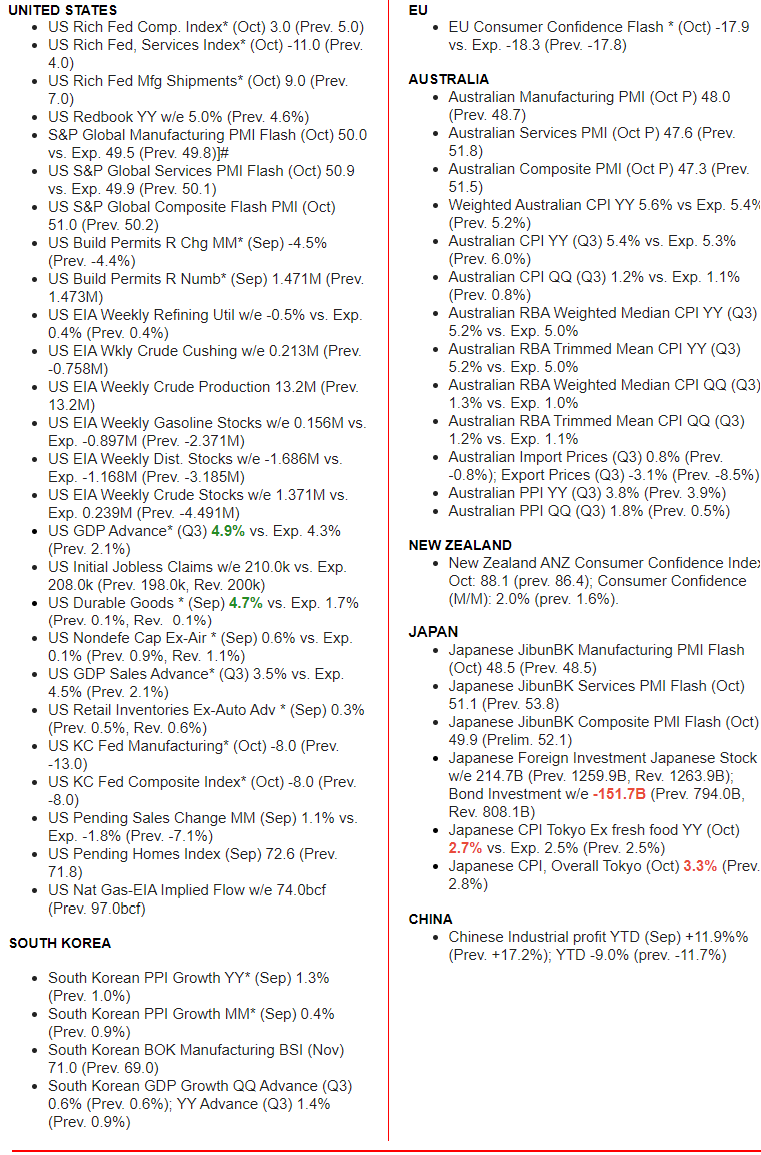
WHAT DOES YOUR SCAN OF THE DATA BELOW TELL YOU? – THE MEDIA AVOIDS BAD NEWS!
We present the data in a way you can quickly see what is happening.
THIS WEEK WE SAW
Exp=Expectations, Rev=Revision, Prev=Previous
DEVELOPMENTS TO WATCH
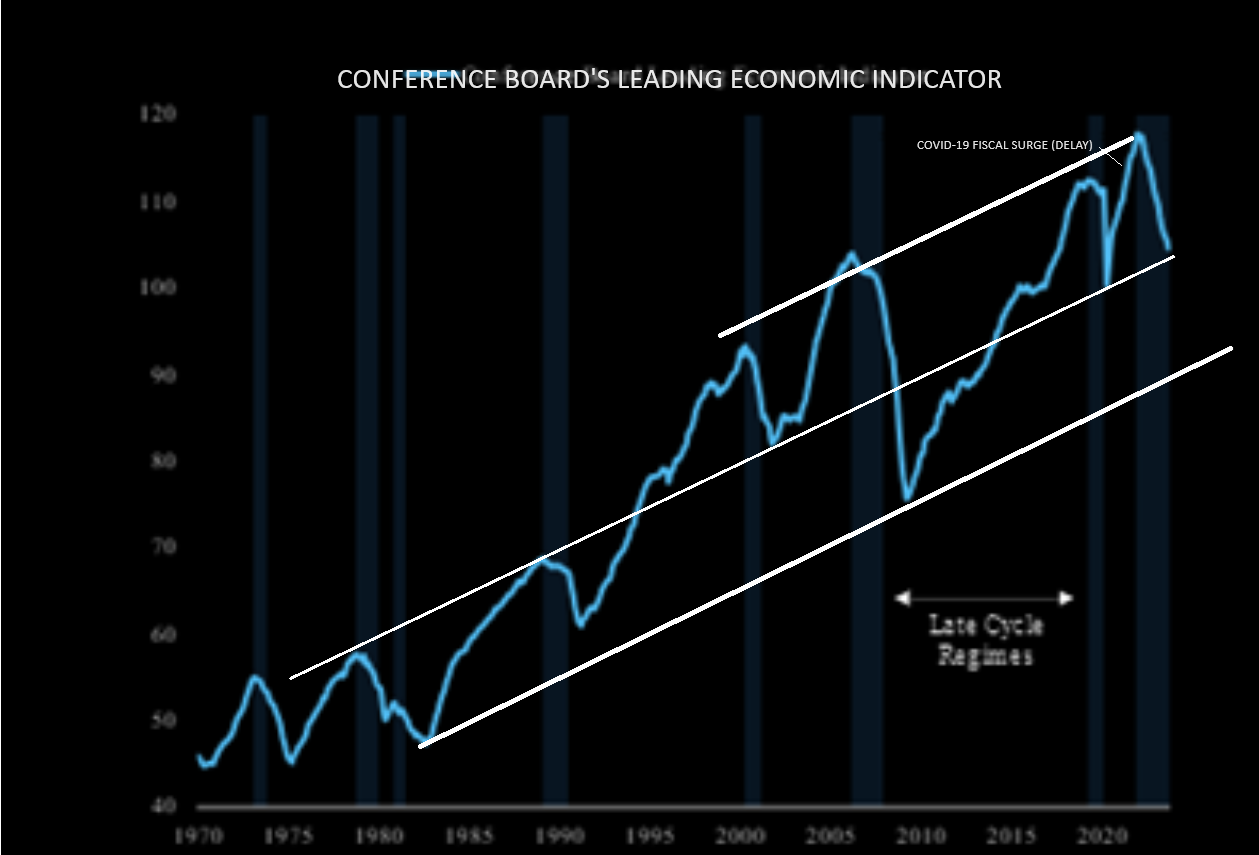 INDICATIONS OF LATE CYCLE
The current Macro backdrop supports the notion that we are in late cycle environment when viewed by the Conference Boards Leading Economic Indicator – (LEI). Chart Right
CHART BELOW
We have long held that the market operates in “Fractals” at various levels of degree. The fractal below suggests the Dotcom Bubble implosion was just a “warm up” for what possibility lies ahead?
CHINESE CREDIT SPIGOT BEGINNING TO OPEN
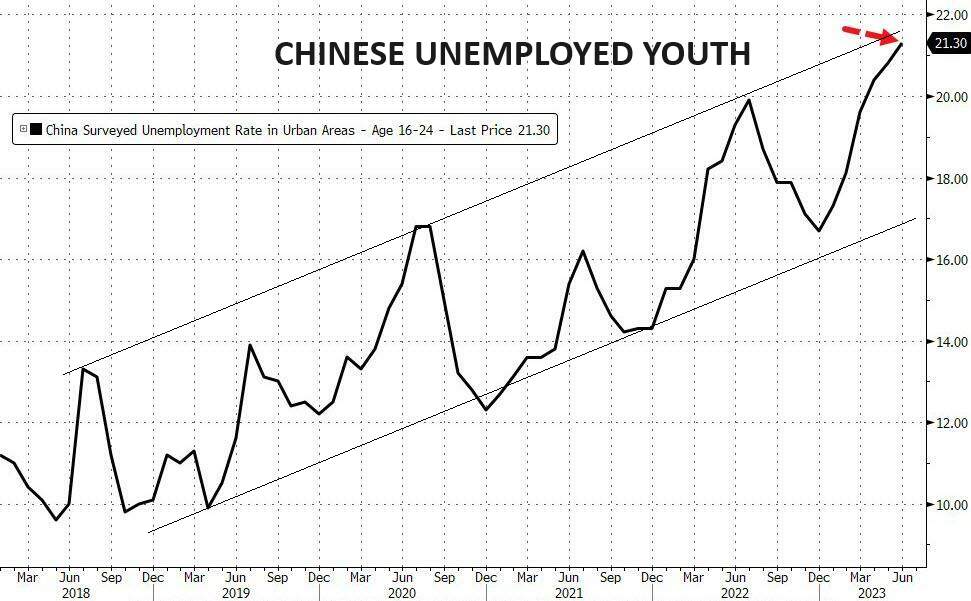 Badly trailing US economic growth, President Xi Jinping stepped up support for the world’s second-biggest economy, issuing additional sovereign debt, raising the budget deficit ratio and even making an unprecedented visit to the central bank.
China took the first official step to a powerful fiscal stimulus when China’s legislature announced it would issue 1 trillion yuan ($137 billion) of special treasury bonds during the fourth quarter, expanding budgeted fiscal deficit rates to around 3.8% for the year, well above the 3% set in March which the government has generally considered a red-line “limit” for the nation.
“Relevant authorities should make preparations for the sovereign bond issuance and projects in an active and orderly manner to ensure every penny is managed and used appropriately,” said Zhao Leji, chairman of the Standing Committee.
The funds raised through government bonds will all be allocated to local regions, via the mechanism of transfer payment, according to the plan approved by the country’s top legislature on Tuesday. The finance ministry said that the funds raised will be mostly used in eight areas including reconstruction after disaster, flood prevention and management projects, and natural disaster emergency response capacity improvement projects.
BIG TEST LEVELS ARE HERE
THE SLOW CHOKING BY CREDIT IS HAPPENING!
Click All Charts to Enlarge
1 – SITUATIONAL ANALYSIS
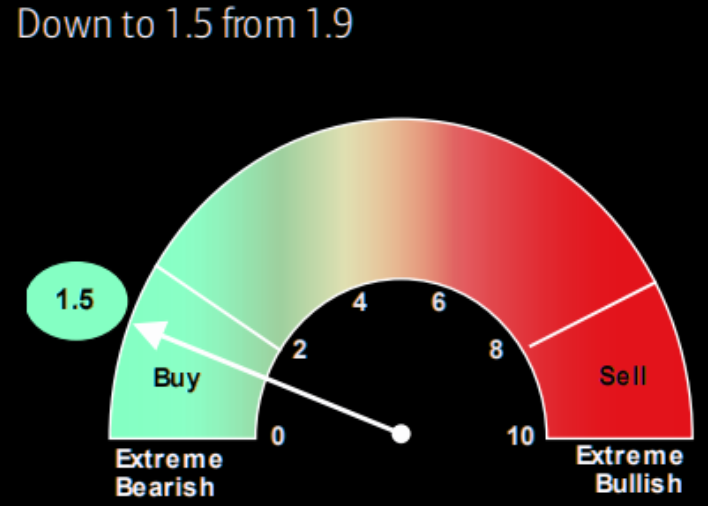 CAPITULATION OR CONSOLIDATION?
Fear has entered the markets which has resulted in a rapid movement to test critical technical support levels. Behind this is the impact of the slow choking impact of credit contraction.
The markets either capitulate lower from here or begin a support consolidation.
Markets are noticeably oversold and from a technical perspective are traditionally “ripe” for a bounce. The BofA’s contrarian bull/bear indicator (chart right) has started to flash a rather strong buy here. Note this indicator entered the contrarian buy a week ago already.
2 – FUNDAMENTAL ANALYSIS
 SLOW CHOCKING OF CREDIT CONTRACTION
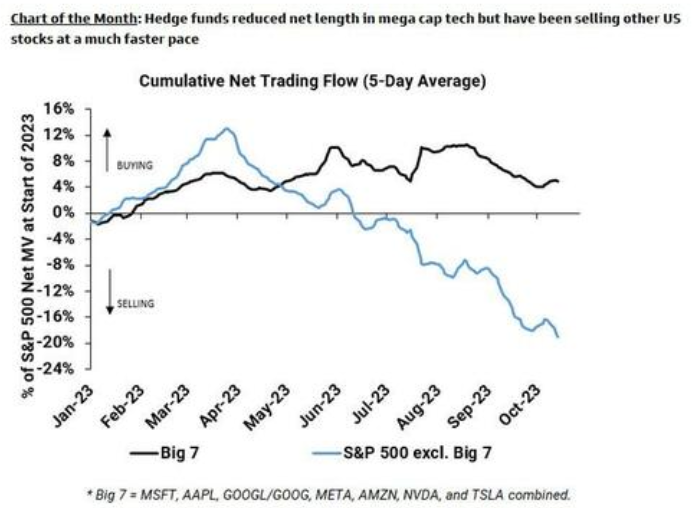
The slowing chocking of credit from global central banks balance sheets reductions (QT), contracting bank lending standards and a tightening Financial Conditions Index is now finally impacting the markets.
CHART RIGHT: The 5 day average of Cumulative Net Trading Flows (chart right) shows one reason why we are seeing market weakness.
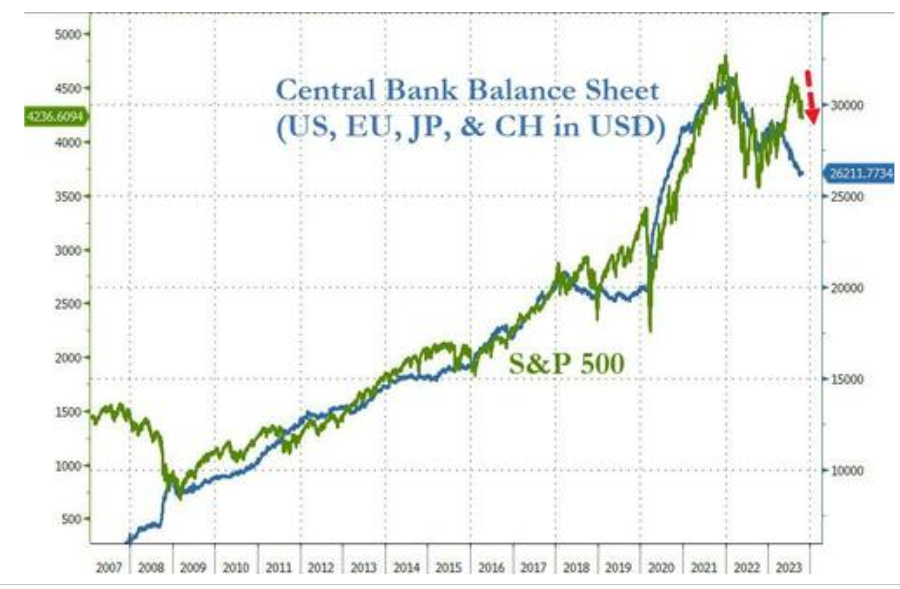
CHART BELOW: Global Central Bank Balance Sheet reductions versus the S&P 500 shows a divergence that minimally needs to be narrowed.
EQUIVALENT WEIGHT S&P500 v 1OY REAL YIELDS
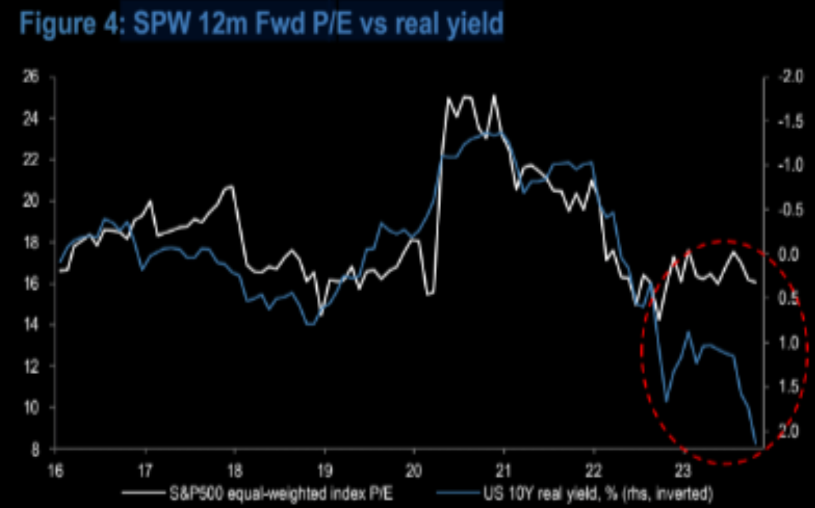 The Inverted 10Y Real Yield is plotted to the right against the Equal-Weighted S&P 500.
The divergence has become quite noticable suggesting equities should fall to some degree in the very near term.
However, as we see it there are a number of indicators suggesting that the markets are not yet at a stage for a “full scale” capitulation.
Many indicators do not yet look “climactic” nor at “Peak Fear”!
-
- The 3-month VIX vs VIX did not trigger a tactical climactic oversold reading below 1.0, which may be needed for a seasonal low for US equities,
- The NYSE has not had climactic selling from 90% down days and the daily ARMS Index (TRIN) closing above 2.0,
- The Goldman “Positioning & Sentiment” indicator is not screaming BUY right now,
- The AAII US investor sentiment is trending lower and S&P500 RSI is falling even further. However, it doesn’t seem to be enough,
- The 1-year S&P 500 beta for the top 10 stocks held by BofA private clients does not look like a total capitulation,
- The BofA private client cash holdings as % of AUM does not look like “Peak Fear”,
- Morgan Stanley notes that global funds were able to limit their losses to just 40bps, representing a fraction of what the MSCI was down (1.8% through Thursday). Therefore HF’s atr not yet hurting.
We suspect the equity markets soon bounces.
This suggests a consolidation begins versus a capitulation being ahead in the very near term
A broad swath of market views has lead us to this near term view.
3 – TECHNICAL ANALYSIS – BIG SUPPORT / RESISTANCE TEST LEVELS
ALMOST ALL MAJOR MARKETS ARE AT OR NEAR IMPORTANT SUPPORT OR RESISTANCE LEVELS
RUSSEL 2000 – DAILY
Equity ETFs: Long iShares Russell 2000 ETF (IWM)
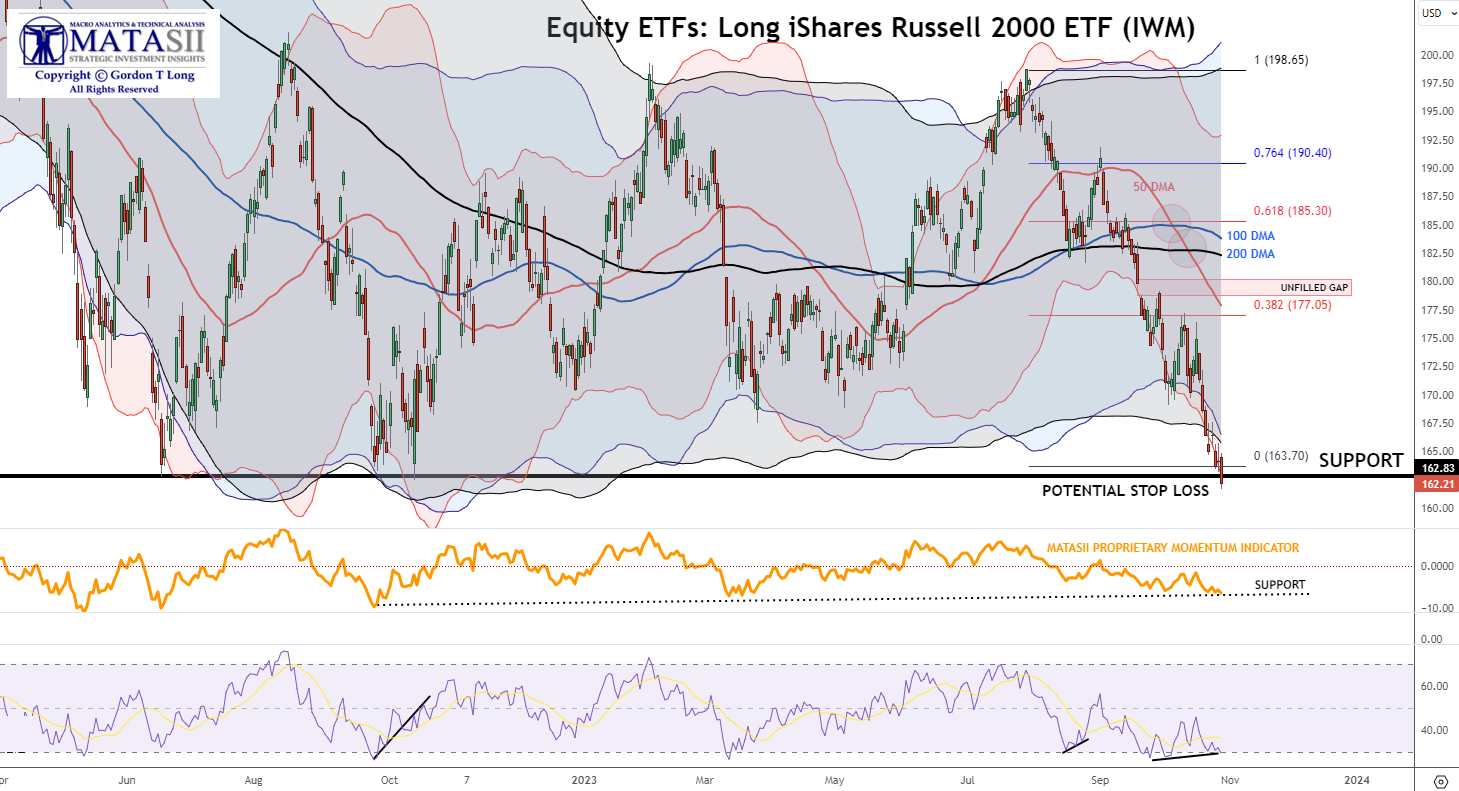
YOUR DESK TOP / TABLET / PHONE ANNOTATED CHART
Macro Analytics Chart Above: SUBSCRIBER LINK
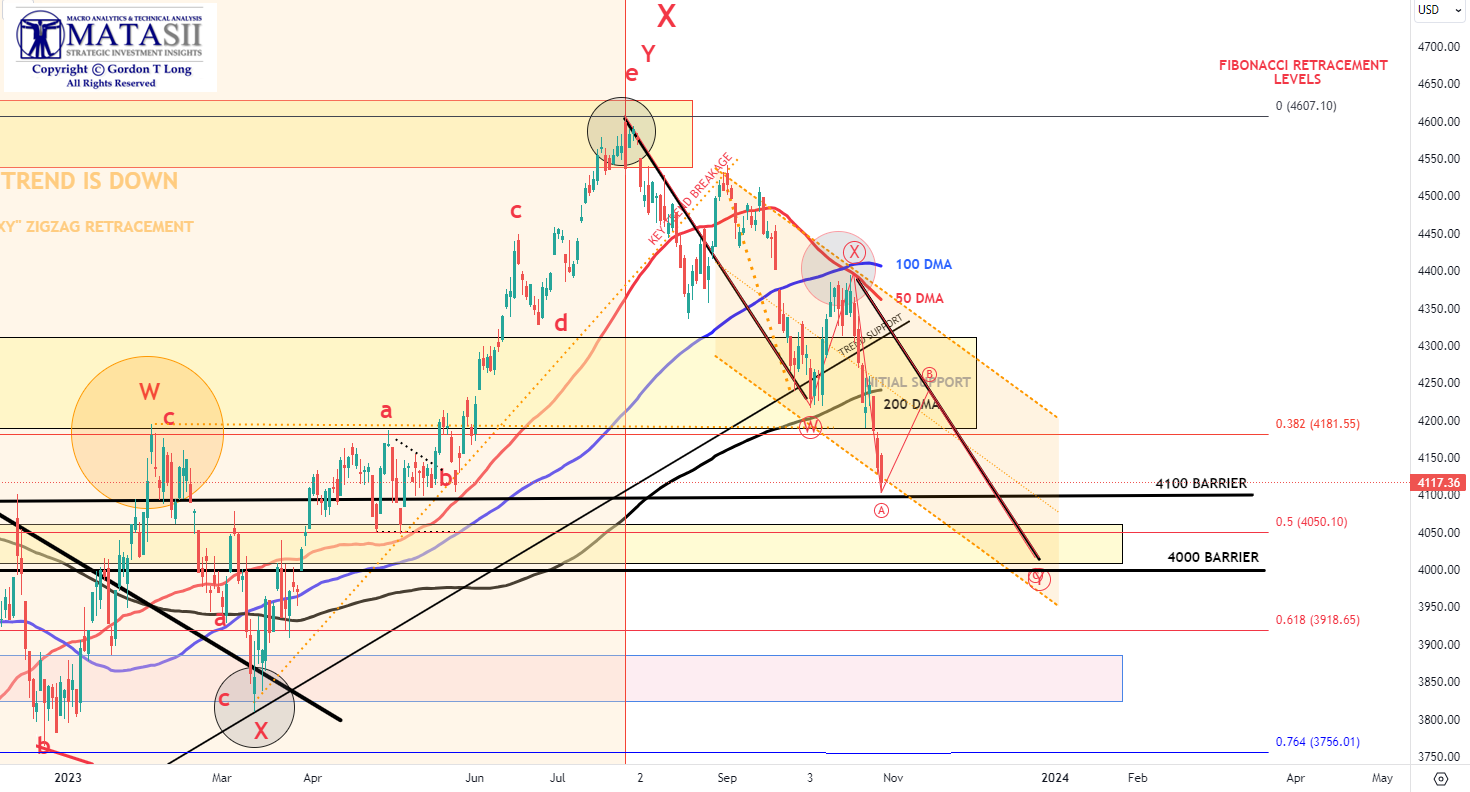
S&P 500 – DAILY
From the S&P 500 price highs in January 2022 until the lows in October 20220 the pattern was an Elliott Wave “WXY” pattern. The retracement from the October 2022 lows until the recent July price highs ere also a smaller degree. “WXY” pattern. We suspect the next leg down will also count as a “WXY” pattern which would make the fall since the January 2022 highs a textbook classic Elliott Wave Double ZigZag Combo Corrective pattern.
YOUR DESK TOP / TABLET / PHONE ANNOTATED CHART
Macro Analytics Chart Above: SUBSCRIBER LINK
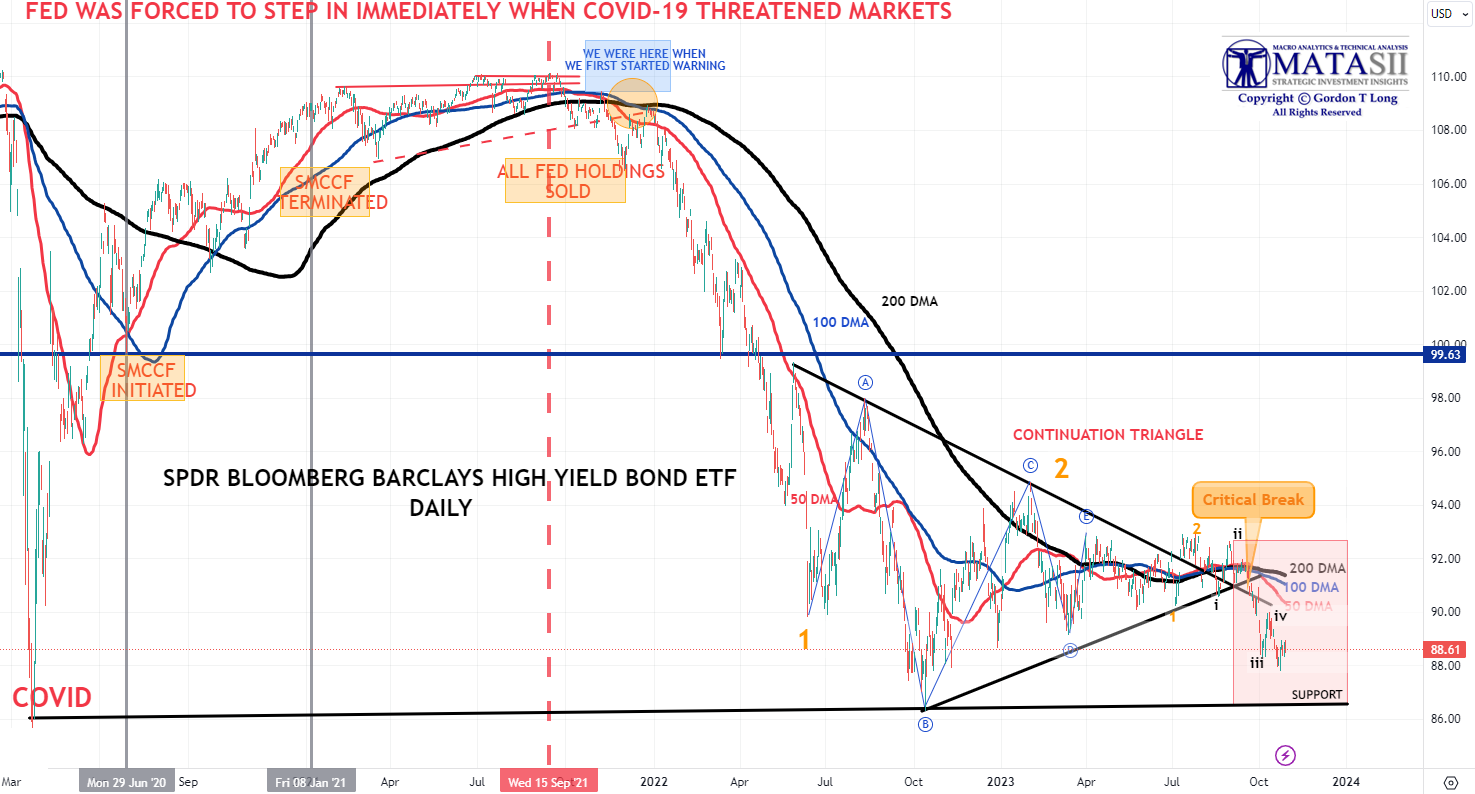
SPDR BLOOMBERG BARCLAYS HIGH YIELD BOND ETF – “JNK” – DAILY
The high yield “JNK” is approaching a critical support level. It is likely to bounce off it initially, test the descending black trend line before beginning a major drop, The triangle drawn is a classic technical analysis example of a “consolidation triangle”. These triangles are strong indicators the prior trend (down) will be continued.
YOUR DESK TOP / TABLET / PHONE ANNOTATED CHART
Macro Analytics Chart Above: SUBSCRIBER LINK
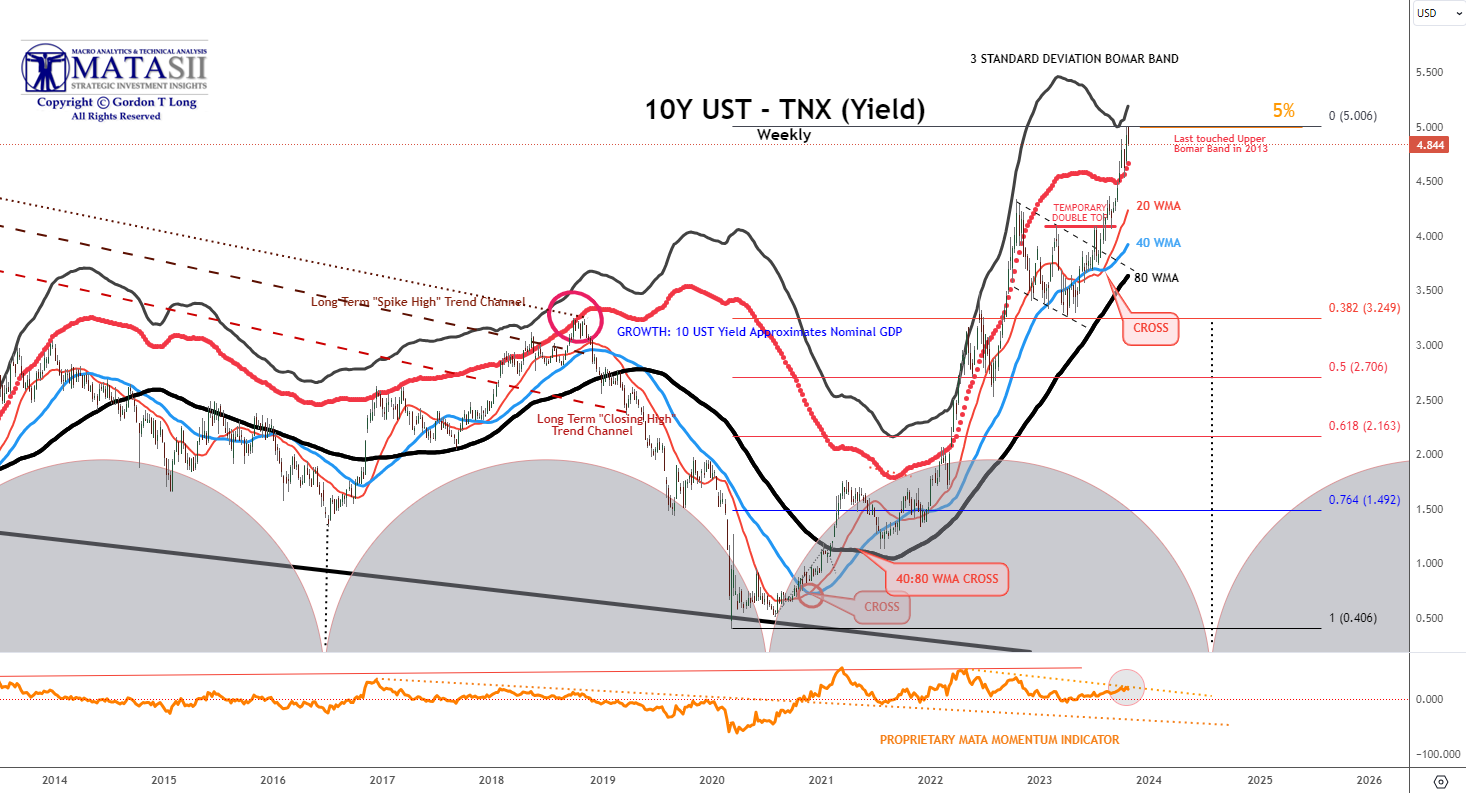
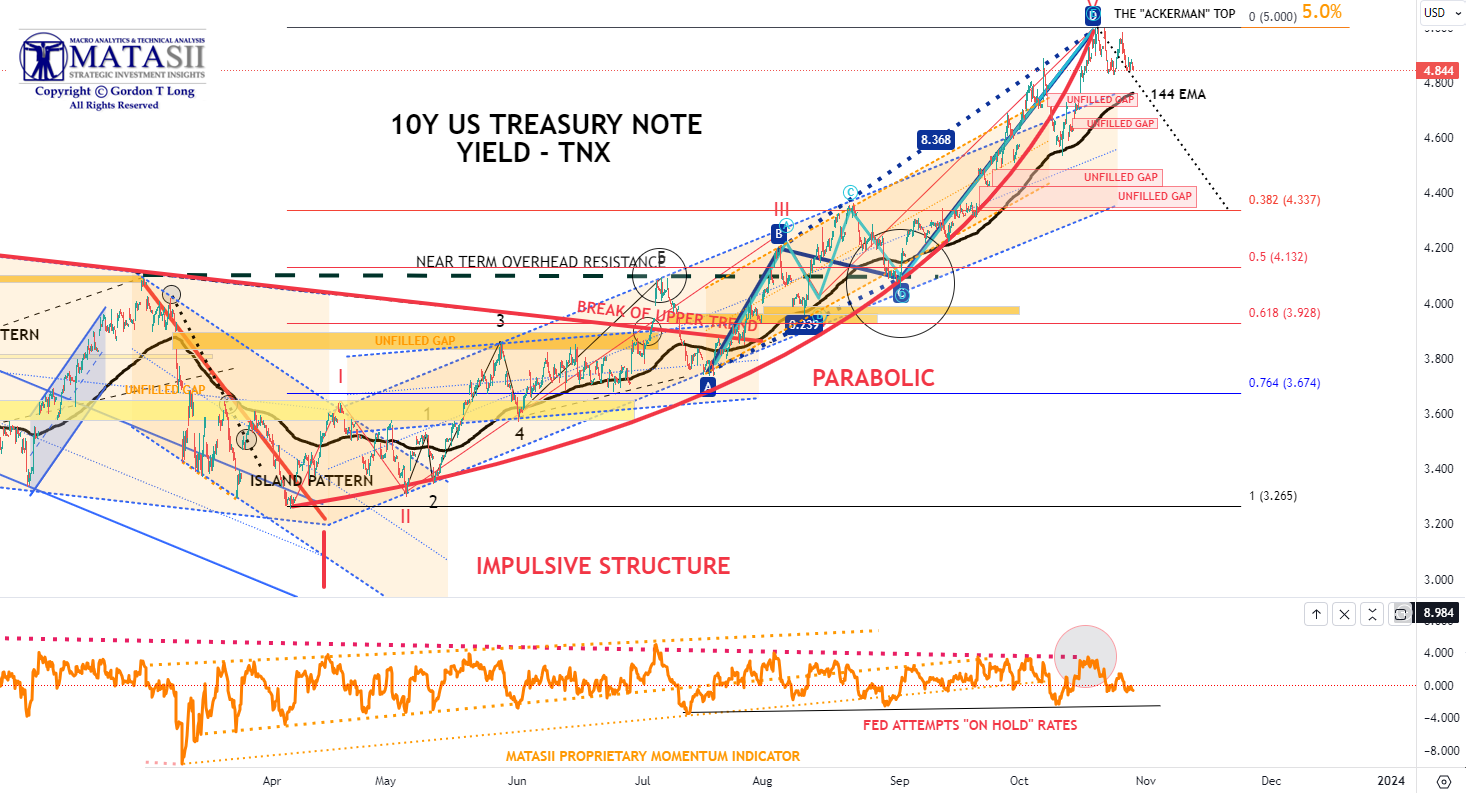
10Y US TREASURY YIELD – TNX – WEEKLY
We have either put in a Yield top in this cycle or we are very near to it in the US 10Y Treasury Yield. This cycle top should be considered an Intermediate high for the 10Y Treasury Yield.
We expect longer term for yields to be much higher unless the Federal Reserve implements Yield Curve Control (YCC) which would mean increasing the Fed’s Balance Sheet and debasing the US Dollar. How high yields go is more about assessing when the Federal Reserve will implement this new policy initiative (or some form of it).
YOUR DESK TOP / TABLET / PHONE ANNOTATED CHART
Macro Analytics Chart Above: SUBSCRIBER LINK
10Y US TREASURY YIELD – TNX – HOURLY
In the near term the TNX is likely to test the rising 144 EMA. There are a number of unfilled gaps between the current price level and a potential shallow Fibonacci Retracement of 38.2%. If yields are headed, it would be unusal for it to leave these gaps open without being filled buy a support consolidation test. Break-out gaps often go unfilled but this is ending a “Parabolic” lift (red curve) so has a relatively low probability of any of these being break-out gaps from these levels.
YOUR DESK TOP / TABLET / PHONE ANNOTATED CHART
Macro Analytics Chart Above: SUBSCRIBER LINK
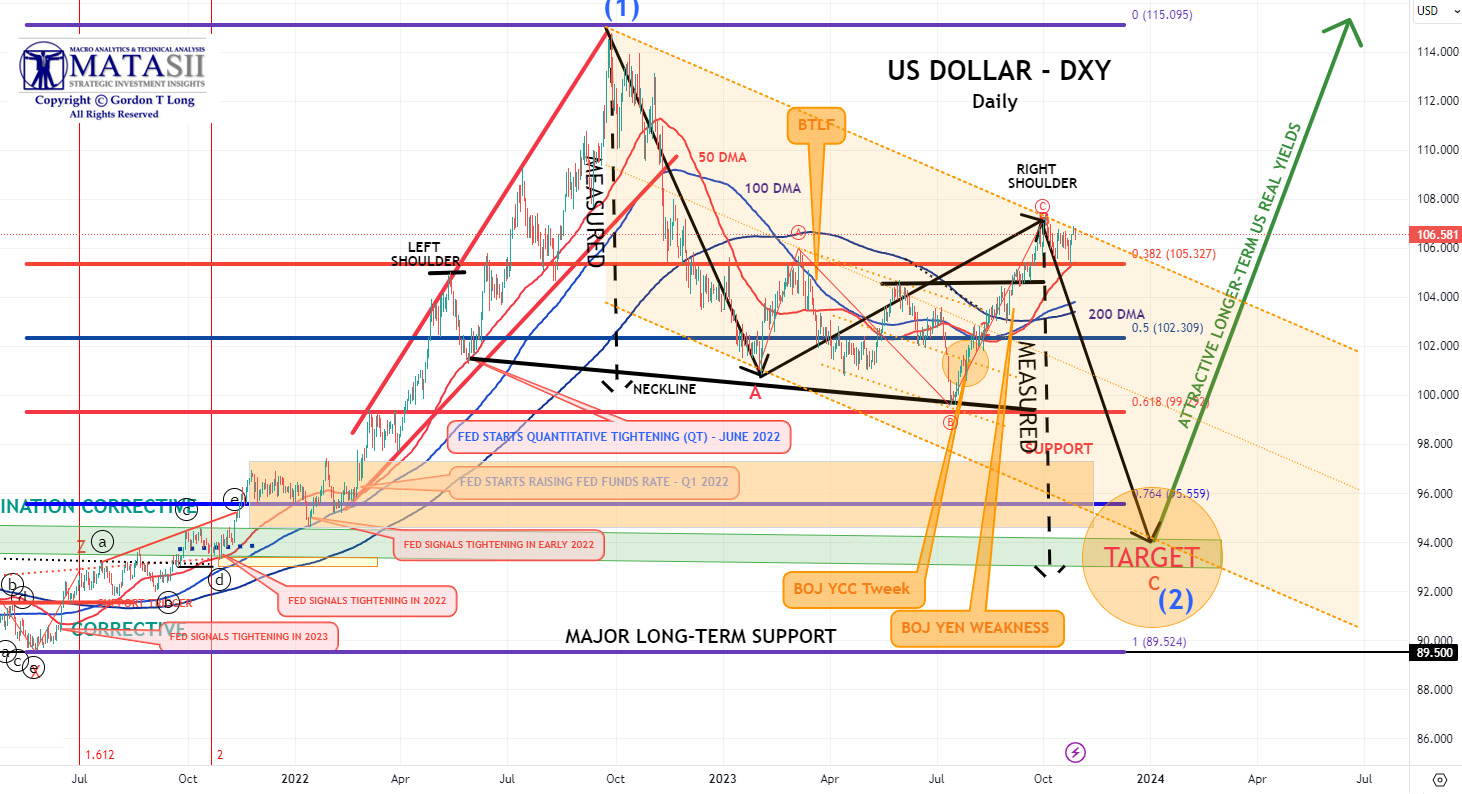
US DOLLAR – “DXY” – DAILY
The US Dollar appears to have put in a a short term top as part of a possible right shoulder of a Head & Shoulders pattern. The measured drop assoicated with the H&S pattern, if confirmed (needs to break the neckline), is highlighted. Even if this is not a H&S pattern we should still see a retracement to the longer term support at the 200 DMA level.
YOUR DESK TOP / TABLET / PHONE ANNOTATED CHART
Macro Analytics Chart Above: SUBSCRIBER LINK
FAIR USE NOTICE This site contains copyrighted material the use of which has not always been specifically authorized by the copyright owner. We are making such material available in our efforts to advance understanding of environmental, political, human rights, economic, democracy, scientific, and social justice issues, etc. We believe this constitutes a ‘fair use’ of any such copyrighted material as provided for in section 107 of the US Copyright Law. In accordance with Title 17 U.S.C. Section 107, the material on this site is distributed without profit to those who have expressed a prior interest in receiving the included information for research and educational purposes. If you wish to use copyrighted material from this site for purposes of your own that go beyond ‘fair use’, you must obtain permission from the copyright owner.
NOTICE Information on these pages contains forward-looking statements that involve risks and uncertainties. Markets and instruments profiled on this page are for informational purposes only and should not in any way come across as a recommendation to buy or sell in these assets. You should do your own thorough research before making any investment decisions. MATASII.com does not in any way guarantee that this information is free from mistakes, errors, or material misstatements. It also does not guarantee that this information is of a timely nature. Investing in Open Markets involves a great deal of risk, including the loss of all or a portion of your investment, as well as emotional distress. All risks, losses and costs associated with investing, including total loss of principal, are your responsibility.