Gordon T Long
Global Macro Research | Macro-Technical Analysis
TIPPING POINTS
INCREASING RISK
THE GLOBAL BENCHMARK US 10Y TREASURY IS NO LONGER “RISK FREE”!
OBSERVATIONS: The Importance and Problem With A Social Safety Net
Having just returned from Europe and prior to that having researched an UnderTheLens Video on China’s problems, something struck me that we may be missing. In the US and Europe, we take for granted that we receive government assistance in our old age. Social Security and Medicare for the elderly doesn’t exist in China and therefore their consumption behavior is different!
The CCP and Xi Jinping have a major problem in solving its current transition problem of moving their economy from Capital Investment led to Consumption led. The Chinese people are frugal because they must be. They must save for their old age and have enough kids to take care of them in their old age. It is a cultural expectation of youth to take care of their elderly parents. Starting on January 1, 2016, China ended its one-child policy, which has restricted the majority of Chinese families to only one child for the last 35 years. The one child policy has only compounded China’s economic transitioning policy.
What was clearly evident to me on returning from Europe is that we may be witnessing the dying Era of Inheritance. This is an element of the problem why economists are mystified with post Covid consumer spending.
The US alone has +72M Baby Boomers retiring at 10K/day. Their WWII era parents are dying and final inheritances are transferring. Two generations of accumulated assets are now being spent, because more than ever before the Baby Boomer Generation has the attitude that “you can’t take it with you” and “you only live once”. They are overwhelmingly traveling and spending while they still have their health. Meanwhile they are helping with the bills for their over indulgent kids, their grand kids’ education and instilled materialism expectations. The great wealth accumulated since WWII, (dominantly through questionable real estate appreciation), is now being liquidated or indentured.
Likewise the government is spending a War Time budget in a Peace Time Economy and Corporations are surviving on leverage and financial engineering. The EU government is no different while Europeans experience the richest retirement benefits (and working benefits) in the world. This was blatantly and abundantly clear as I visited retired relatives in Austria. They would be the envy of any visiting American retiree.
As a consequence, on my flight back from Austria, I heard my dead grandfather in my ear, (who actually prided himself on the financial legacy he would bequeath to his children and grandchildren), lamenting about all this – “they are selfishly eating their families’ seed corn”. There will be devasting consequences of all this!
Frankly, I just can’t seem to get the Wiley E Coyote feeling out of my mind!
WHAT YOU NEED TO KNOW!
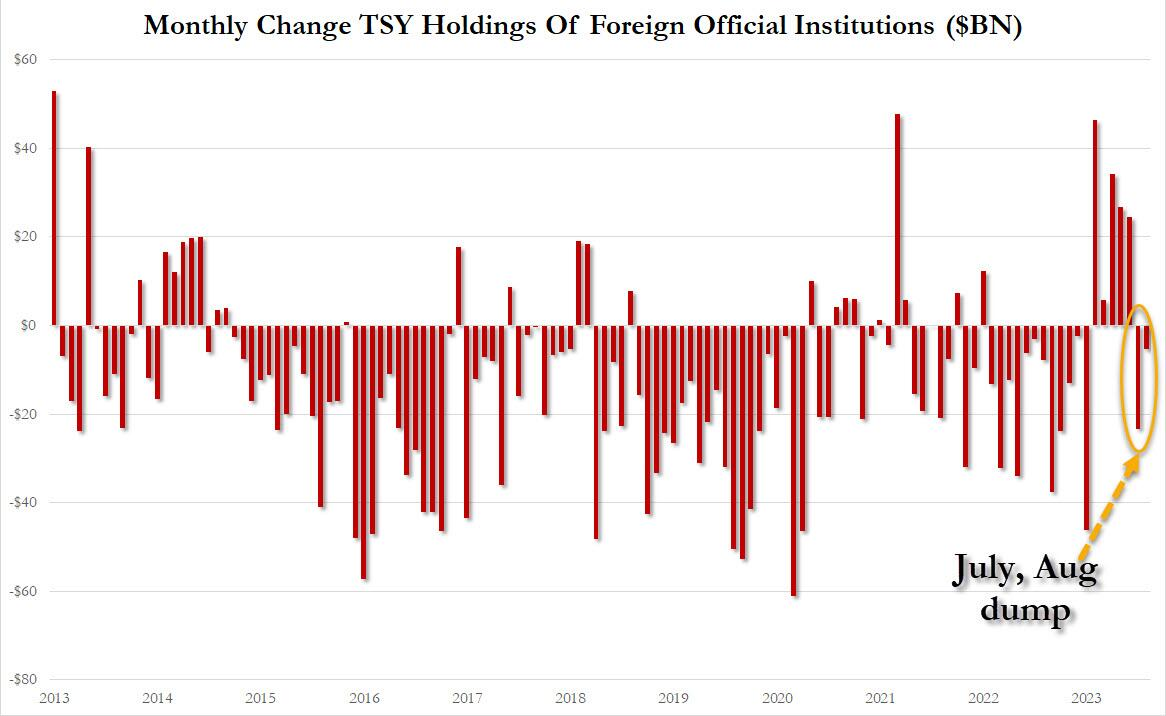 FOREIGNERS ARE SELLING US DEBT
Since July foreign purchases of US paper by foreign official institutions (i.e., central banks, sovereign wealth funds and reserve managers) suddenly stopped and they sold $23.4 billion in US paper, the first liquidation since January. Meanwhile private entities bought $19 billion, which was not enough to offset the official selling. According to the latest TIC report, August was the second month in a row when central banks sold US Treasuries.
RESEARCH
THE GLOBAL BENCHMARK US 10Y TREASURY IS NO LONGER “RISK FREE”!
-
- The main direction for yields is likely to come from changes in the inflation and growth outlook as well as central bank signals. The environment is very much ripe for a correction in yields.
- We do not expect yields to rise materially further from the current levels in this cycle.
- Recently the rise in yields has been driven by an increase in real yields and a higher term premium.
- Private investors are likely to continue to demand higher compensation to buy increasing sizes of bonds, which should also mean higher risk premium.
- While the QE premium has already been reduced, it still exists, leaving the term Premia clear room to increase going forward.
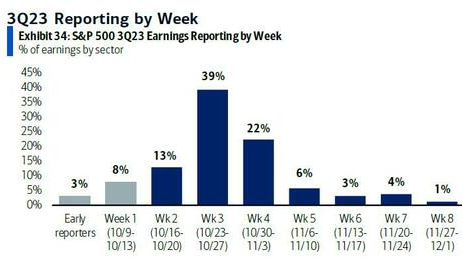
Q3 EARNINGS SEASON – This week is the Biggest Week with 40% of the S&P 500 Reporting
- Earnings Scorecard: For Q3 2023 (with 17% of S&P 500 companies reporting actual results), 73% of S&P 500 companies have reported a positive EPS surprise and 66% of S&P 500 companies have reported a positive revenue surprise.
- Earnings Decline: For Q3 2023, the blended (year-over-year) earnings decline for the S&P 500 is -0.4%. If -0.4% is the actual decline for the quarter, it will mark the fourth straight quarter of year-over-year earnings declines reported by the index.
- Earnings Revisions: On September 30, the estimated (year-over-year) earnings decline for the S&P 500 for Q3 2023 was -0.3%. Five sectors are reporting lower earnings to-date compared to September 30 due to negative EPS surprises and downward revisions to EPS estimates.
- Earnings Guidance: For Q4 2023, 7 S&P 500 companies have issued negative EPS guidance and 6 S&P 500 companies have issued positive EPS guidance.
- Valuation: The forward 12-month P/E ratio for the S&P 500 is 17.7. This P/E ratio is below the 5-year average (18.7), but above the 10-year average (17.5).
GLOBAL ECONOMIC REPORTING: What This Week’s Key Global Economic Reports Tell Us?
-
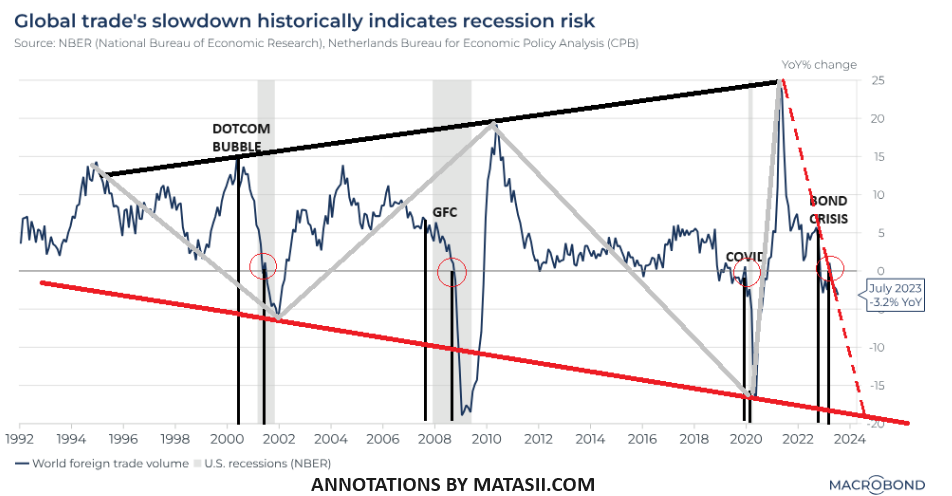
- This week we witnessed the beginnings of an “Un-Inversion” this with the steepening in the 2s30s curve. This is the signal that a recession is close at hand. Global Trade is strongly suggesting the coming recession may possibly be global in nature.
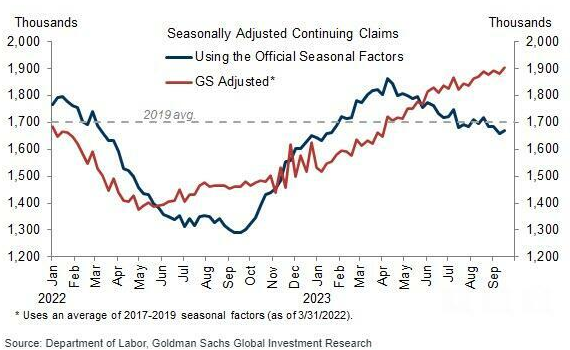
- Ongoing seasonal distortions have increasingly weighed on the level of continuing claims over the last six months, and we now expect that the reversal of those distortions could exert a cumulative boost of 375k to the level of continuing claims between the end of September and March.
Ongoing seasonal distortions have increasingly weighed on the level of continuing claims over the last six months, and we now expect that the reversal of those distortions could exert a cumulative boost of 375k to the level of continuing claims between the end of September and March.
DEVELOPMENTS TO WATCH
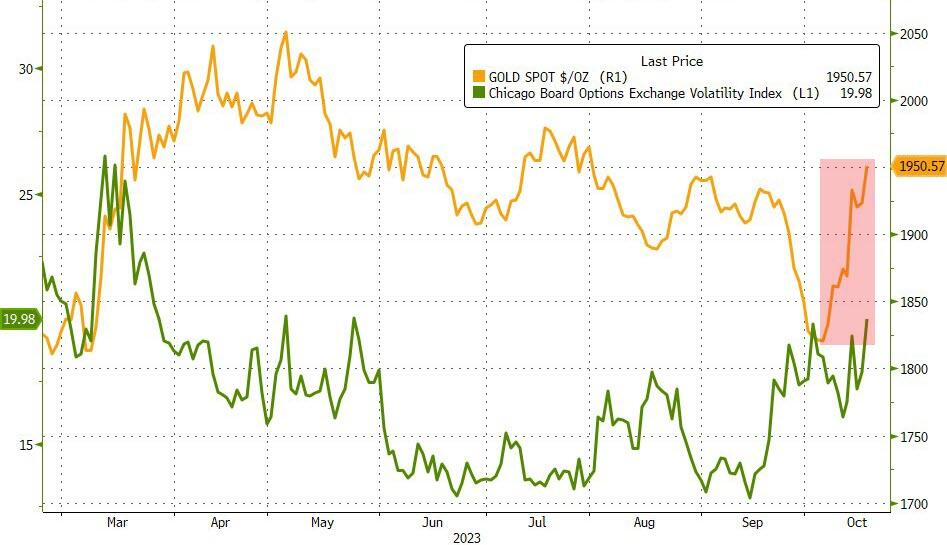
GOLD IS THE NEW “SAFE HAVEN”
Historically during Geo-Political crisis events, the “Flight-to-Safety” is to the US Dollar and holding US Treasury instruments. That has changed as the crisis in Israel/Gaza has brought to the fore!
-
- Gold, Oil & Bitcoin have become the current Safe Haven trades.
- Meanwhile, US Treasuries have become the new “Fear Index” (Price down, Yields up!).
THE NEW HOOVERVILLES: “BIDEN BUGGIES”!
Welcome to the new world of Biden Buggies as RV Squatting Explodes!
From 2020 to 2023, the median purchase price of homes in the US rose from $320,000 to over $420,000 – that’s a 33% increase in only 3 years. In 2011, the average price of a home was around $200,000, meaning prices have doubled in a single decade. The average apartment rental price in the US is now $1300 per month, compared to $1000 in 2020, and home rentals have risen to over $2000 per month on average. The spike in the market is a reflection of inflation across the board, as well as increased demand due to more Americans being priced out of home ownership.
THE GLOBAL BENCHMARK US 10Y TREASURY IS NO LONGER “RISK FREE”!
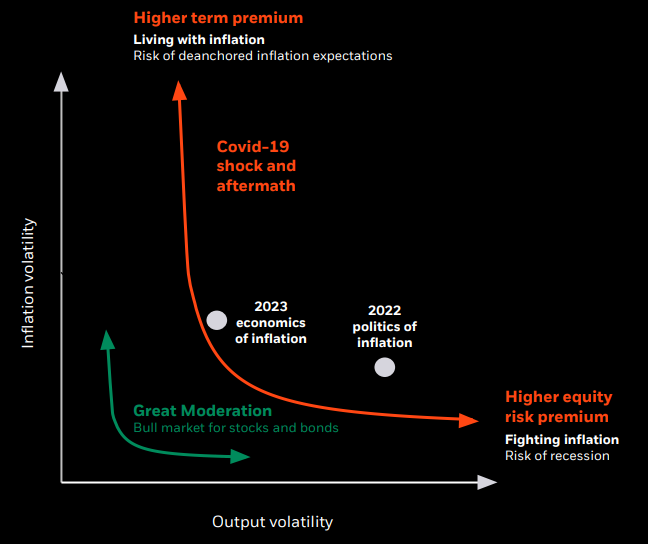 I first featured the graphic to the right in Q4 2022. It was additionally part of this year’s Thesis Paper: “A GREAT STAGFLATION” in the discussion regarding the end of the “Great Moderation”.
Our 2020 Thesis paper “GLOBAL CONFLICT” warned of a coming elevation in global tensions and with it Geo-Political Risk.
Geo-Political Financial Risk has been generally been dormant for the last couple of decades. Today, with the advent of the BRICS-11 and major tensions in Israel, Ukraine, Taiwan, North Korea, Syria ….. Geo-Political Risk is front and center. With it is increasing Bond Premia Risk.
GEOPOLITICAL RISK v RISK PREMIUMS
The case for higher term premium in longer yields continues to be strong, and we expect such premiums to increase further. The main direction for yields is likely to come from changes in the inflation and growth outlook as well as central bank signals.
 “Yields on medium- and longer-term nominal Treasury securities rose more substantially, mainly reflecting higher term premiums and higher real yields.”
– minutes from the FOMC September meeting, released on 11 October 2023.
Geopolitical tensions in the Middle East had an initial trigger for a downward correction in yields before violently rebounding to new highs. Central bankers are now suggesting that the rise in yields reduces the need for further rate hikes, but it could also easily be argued that after a considerable rise in yields without any major changes in the economic outlook or the signals from central banks, the environment is very much ripe for a correction in yields.
We do not expect yields to rise materially further from the current levels in this cycle.
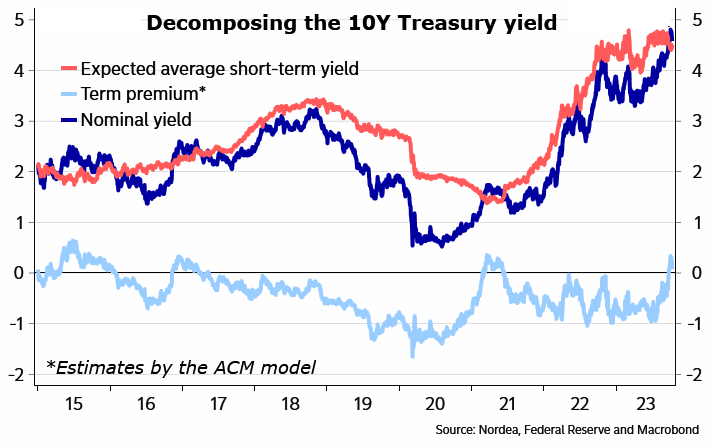 As we have been pointing out in our newsletters for some time now, the rise in yields has been driven by an increase in real yields and a higher term premium.
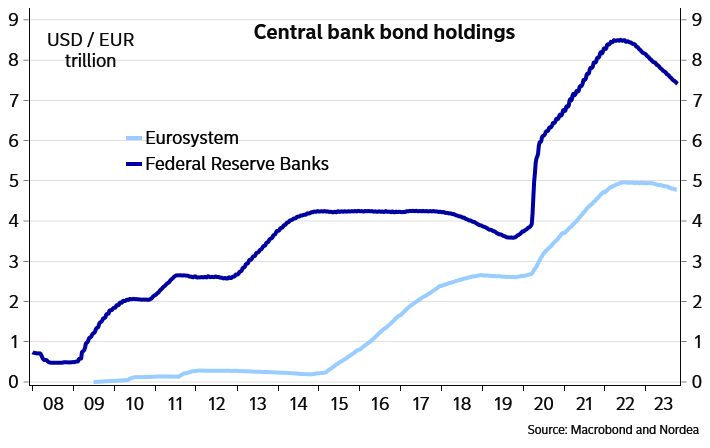
The term premiums were pushed into negative territory by large-scale bond purchases from central banks, so it is natural to expect the term premium to rise, as central banks are now reducing their bond holdings.
CHART RIGHT
The recent rise in yields largely is due to an increase in term premium.
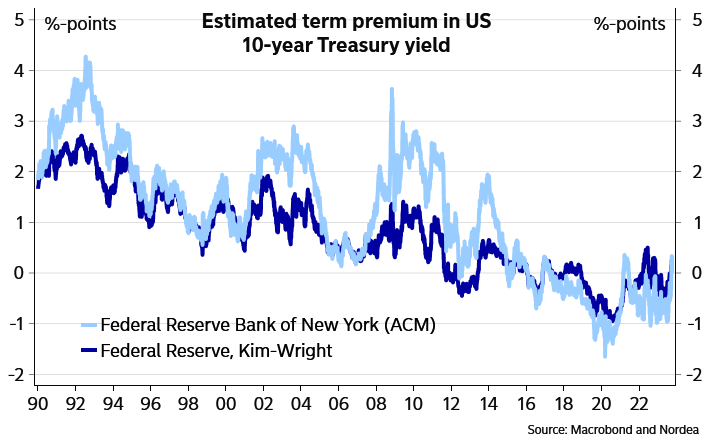
Term premiums have risen but remain historically low.
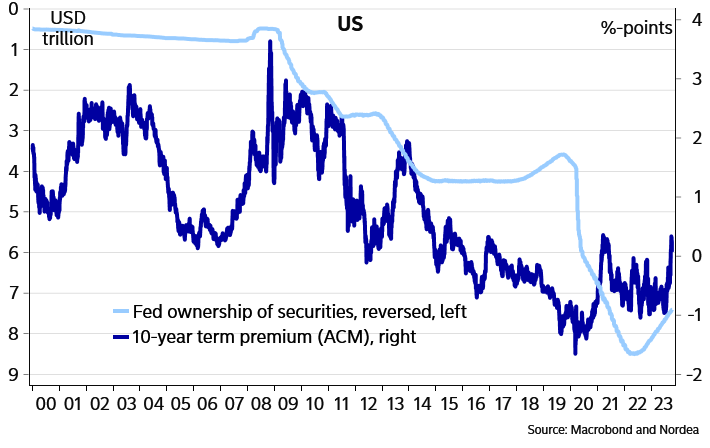
The Fed’s large-scale QE buying of bonds contributed to low term premiums
While it is true that financial market repricing often occurs abruptly rather than smoothly over time, the term premium is more likely to return gradually rather than rapidly. In fact, the pace or reduction in the Fed’s securities holdings has largely been on autopilot for more than a year already, with a monthly reduction cap of $95B, while there has been little discussion about making changes to this pace.
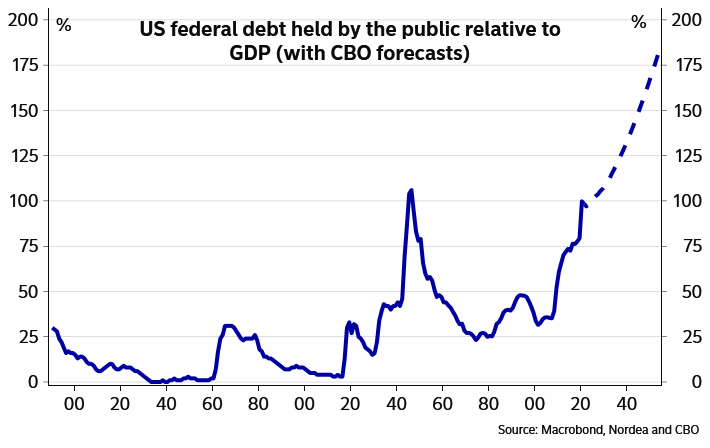
Bond issuance naturally impacts term premiums as well. The US fiscal outlook is dreadful, meaning a lot of bond issuance going forward, which also favors higher term premiums. However, the fiscal outlook has not seen any material changes recently. In fact, it could be argued that the ousting of Kevin McCarthy as the Speaker of the House for reaching a deal on funding the government illustrates that there is little appetite in the more extreme wing of the Republican Party to reach compromises with the Democrats to increase spending at least ahead of next year’s elections.
As a result, we continue to find it more likely that the term premium keeps increasing rather more slowly than in one go, meaning the bigger driver for bond yields will be the economic and inflation cycle as well as new signals from central banks.
US fiscal outlook is dreadful, but that is largely old news.
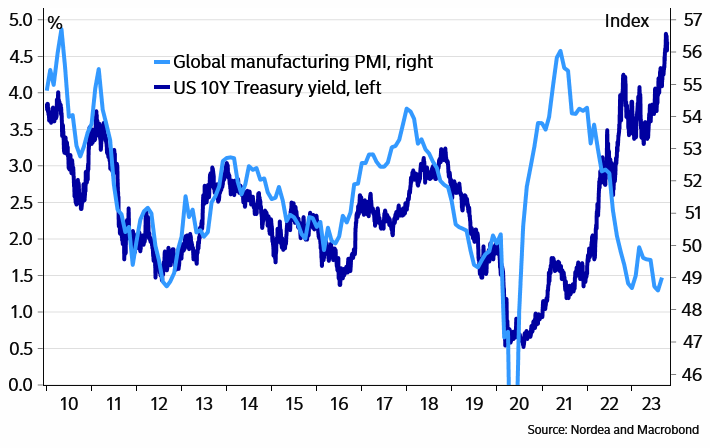
Cyclical considerations are normally an important driver of bond yields.
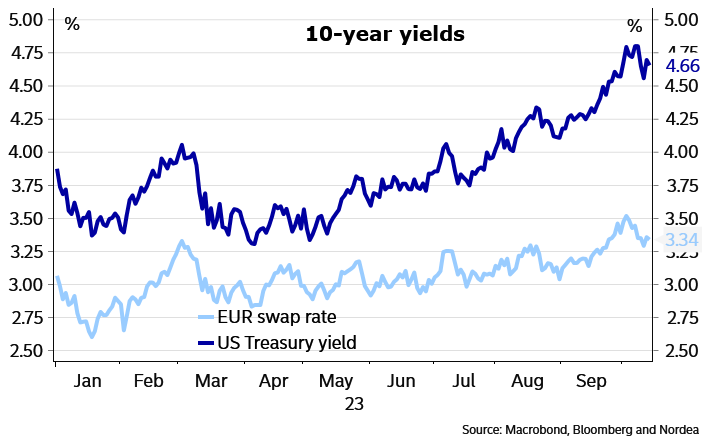
 There is room for the term premium to also increase in the Euro area.
In the Euro area, the ECB is behind the Fed in letting its bond holdings decrease, but several Governing Council members have suggested that the central bank should debate the topic going forward. The September monetary policy account policy suggested such discussions were not really the topic yet last month, but the discussions will undoubtedly pick up at the coming meetings. Expect the pace of reductions to likely increase during the first half of next year.
Bond issuance is also likely to remain high at the same time. France and Italy unveiled higher public deficit plans for next year than expected earlier, although Germany is set to target a clearer fall in the deficit.
Nevertheless, in general, risks are tilted towards considerable deficits continuing also next year and, if that happens at the same time as the ECB reduces its bond holdings, private investors are likely to demand higher compensation to buy all those bonds, which should also mean higher risk premium.
The ECB is behind the Fed in reducing its bond holdings.
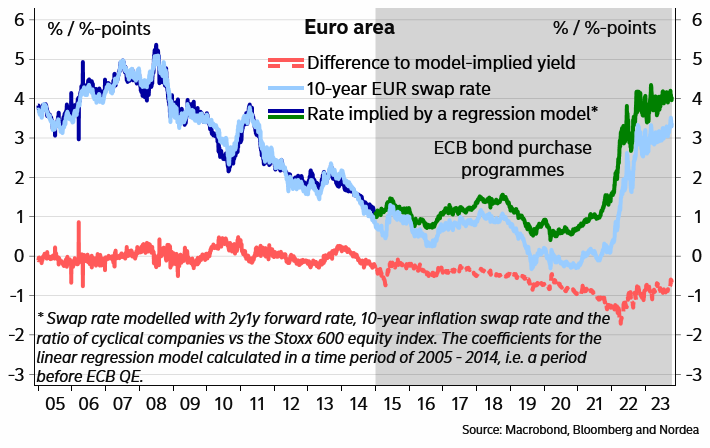 Some have tried to model the reduction in the term premium in longer interest rates due to the ECB’s bond purchases with the help of a simple regression model. It uses market expectations for short rates, inflation and growth to model the level of the 10-year swap rate. They have fixed the coefficients from a time period before the start of the ECB’s bond purchases, and examined how the actual level of rates has diverged from the model-implied yield after the purchases.
This examination suggests that at its peak, the QE-induced term premium was more than 1.5 percentage points at its peak last year, but has since fallen to 60-70bp. In other words, while the QE premium has already been reduced, it still exists, leaving the term Premia clear room to increase going forward.
Again, we do not expect the term premium to be the major driver of long yields, as cyclical considerations will most likely trump the impact of changes in the term premium, but other things equal, higher term premium should mean higher yields.
Term premium has room to increase in the Euro area.
The US core inflation is still on a downward trend.
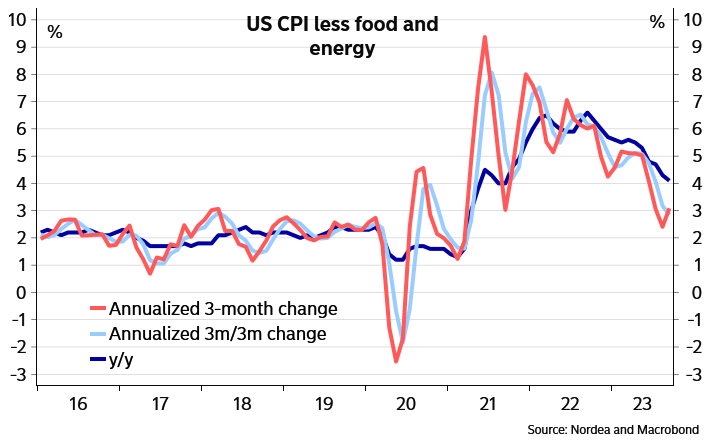 US recent September core CPI numbers were close to expectations, while the headline number was slightly higher than expected on the back of higher gasoline prices. In the bigger picture, while the 0.3% m/m rise in the core CPI is not yet in line with the Fed’s 2% inflation target, both the 3m/3m and the y/y rates in core CPI continued to recede.
These numbers are likely to support the Fed remaining put and follow further developments at its Novinember meeting, but signs of inflation stickiness could yet persuade the Fed to hike rates once more in December. Core inflation is gradually coming down in the US.
Q3 EARNINGS SEASON
 KEY METRICS (As Reported By FactSet)
Earnings Scorecard: For Q3 2023 (with 17% of S&P 500 companies reporting actual results), 73% of S&P 500 companies have reported a positive EPS surprise and 66% of S&P 500 companies have reported a positive revenue surprise.
Earnings Decline: For Q3 2023, the blended (year-over-year) earnings decline for the S&P 500 is -0.4%. If -0.4% is the actual decline for the quarter, it will mark the fourth straight quarter of year-over-year earnings declines reported by the index.
Earnings Revisions: On September 30, the estimated (year-over-year) earnings decline for the S&P 500 for Q3 2023 was -0.3%. Five sectors are reporting lower earnings to-date compared to September 30 due to negative EPS surprises and downward revisions to EPS estimates.
Earnings Guidance: For Q4 2023, 7 S&P 500 companies have issued negative EPS guidance and 6 S&P 500 companies have issued positive EPS guidance.
Valuation: The forward 12-month P/E ratio for the S&P 500 is 17.7. This P/E ratio is below the 5-year average (18.7), but above the 10-year average (17.5).
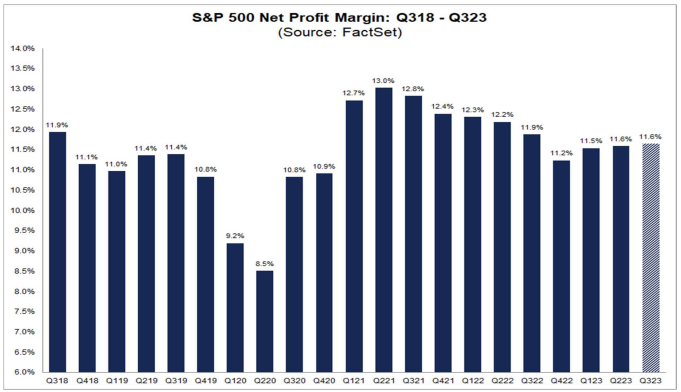
S&P 500 Reporting A Lower Year-Over-Year Net Profit Margin For the 7th Straight Quarter
The (blended) net profit margin for the S&P 500 for Q3 2023 is 11.6%, which is below the year-ago net profit margin (11.9%), equal to the previous quarter’s net profit margin (11.6%) and above the 5-year average (11.4%). If 11.6% is the actual net profit margin for the quarter, it will mark the seventh straight quarter in which the net profit margin has declined year-over-year.
-
- At the sector level, six sectors are reporting a year-over-year increase in their net profit margins in Q3 2023 compared to Q3 2022, led by the Communication Services (12.2% vs. 9.8%) sector. On the other hand, five sectors are reporting a year-over-year decrease in their net profit margins in Q3 2023 compared to Q3 2022, led by the Energy (11.0% vs. 14.4%) and Health Care (8,1% vs. 10.5%) sectors.
- Eight sectors are reporting net profit margins in Q3 2023 that are above their 5-year averages, led by the Energy (11.0% vs. 8.4%) sector. On the other hand, three sectors are reporting net profit margins in Q3 2023 that are below their 5-year averages, led by the Health Care (8.1% vs. 10.3%) sector.
- Five sectors are reporting a quarter-over-quarter increase in their net profit margins in Q3 2023 compared to Q2 2023, led by the Utilities (14.2% vs. 12.2%) sector. On the other hand, five sectors are reporting a quarter-over-quarter decrease in their net profit margins in Q3 2023 compared to Q2 2023, led by the Real Estate (35.2% vs. 37.3%) and Materials (9.7% vs. 11.8%) sectors.
- It is interesting to note that analysts believe net profit margins for the S&P 500 will be higher in the first half of 2024. As of today, the estimated net profit margins for Q4 2023, Q1 2024, and Q2 2024 are 11.5%, 12.0% and 12.3%, respectively.
&P 500 VERSUS BANKS & FINANCIALS (MATASII Indexes)
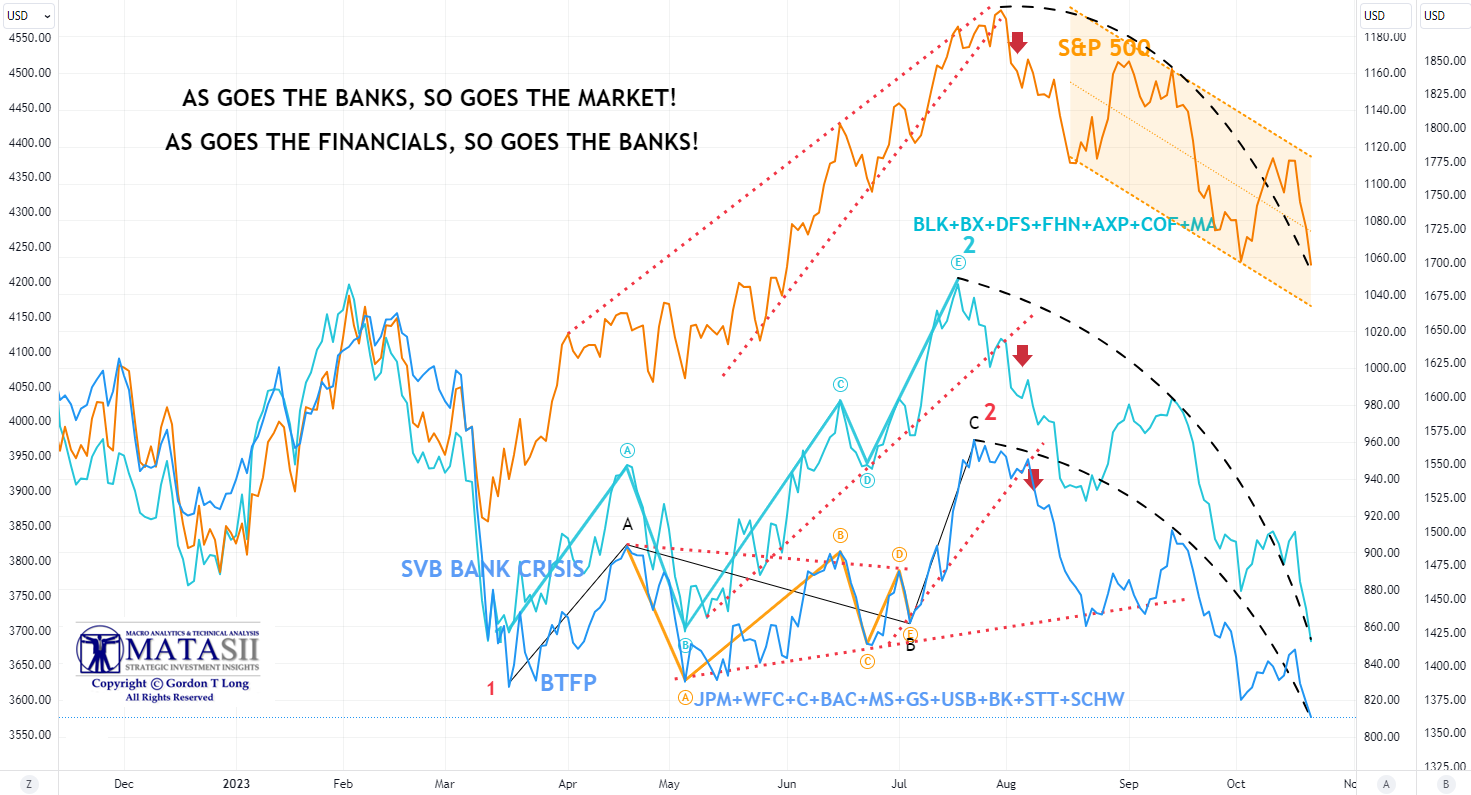
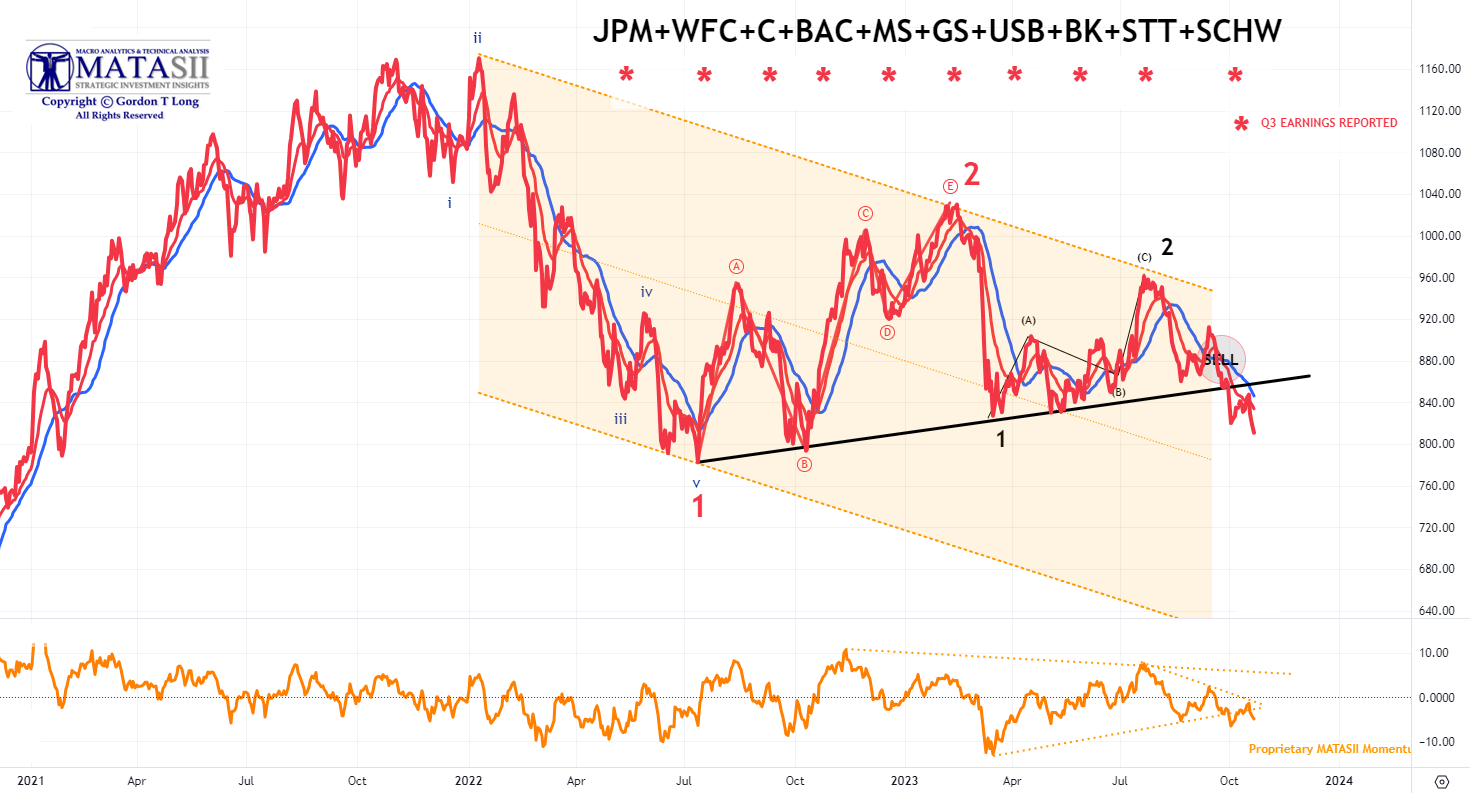
BANKS
A MATASII CROSS SELL SIGNAL (Daily Chart)!
-
- JPMorgan (JPM) posted a strong report: EPS, revenue, NII, IB and FICC revenue all topped expectations with provision for credit losses lower than forecasted. Looking ahead, company raised FY23 NII view.
- Wells Fargo (WFC) topped Wall St. consensus on EPS, revenue and NII, alongside raising Q4 and FY23 guidance for net interest income.
- Citigroup (C) surpassed expectations on the top and bottom line, with the breakdown also strong. Raised FY23 NII ex-markets view and affirmed FY23 revenue guide.
- Bank of America (BAC) EPS and revenue surpassed expectations, with the former boosted by higher net interest income, and raised FY23 NII view. In commentary, said US consumer spending is still ahead of last year but continuing to slow, and CFO highlighted that the bank had recorded the highest sales and trading revenue in more than a decade in Q3.
- Morgan Stanley (MS) profit and revenue beat but missed on NII and wealth management revenue, weighing on shares. reported $13.3 billion in net revenues for the third quarter of 2023. This was up from $13.0 billion a year ago. The company’s net income was $2.4 billion, or $1.38 per diluted share. This was compared to $2.6 billion, or $1.47 per diluted share, for the same period a year ago. Morgan Stanley’s third quarter results beat profit estimates. The company’s earnings per share were $1.38, compared to an estimate of $1.28 from LSEG. Revenue was $13.27 billion, compared to an expected $13.23 billion. Other highlights from Morgan Stanley’s third quarter earnings report include: i) ROTCE of 13.5%, ii)Year-to-date efficiency ratio of 75%, iii) Total assets under management or supervision of $1.39 trillion, up 9% from September 30, 2022.
- Goldman Sachs (GS) earnings beat, with its main businesses also performing well. CEO said there are reasons to remain vigilant, citing higher bond yields. Adds, the US economy has proven to be more resilient than they expected. Bank of New York Mellon (BK) surpassed expectations on the top and bottom line, with total deposits and net interest revenue more-or-less in line.
- U.S. Bancorp (USB) released its third-quarter earnings for 2023 on October 18, showing a robust performance despite a challenging interest rate environment. The company reported a net income of $1,523 million and diluted earnings per common share of $.91.
- Bank of New York Mellon Corporation (BK) reported revenue of $4.37 billion, up 2.2% over the same period last year. EPS came in at $1.27, compared to $1.21 in the year-ago quarter.
- State Street Corporation (NYSE:STT) beats earnings expectations. Reported EPS is $1.93, expectations were $1.77. Total revenue: $2,691 million, down 9% from Q3 2022. Net income: $422 million, down 39% from Q3 2022. Diluted earnings per share (EPS): $1.25, down 31% from Q3 2022. Adjusted earnings per share: $1.93, surpassing the Zacks Consensus Estimate of $1.77. Total earnings per share: $7.40 over the last four quarters.
- Charles Schwab (SCHW) posted a mixed report; EPS and deposits beat but missed on revenue, with total client assets and new assets coming in short.
FINANCIALS
A MATASII CROSS DAILY SELL SIGNAL (Daily Chart!)
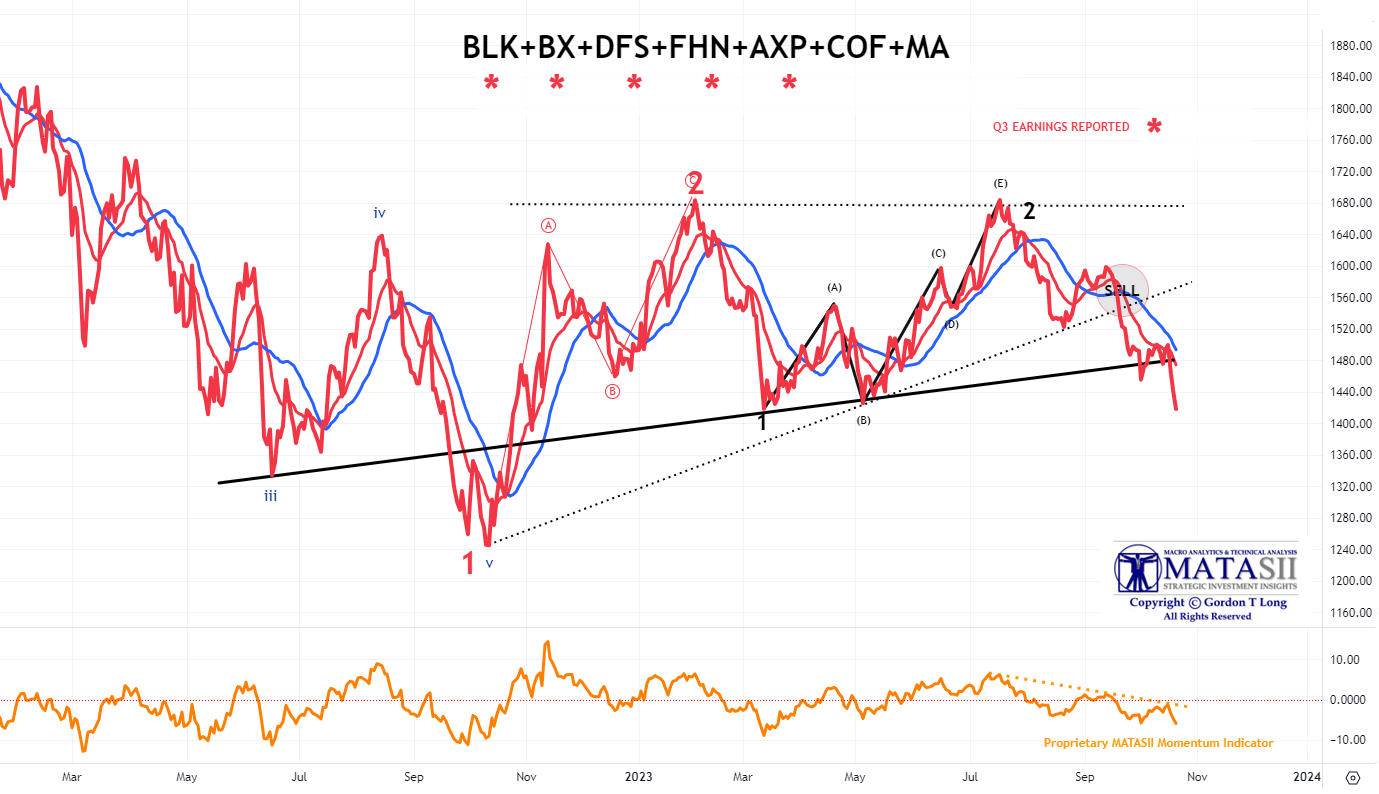
MAJOR FINANCIALS Q3 REPORTS
-
- BlackRock (BLK) missed on revenue but did beat on profit. In the quarter, clients pulled USD 13bln from long-term funds, which marks the first outflow since the onset of the pandemic.
- Blackstone Inc. (BX) reported $2.32 billion in revenue for the quarter ended September 2023, representing a year-over-year decline of 10.4%. EPS of $0.94 for the same period compared to $1.06 a year ago.
- Discover Financial Services (DFS) Q3 profit numbers missed estimates due to higher bad loan provisions. Net interest margin and net income also fell short, but revenue, NII and deposits beat. Las Vegas Sands (LVS) EPS was in line, revenue beat and authorized a USD 2bln stock repurchase programmed.
- First Horizon Corp (NYSE:FHN) reported Net income: $129 million, or $0.23 per share. Revenues: $778 million, missing the Zacks Consensus Estimate by 2.89%. Charge-offs: $95 million. ACL coverage ratio: Increased one basis point to 1.36. The company’s net income was down 50% year over year. Higher provisions and rising expenses were undermining factors. However, improving loan and deposit balances were tailwinds. Total charge-offs of $95 million. ACL coverage ratio increased one basis point to 1.36.
- American Express (AXP) posted an EPS of USD 3.30, beating the 2.94 expectation, while revenue also beat at 15.38bln (exp. 15.36bln). It reaffirmed its revenue and EPS growth forecasts for the FY, while it is also well positioned to achieve its long term growth goals. Nonetheless, the reaffirmed guidance has disappointed some with shares down.
- Capital One Financial (COF) is expected to report earnings for the third quarter of 2023 on October 26, 2023 after market close. The earnings call is scheduled for 5:00 PM EDT. According to Zacks Investment Research, the consensus EPS forecast for the quarter is $3.26. In the previous quarter, Capital One reported $3.52 EPS, beating analysts’ consensus estimates by $0.21, $9.01 billion in earnings, compared to analyst estimates of $9.13 billion, 9.5% increase in quarterly revenue compared to the same quarter last year. Capital One’s annual revenue for the twelve months ending June 30, 2023 was $44.539B, a 30.69% increase year-over-year.
- Mastercard (MA) is expected to report earnings for the fiscal quarter ending September 2023 on Thursday, October 26, 2023 before market open. The consensus EPS forecast for the quarter is $3.2, based on 13 analysts’ forecasts. Mastercard’s earnings are expected to grow by 18.14% in the coming year, from $12.13 to $14.33 per share. Mastercard’s revenue for the twelve months ending June 30, 2023 was $23.59B, with 13.06% growth year-over-year. Revenue in the quarter ending June 30, 2023 was $6.27B with 14.04% year-over-year growth.
GLOBAL ECONOMIC INDICATORS: What This Week’s Key Global Economic Releases Tell Us
As we discuss in more detail in the “Current Market Perspective” below, we saw the beginnings of an “Un-Inversion” this week with the steepening in the 2s30s curve. As we show, this is the signal that a recession is close at hand. Global Trade is strongly suggesting the coming recession may possibly be global in nature.
-
- 2000 DotCom Bubble Crisis
- 2008 Financial Mortgage Crisis
- 2020 Covid-19 Pandemic
- 2022 Sovereign Bond Collapse
SEASONALITY DISTORTIONS ARE MISREPRESENTING BLS DATA
 Is Bidenomics working or is something else going on???
Retail sales soared more than expected, so did Industrial Production, so did Manufacturing Output… and continuing claims are still low…then why is sentiment so miserable out in all these sentiment surveys?
Well… it’s all illusion/delusion (economics PhD speak for ‘adjustments’)!
-
- Retail Sales rose 0.7% MoM (SA)… but plunged 5.4% MoM (NSA)
- Industrial Production rose 0.3% MoM (SA)… but plunged 1.7% MoM (NSA)
- Manufacturing Output rose 0.35% MoM (SA)… but tumbled 0.5% MoM (NSA)
Goldman has warned on jobless claims: Ongoing seasonal distortions have increasingly weighed on the level of continuing claims over the last six months, and we now expect that the reversal of those distortions could exert a cumulative boost of 375k to the level of continuing claims between the end of September and March.
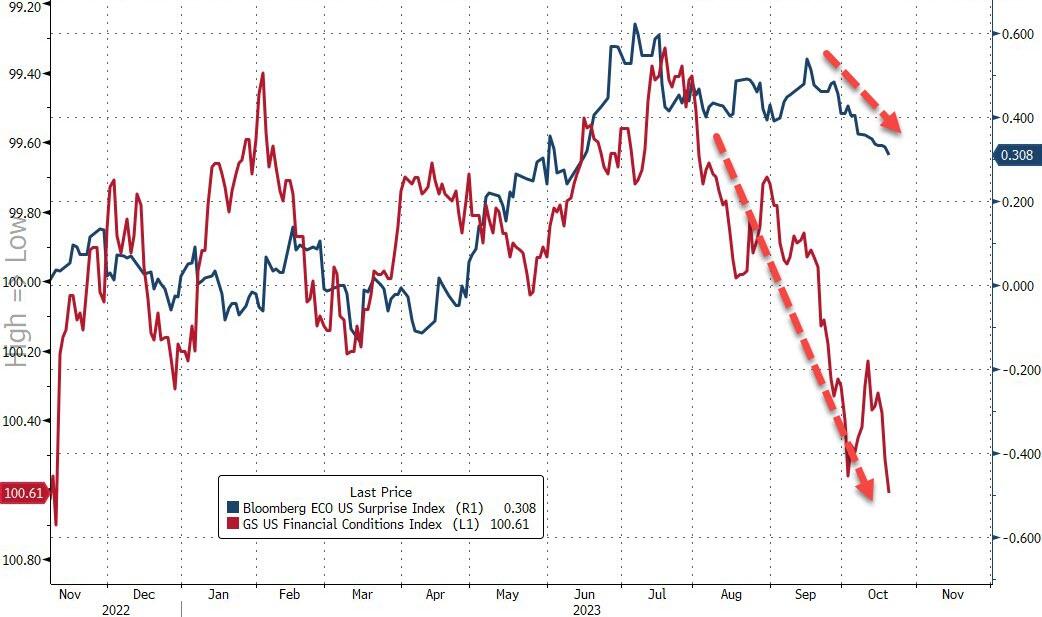
NOTE: The economic data (seasonally-adjusted) has been holding in ‘so strong’ as financial conditions have tightened dramatically.
GLOBAL MACRO
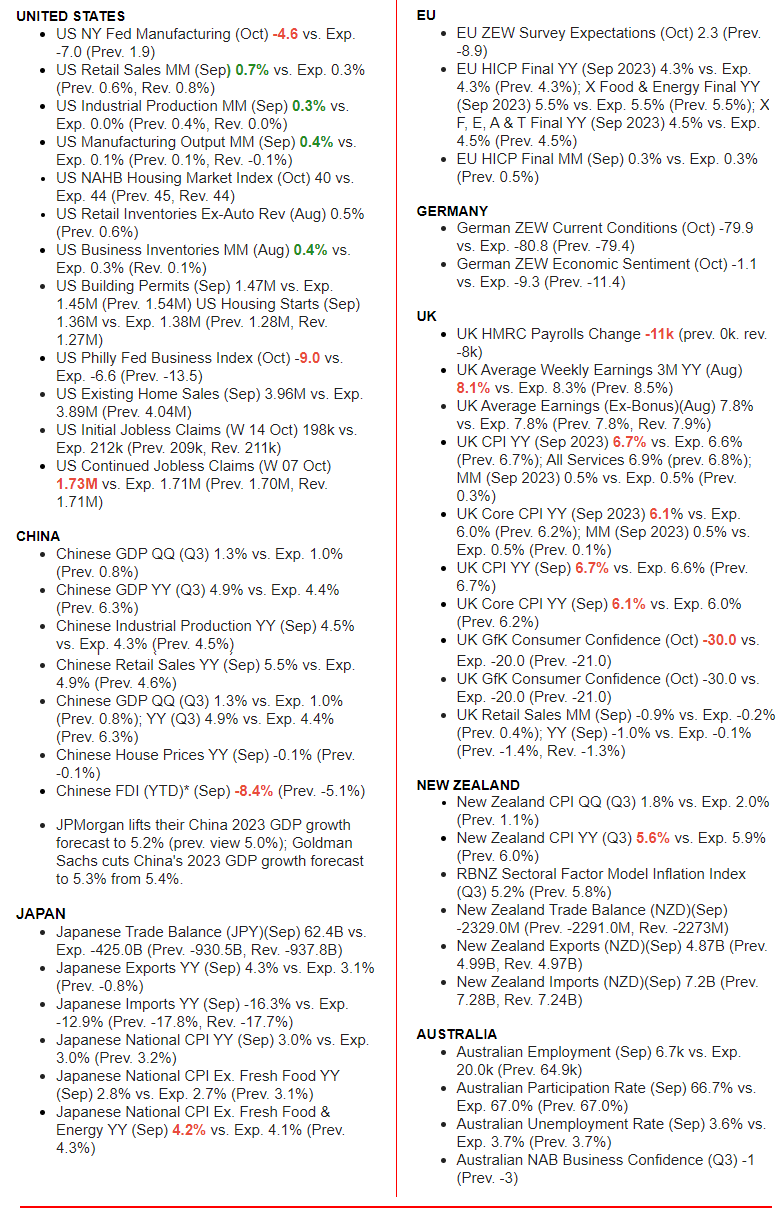
WHAT DOES YOUR SCAN OF THE DATA BELOW TELL YOU? – THE MEDIA AVOIDS BAD NEWS!
We present the data in a way you can quickly see what is happening.
THIS WEEK WE SAW
Exp=Expectations, Rev=Revision, Prev=Previous
DEVELOPMENTS TO WATCH
GOLD IS THE NEW “SAFE HAVEN”
 Historically during Geo-Political crisis event the “Flight to Safety” is to the US Dollar and holding US Treasury instruments. That has changed as the crisis in Israel/Gaza has brought to the fore!
-
- Gold & Oil have become the new Safe Havens
- US Treasuries have become the new “Fear Index” (Price down, Yields up!)
THE NEW HOOVERVILLES: “BIDEN BUGGIES”!
From 2020 to 2023, the median purchase price of homes in the US rose from $320,000 to over $420,000 – That’s a 33% increase in only 3 years. In 2011, the average price of a home was around $200,000, meaning prices have doubled in a single decade. The average apartment rental price in the US is now $1300 per month, compared to $1000 in 2020, and home rentals have risen to over $2000 per month on average. The spike in the market is a reflection of inflation across the board, as well as increased demand due to more Americans being priced out of home ownership.
Another interesting development during the pandemic years was a considerable rush to buy RVs, vans and tiny homes. This may have been a symptom of the authoritarian lockdowns that became a standard in blue states, leading people to relocate. However, there is also the economic factor. The average tiny home runs $30,000 to $60,000, with used RVs available for even less. RV space rentals can be found for as low as $500 per month. For those willing to sacrifice living space, the savings are alluring.
Inflationary crisis is pushing low income and fixed income Americans into tighter living conditions, and people are trying to adapt as best they can.

The underlying difference between economic disasters of the past like the Great Depression and the stagflation crisis of today is not the severity of the decline but the visibility of the decline.
In the Great Depression, the proliferation of “Hooverville” shanty towns and charity soup lines became an iconic symbol of the scale of financial calamity. These kids of signals of collapse are not as prevalent or obvious in our era. Soup lines have been replaced by EBT benefits and food banks, while Hoovervilles are being replaced by “Squatter Towns” made up of RV villages on the outskirts of highways and Walmart parking lots.

EVERYTHING IS FINE ….. UNTIL IT ISN’T!
EXPECT THE UNEXPECTED WHEN GEO-POLITICAL RISK RISES!
Click All Charts to Enlarge
1 – SITUATIONAL ANALYSIS
 BE PREPARED!
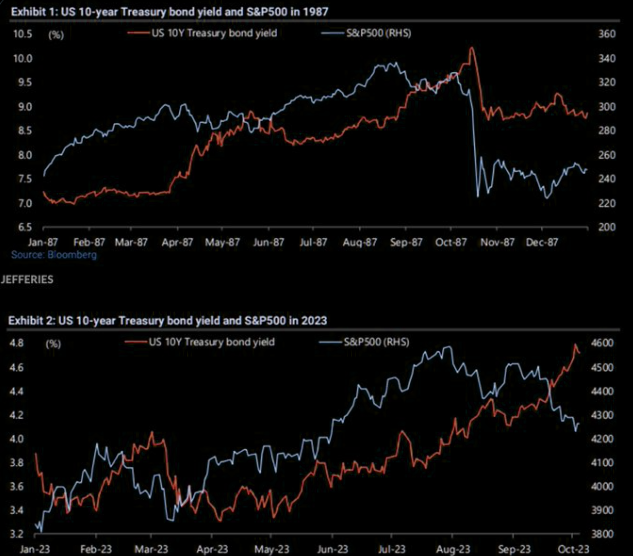
To the right we illustrate the 10-Year Yield versus the S&P 500 in 1987 and 2023. History may not repeat itself but “it often Rhymes”!
Currently the US debt is adding around $28.5bn per day and has been doing it for 18 days in a row. To put it differently, we are increasing the US debt burden by $1.2bn per hour! Making it worse. We are likely to increase that total debt bill by around $1 trillion in around 6 weeks.
Bonds are now down 3 years in a row.
The 10-Yr Treasury bond is down 5% this year, on pace for its 3rd consecutive annual decline. With data going back to 1928, that’s never happened before. The worst 3-year period for bonds prior to now was 1978-1980, with a 3% loss for the 10-Yr. What’s the 2021-23 decline? -26%.
Something should be expected to give … somewhere! A Geo-Political shock (even a minor one) should soon be expected to shake the global financial system. Is your portfolio prepared?
2 – FUNDAMENTAL ANALYSIS
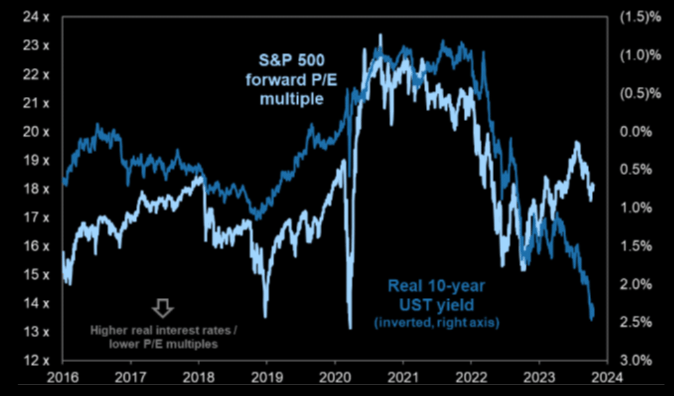
RECESSION COMETH & PE’S WILL BEGIN RELFECTING THIS
 There are two well recognized market reactions that can be expected:
-
- Equity markets begin weakening when the market perceives the Federal Reserve has finished raising rates and the last rate hike is in.
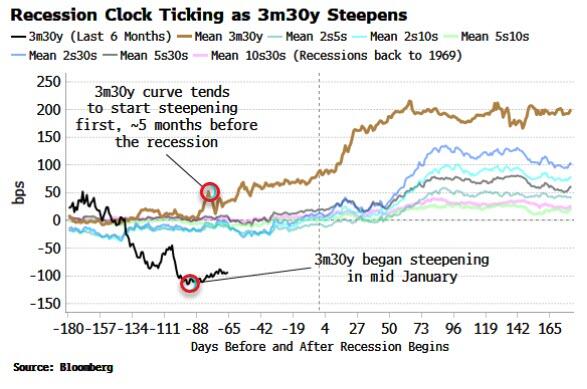
- A coming recession is signaled by an Inverted Yield Curve, BUT it is when the yield curve begins steepening that the market knows the recession is near.
PE Ratios then begin falling to reflect the recessions slowing impact on future profits.
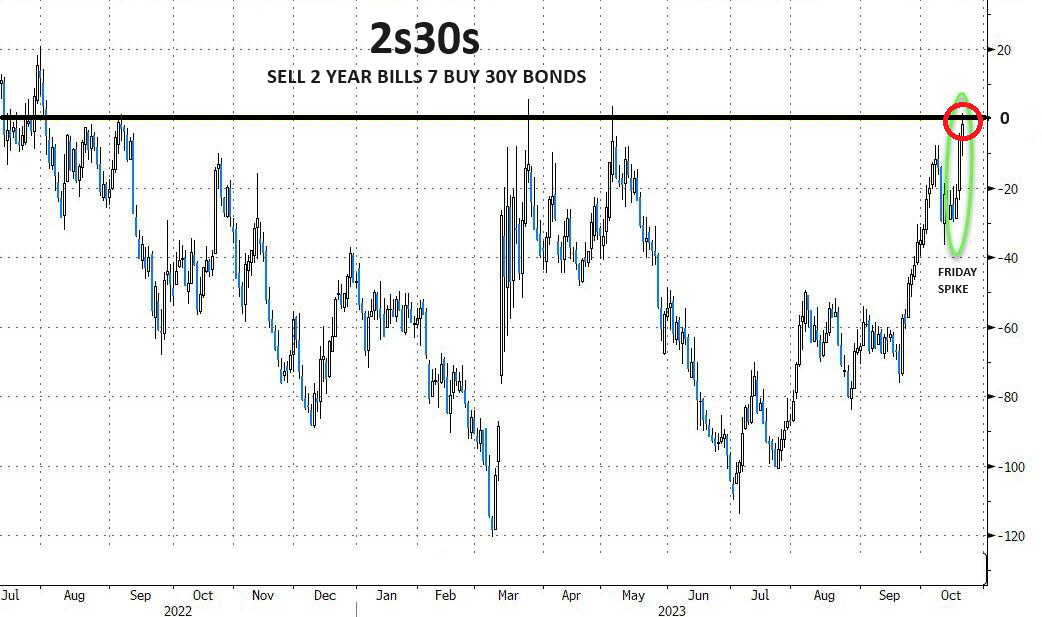
YIELD CURVE STEEPENING (UN-INVERSION)
It is the un-inversion of the Yield Curve that signals imminent recession. Friday we saw the 2s30s curve go positive once again and closed at its ‘steepest’ since Aug 2022 (Chart above right).
CHART BELOW
Additionally, the ‘real’ yield curve steepened dramatically, also pushing back up towards un-inverted.
The steepening was extremely evident in the week’s moves across the curve with 2Y up just 3bps and 30Y up 33bps.
 There was also a notable swing in rate-cut expectations for next year. This week we also saw rate-cut expectations drop from 84bps to 67bps and then reverse back to 78bps (of cuts), after Powell’s Thursday speech at the Economic Club of New York Luncheon, New York.
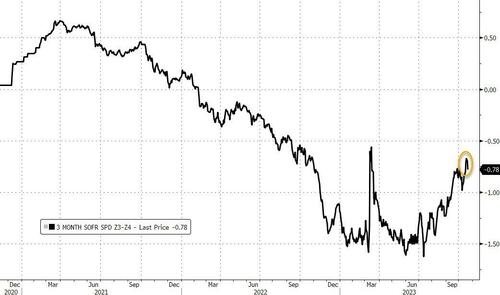
As I mentioned above, this is a warning sign because inverted yield curves precede recessions, but it’s the re-steepening that signals that the downturn is going to hit sooner rather than later. Historically it is the 3m30y yield curve that has started steepening first before a recession, beginning to rise about five months before its onset.
It began in mid-January, which would put a downturn starting as early as June. The spread between 3-month and 30-year yields is about minus 84 basis points, versus the January low of minus 115 basis points.
…. And 3m30Y has been steepening dramatically this week (Chart below).
3 – TECHNICAL ANALYSIS
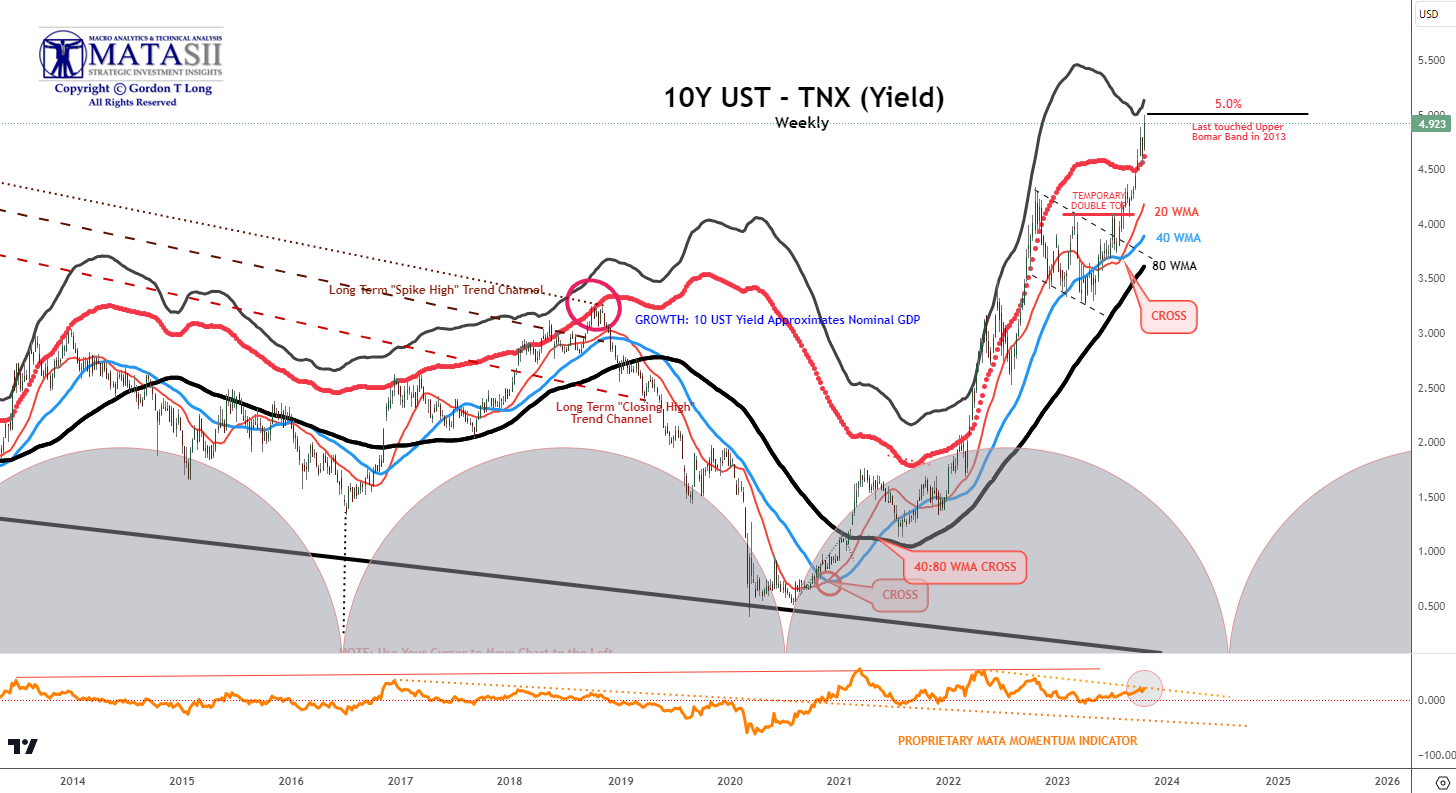
10Y US TREASURY – TNX – WEEKLY
Last week with the October Options Expiration, the 10Y US Treasury Note yield came extremely close to breaking our 5% target. It also came very close to touching our 3 Sigma Bomar which was last touched in 2013. We believe this was (or is very close to being) the high for this cycle of the rise in US Treasury Yields.
YOUR DESK TOP / TABLET / PHONE ANNOTATED CHART
Macro Analytics Chart Above: SUBSCRIBER LINK
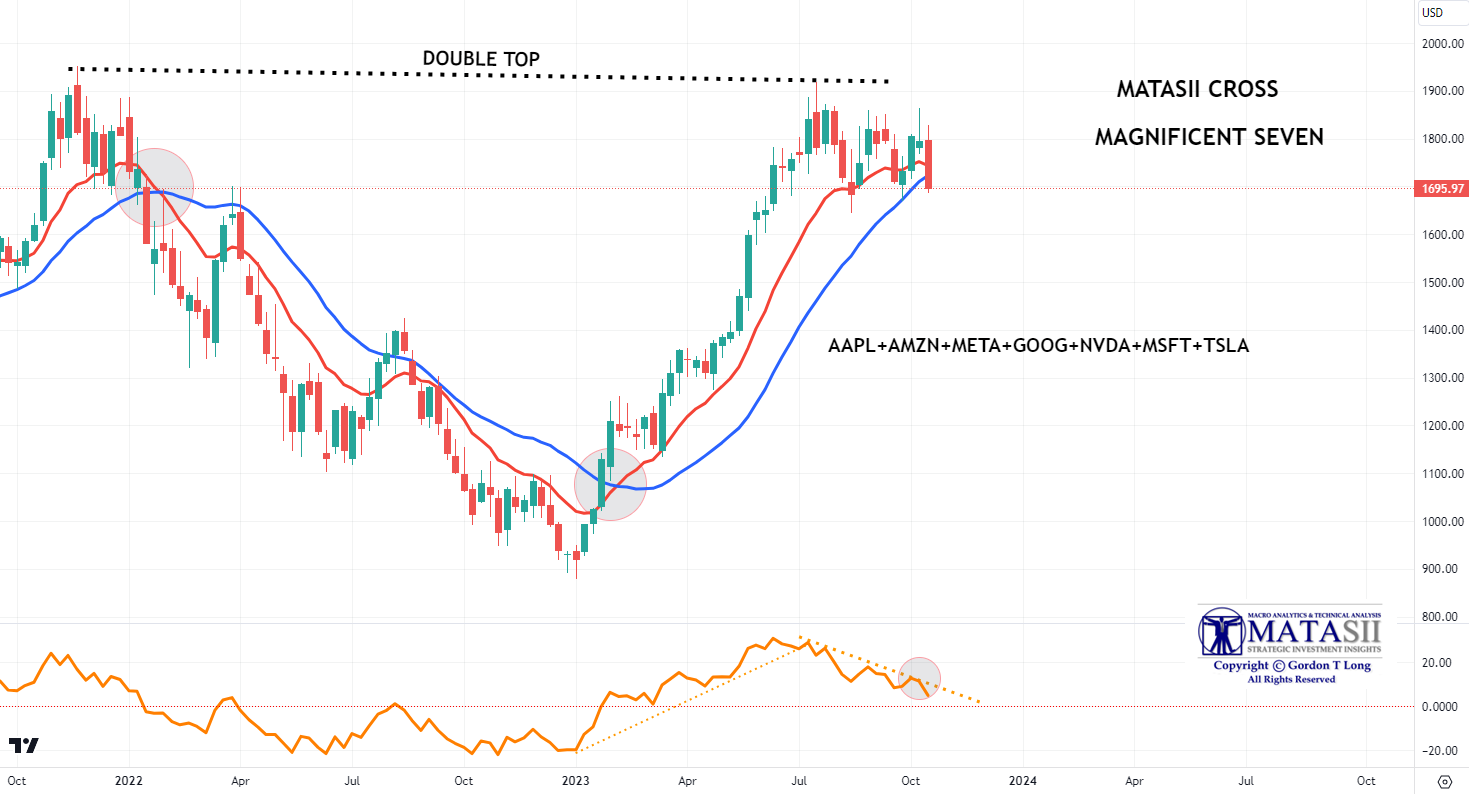
 S&P 500 – MATASII Cross – Weekly
In the Intermediate term the recent tightening in the financial conditions index (chart right) suggests stocks should be considerably lower.
The Magnificent Seven are showing noticeable weakness (chart below).
YOUR DESK TOP / TABLET / PHONE ANNOTATED CHART
Macro Analytics Chart Above: SUBSCRIBER LINK
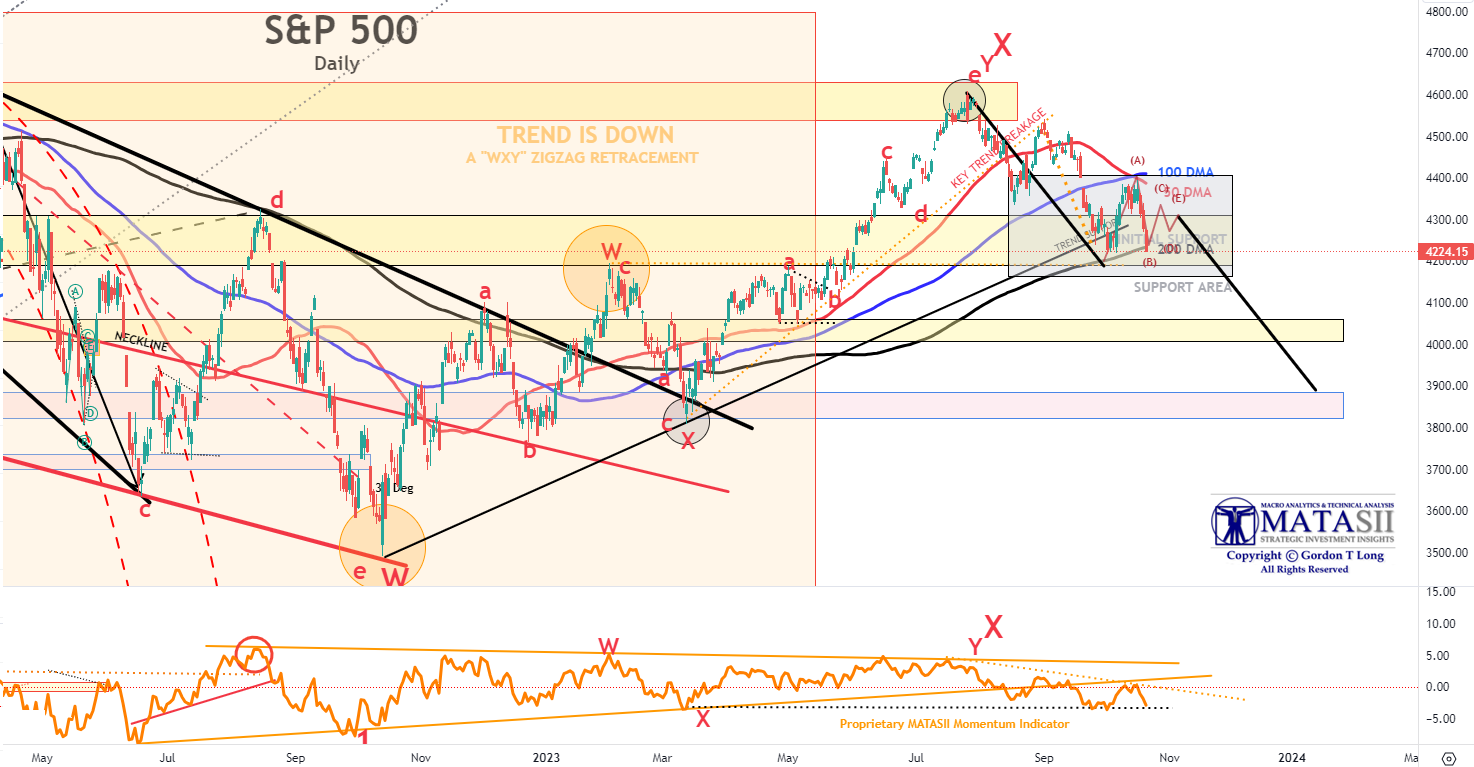
S&P 500 – Short Term View
The S&P 500 fell as expected to find October Options Expiration support at the 2000 DMA. We suspect the S&P 500 will further consolidate here, possibly in an ABCDE consolidation Triangle before heading lower. Next week is the biggest week of Q3 earning season and will allow the market to finish assessing the year end outlook and have visibility to Q1 through the earnings call with analysts. (We remind you of the strong Q4 upward seasonal bias).
We suspect the 200 DMA to continue rising while the 50 DMA falls. We expect the cross of the 200 DMA by the 50 DMA to be the next triggering event. Often the second leg down (black line) equals the first leg down in both price and rate of decline.
NOTE: We need to caution that a breach of the 4,200 level in the S&P 500 is likely to require a i) a dollar down, ii) yields up, iii) oil >$100/bbl, as well as iv) clear signs by small business that the credit crunch is causing higher unemployment to occur! This will determine the timeframe for the “trading range” and the slope of the connecting black line below of the two down legs.
YOUR DESK TOP / TABLET / PHONE ANNOTATED CHART
Macro Analytics Chart Above: SUBSCRIBER LINK
FAIR USE NOTICE This site contains copyrighted material the use of which has not always been specifically authorized by the copyright owner. We are making such material available in our efforts to advance understanding of environmental, political, human rights, economic, democracy, scientific, and social justice issues, etc. We believe this constitutes a ‘fair use’ of any such copyrighted material as provided for in section 107 of the US Copyright Law. In accordance with Title 17 U.S.C. Section 107, the material on this site is distributed without profit to those who have expressed a prior interest in receiving the included information for research and educational purposes. If you wish to use copyrighted material from this site for purposes of your own that go beyond ‘fair use’, you must obtain permission from the copyright owner.
NOTICE Information on these pages contains forward-looking statements that involve risks and uncertainties. Markets and instruments profiled on this page are for informational purposes only and should not in any way come across as a recommendation to buy or sell in these assets. You should do your own thorough research before making any investment decisions. MATASII.com does not in any way guarantee that this information is free from mistakes, errors, or material misstatements. It also does not guarantee that this information is of a timely nature. Investing in Open Markets involves a great deal of risk, including the loss of all or a portion of your investment, as well as emotional distress. All risks, losses and costs associated with investing, including total loss of principal, are your responsibility.