Gordon T Long
Global Macro Research | Macro-Technical Analysis
TIPPING POINTS
CREDIT CONTRACTION
IS THE US BEGINNING TO SPIN OUT OF FINANCIAL CONTROL?
OBSERVATIONS: I thought I would share another set of observations I had during my recent trip to Europe. It is about housing and supporting contract services.
Having replaced my home roof about 8 years ago, I found myself noting the roofs of the houses I visited and stayed at. They weren’t shingles, but mostly clay (ceramic terracotta) or metal roofs that literally lasted generations. I recalled how frustrated I had been 8 years ago in replacing my roof, because it lasted barely 20 years and it took some serious negotiations and searching to get it replaced for a final price of $5,400.
Why this struck me was, because before I left, I had listened to three separate frustrated friends complain about the cost of having to now replace their house roof. All were retired or nearing retirement and were shocked at the cost their Social Security checks were going to have to absorb.
Two of the houses were considerably smaller than mine. One negotiated $16,000 and the other was still frozen, facing a $21,000 charge. The third friend had a house closer in size to mine and had just agreed to the job for north of $42,000. I made him repeat the number three times as my mouth dropped! Though all three have paid off their mortgages, who today can afford this on Social Security?? Consequently, I paid a lot attention to this week’s CPI and specifically the exploding “services” details.
I additionally noticed in rural Austria how beautiful all the lawns were. They didn’t look like mine, always waiting for me to find time to cut it, (I need the exercise), or proud neighbors frustratingly waiting for their weekly contract landscaper to show up (whether it needed cutting or should have been cut twice that week). When I began to pay more attention, I realized how many homes were using small electric robotic lawnmowers that run almost all day, and almost every day. I have never seen even one in the US north east?? Instead I see literally hundreds of landscape contractors driving $85K+ Ford F150s towing covered trailers on the roads scurrying to the next yard. I found myself wondering how many lawns do you have to cut and at what price must they charge to just cover their truck’s monthly lease?
I also found myself wondering on my flight home, first cancelled (crew shortage), then delayed (maintenance problems) and finally arriving in Boston, inconveniently stranded as the “grave yard” shift was cleaning the airport — if we have lost our way? Is the US standard of living still what the media and advertising shrills tell us it is?
The beautiful homes I visited were. In almost all instances, owned by families where no one had attended a University! Few had ever had a mortgage and none had lived anywhere further than 20 miles from where they were born. Frankly, we were wonderfully hosted as though no one really needed to work anymore? When I then read Jim Quinn’s rant (below: The US Spinning Out of Financial Control), it resonated with me. Maybe it will for you also?
WHAT YOU NEED TO KNOW!
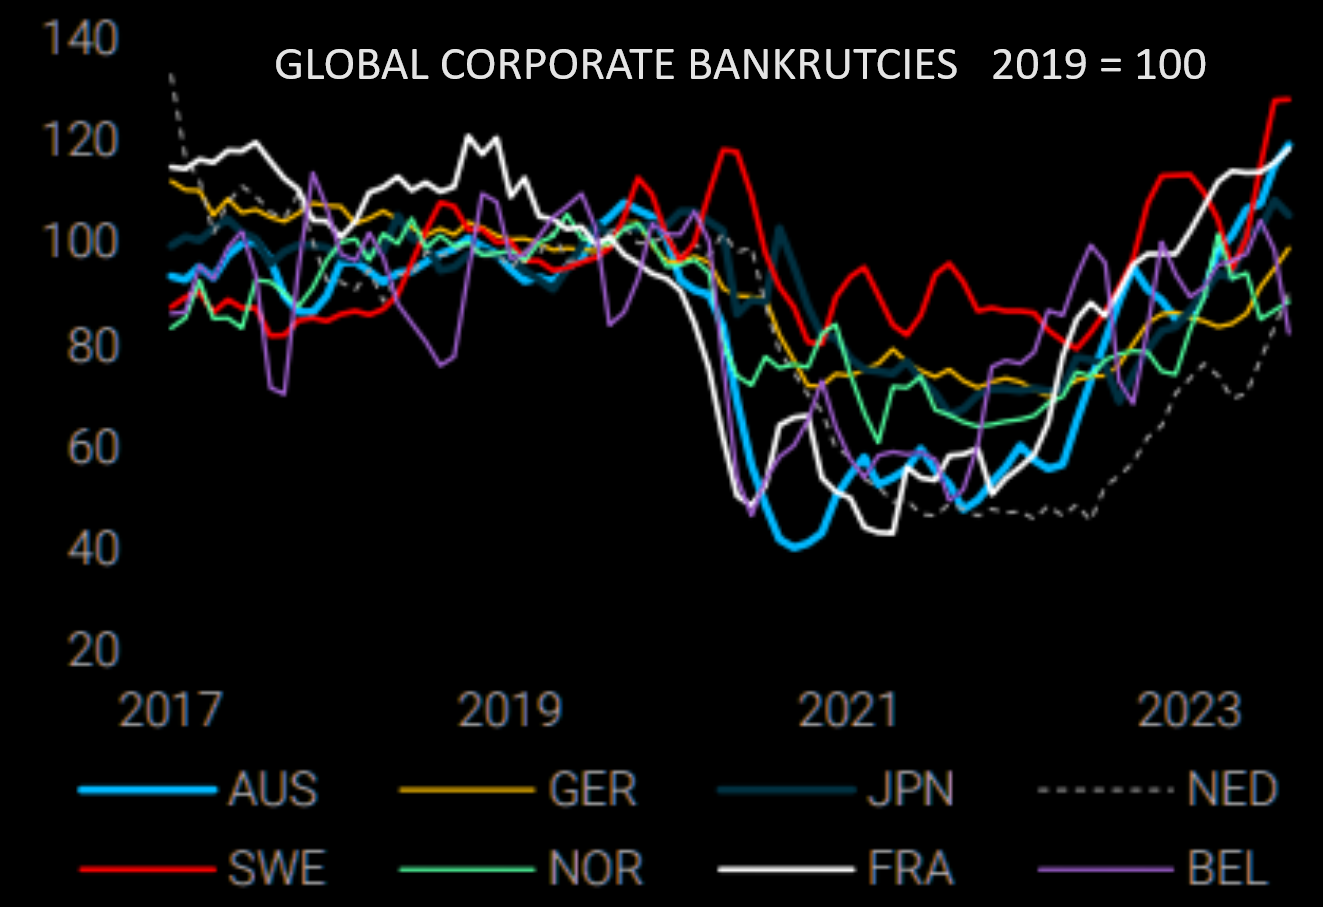 BANKRUPTCIES INCREASING GLOBALLY
Bankruptcies are increasing globally with the trend consistent across major countries. This suggests the combination of central bank rate increases and slowing global trade are now taking their toll! The IMF this week cut the the global Real GDP for 2024 to reflect slowing trade. Expect “Zombie” Corporations dependent on low rates for their survival to soon join this trend.
RESEARCH
IS THE US BEGINNING TO SPIN OUT OF FINANCIAL CONTROL?
-
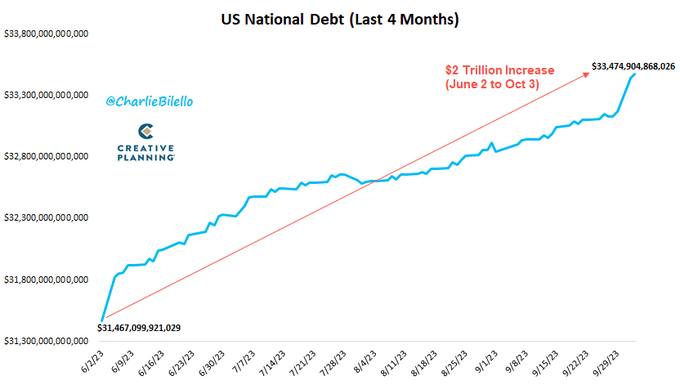
- THE EXPLOSION IN US FEDERAL DEBT: Last week the US national debt increased by $275 billion in just one day!
- THE EXPLOSION IN CONSUMER CREDIT CARD DEBT: Inflation is raging at double digits since Biden took office.
- RISING DELINQUENCY RATES: Delinquency rates are now the highest in eleven years.
- CREDIT CARD SPENDING HITS A BRICK WALL: It appears someone pulled the punch bowl away in the last month, as the change in credit card spending has crashed.
- THE STUDENT LOAN DEBACLE: The 43 million borrowers now have to start repaying the $1.76 trillion they borrowed for questionable degrees.
- THE MORTAGE DEBACLE AND UNAFFORDABLE HOUSING: The flippers will falter first. Once unemployment starts to accelerate, the newer buyers, who bid 25% above asking price last year, will be taught a lesson they’ll never forget.
- CAR LOANS: With average interest rates of 7% for new cars and 11% for used cars, average loans over 72 months and an average new auto price of $48,000, the auto industry is about to implode, just as their union workers are looking for a 40% pay increase. Expect bankruptcies and increasing layoffs in their future.
Q3 EARNINGS SEASON BEGINS!
WE BELIEVE IT IS THE PE RATIOS THAT WILL NOW FALL, THOUGH EARNINGS CAN BE EXPECTED TO BEAT
AS ANALYST HAVE YET TO PROPERLY REFLECT THIS!
GLOBAL ECONOMIC REPORTING: What This Week’s Key Global Economic Reports Tell Us?
-
- According to a recent OECD report, it is a worry for the world economy as a plurality of nations are in the “red zone”, suggesting their best recent days are behind them.
- US CPI: Headline CPI was hotter than expected with the M/M rising 0.4% (exp. 0.3%), but easing from the 0.6% pace in August.
- US PPI: Headline PPI rose 0.5% M/M in September (prev. 0.7%), above the consensus 0.3%, with the Y/Y lifting 2.2% (prev. 2.0%, exp. 1.6%). Core metrics also surpassed expectations with M/M and Y/Y climbing 0.3% (exp. & prev. 0.2%) and 2.7% (exp. 2.3%, prev. 2.5%), respectively.
DEVELOPMENTS TO WATCH
 BANKING COLLATERAL ISSUES QUIETLY BEING DISCUSSED
There is a lot of quiet central banker & treasury talk going on:
-
- The US Treasury is driving the World Bank and others to finalize plans for callable capital by April.
- UK Prudential Regulation Authority approached a number of large UK lenders in the past week to see if they were interested in Metro Bank (MTRO LN), according to FT.
- Why did PBoC Governor Pan meet with Fed Chair Powell in Morocco on October 12th and exchange views on cooperation, according to Reuters citing the PBoC?
IMF TAKES OUTLOOK DOWN – AGAIN!
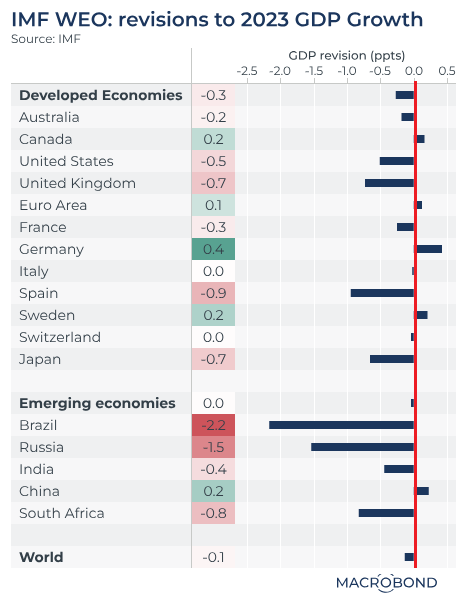
Early this year the IMF boosted its 2023 outlook on optimism about China’s reopening. But the IMF had a history of reducing its medium-term forecasts. In an atmosphere of slowing global growth, the IMF updated its World Economic Outlook (WEO) again on Oct. 10, with mostly downward revisions compared to the IMF’s previous outlook published in April.
IS THE US BEGINNING TO SPIN OUT OF FINANCIAL CONTROL?
 Long time financial writer Jim Quinn of The Burning Platform blog simply lost it last week and went on a full rant! What he had to say covered a lot of ground interspersed with rage, sarcasm and flat out discouragement. I distilled below the hard facts and charts that support his heart-felt disappointment in our US political leadership. His writing resonated with me after just coming from Europe and seeing the US situation in a more honest light. Our political leadership wrangling is disgracing America on the world stage while the country appears increasingly to be crumbling!
1- THE EXPLOSION IN US FEDERAL DEBT
Last week the US national debt increased by $275 billion in just one day!
The annual deficit in 2007, before the Wall Street/Fed created financial disaster, was $160 billion. The entire national debt after 200 years as a nation was $2.9 trillion.
In the last four months the current administration has added $2 trillion to the national debt.
 With interest rates at sixteen year highs, the interest on the national debt will exceed $1 trillion per year, on a path to $1.5 trillion.
It was $400 billion prior to the 2008 financial crisis.
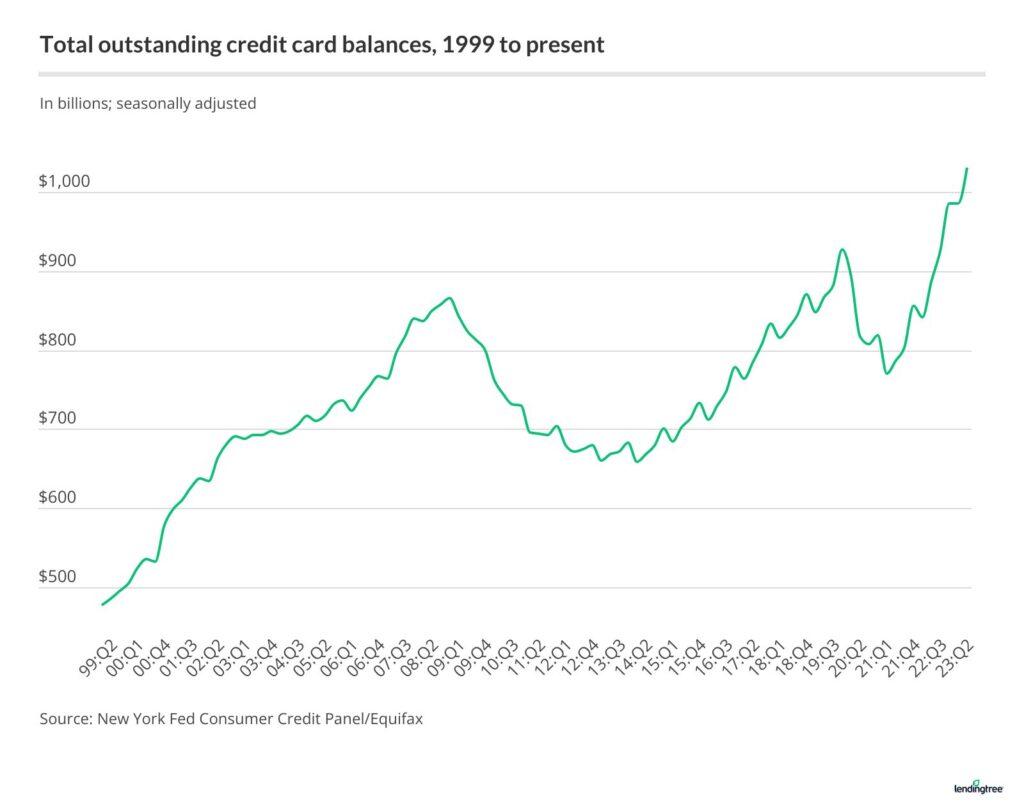
2- THE EXPLOSION IN CONSUMER CREDIT CARD DEBT
Credit card debt now exceeds $1 trillion, with over 50% of borrowers carrying a balance from month to month, and average interest rates charged by the Wall Street lenders at 21%.
Credit card debt is up 60% since 2015 and up 120% since the start of this century.
Inflation is raging at double digits since Biden took office.
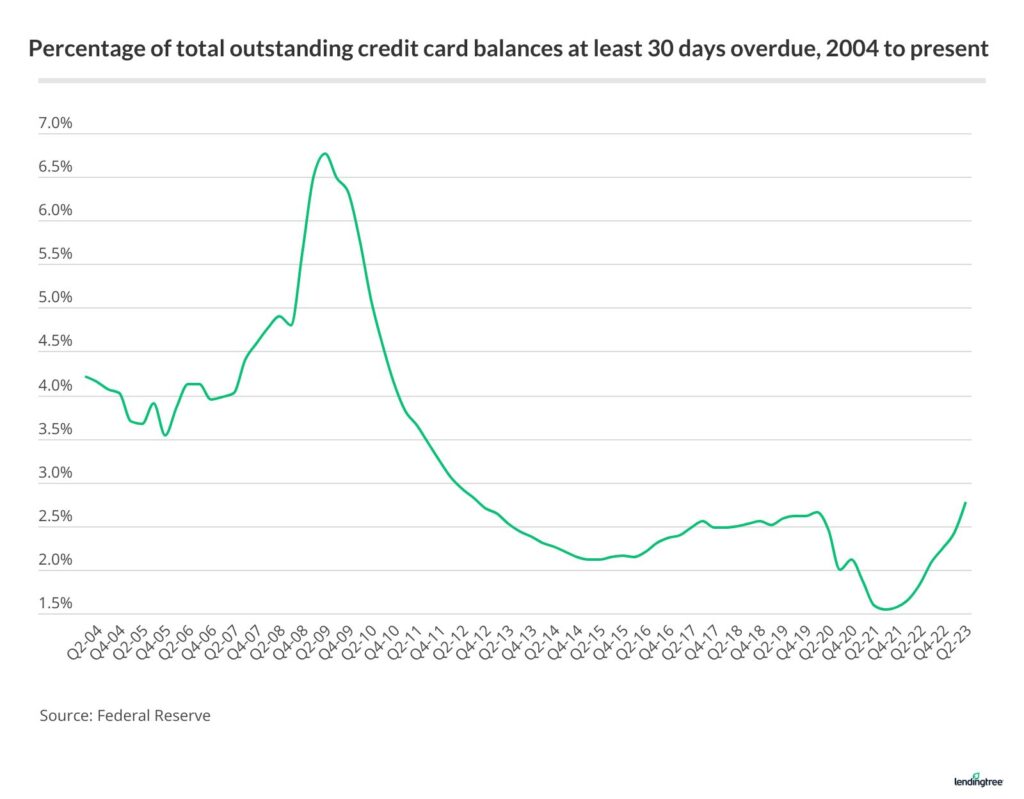 3- RISING DELINQUENCY RATES
Delinquency rates are now the highest in eleven years.
They were artificially suppressed by the billions of covid handouts, rent moratoriums and student debt payment suspensions, which are now fully spent.
Delinquencies have risen seven consecutive quarters and are now poised to accelerate as the economy contracts and the average student loan payment of $500 start this month.
4- CREDIT CARD SPENDING HITS A BRICK WALL!
It appears someone pulled the punch bowl away in the last month, as the change in credit card spending has crashed.
 This has been confirmed by multiple retailers reporting horrible sales results, in addition to the billions walking out their doors as reparations for the diverse downtrodden.
Once delinquencies begin to accelerate, the Wall Street cabal will all react in an identical manner, cutting credit lines and denying new credit to those who have no intention of paying them back. That will further reduce credit card spending and worsen the economy, as 70% of GDP depends upon the masses spending money they don’t have on things they don’t need.
5- THE STUDENT LOAN DEBACLE
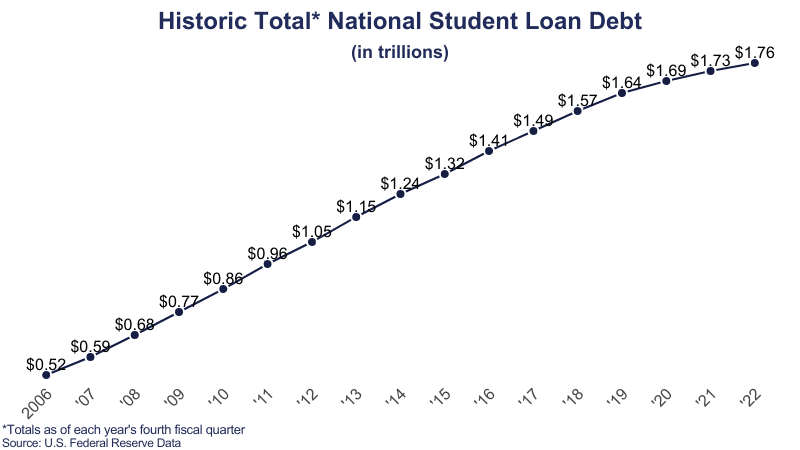 The student loan debacle, created by Obama and his minions, is about to blow up in the faces of millennials and Gen Z, now that Biden’s UN-Constitutional method of buying votes through bribing lesbian and African studies graduates, by not making them pay their legal obligations, has come to an end.
The 43 million borrowers now have to start repaying the $1.76 trillion they borrowed for worthless degrees.
This will mean $70 billion will not be spent on autos, gadgets, bling, vacations, sporting events, rent and lattes. The recession that has been predicted forever is coming fast, and the markets know it.
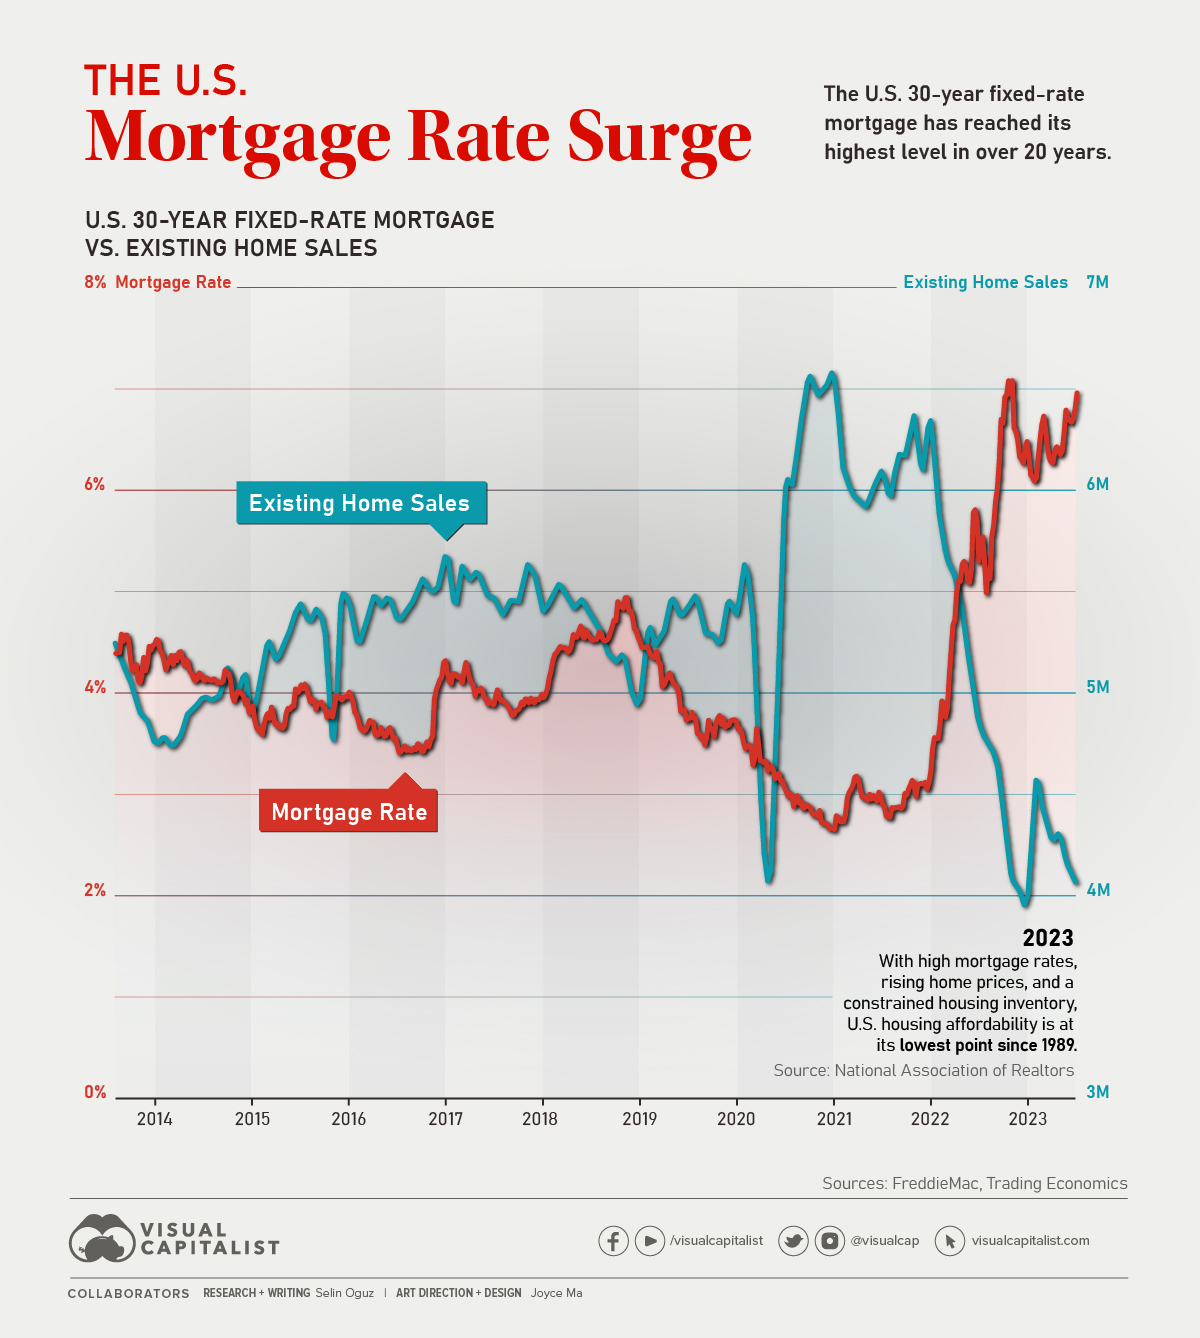 6- THE MORTAGE DEBACLE AND UNAFFORDABLE HOUSING
With mortgage rates at 7.9% and home prices at all-time highs, the housing market is Wiley Coyote suspended in motion, just before he plummets to the bottom of the canyon.
There will not be a soft landing.
The flippers will falter first. Once unemployment starts to accelerate, the newer buyers, who bid 25% above asking price last year, will be taught a lesson they’ll never forget. Once the housing crash starts, it will go on for several years, just as it did from 2006 through 2012. An unsustainable trend will not be sustained.
7- CAR LOANS
With average interest rates of 7% for new cars and 11% for used cars, average loans over 72 months and an average new auto price of $48,000, the auto industry is about to implode, just as their union workers are looking for a 40% pay increase. I see bankruptcies and massive layoffs in their future.
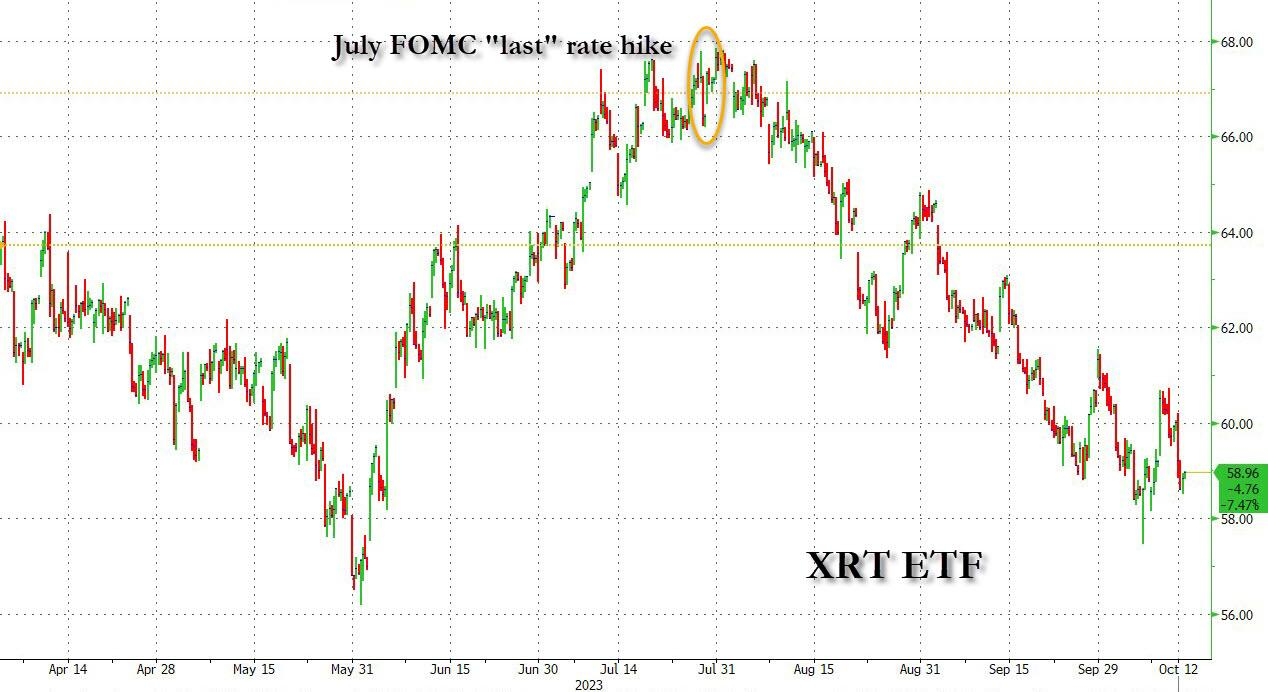
THE LAST RATE HIKE BROKE THE US CONSUMER!
(XRT: Retail ETF)
Essentially the country is a room full of unstable powder kegs and we have a plethora of mediocre, low IQ, diversity hires running around the room celebrating whatever LGBTQ+++++ day it is by lighting matches. The actions of those purportedly in charge of the country are designed to create chaos, havoc, violence, despair and financial collapse. They have set events in motion and there is absolutely nothing that can be done or will be done to stop it. You should be angry, because no matter what preparations you’ve made, you will still bear the brunt of the coming storm.
Q3 EARNINGS SEASON BEGINS
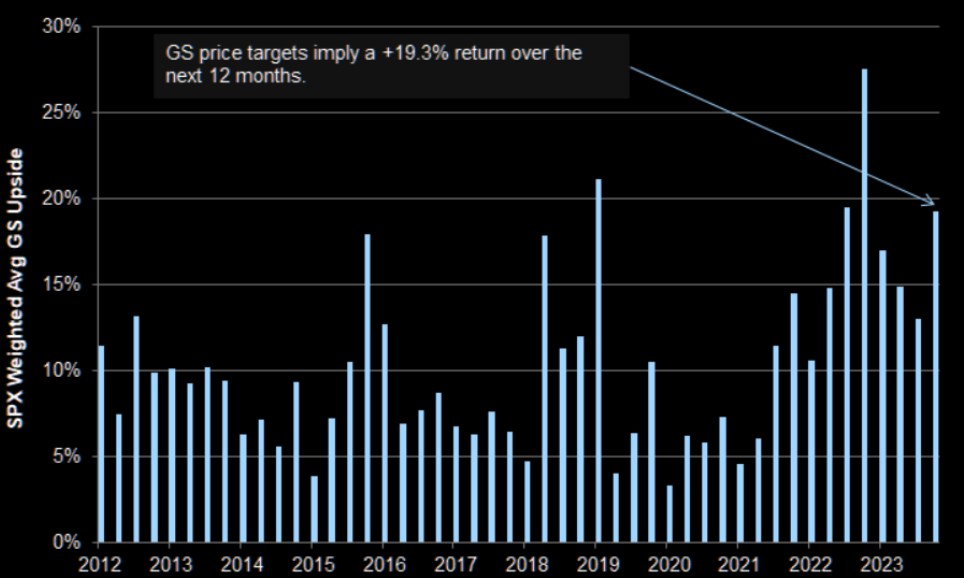 The “Sell Side” optimism of Goldman Sachs, in reflecting expectations of 19.3% S&P 500 returns over the next 12 months, does not match “Buy Side” expectations like ours.
For Goldman’s outlook to be even possible, it means no US Recession, global trade soon significantly increases and central banks dropping rates at least 100 bps. If that occurs, then Goldman fails to point out that Inflation will be raging at north of 5% and the US Dollar devaluation will have robbed you of your gains in purchasing power. Of course Goldman works closely with the current administration, and that may be exactly the plan?? I can’t see the current Republican House majority going along with this short of a major global Geo-Political Crisis.
Currently going into Q3 earnings season, estimates are for Q3 earnings to decline -0.3% Year-over-Year. If -0.3% is the actual decline for the quarter, it will mark the fourth straight quarter of Y-o-Y earnings declines reported by the index. We believe earnings will continue to show weakness. Earnings revisions since June 30, have been a higher -0.4%.
Only four sectors are expected to report higher earnings compared to June 30 due to upward revisions to EPS estimates. So far 76 S&P 500 companies have issued negative EPS guidance and 42 S&P 500 companies have issued positive EPS guidance.
Meanwhile the forward 12-month P/E ratio for the S&P 500 is 17.7. This P/E ratio is below the 5-year average (18.7) but above the 10-year average (17.5).
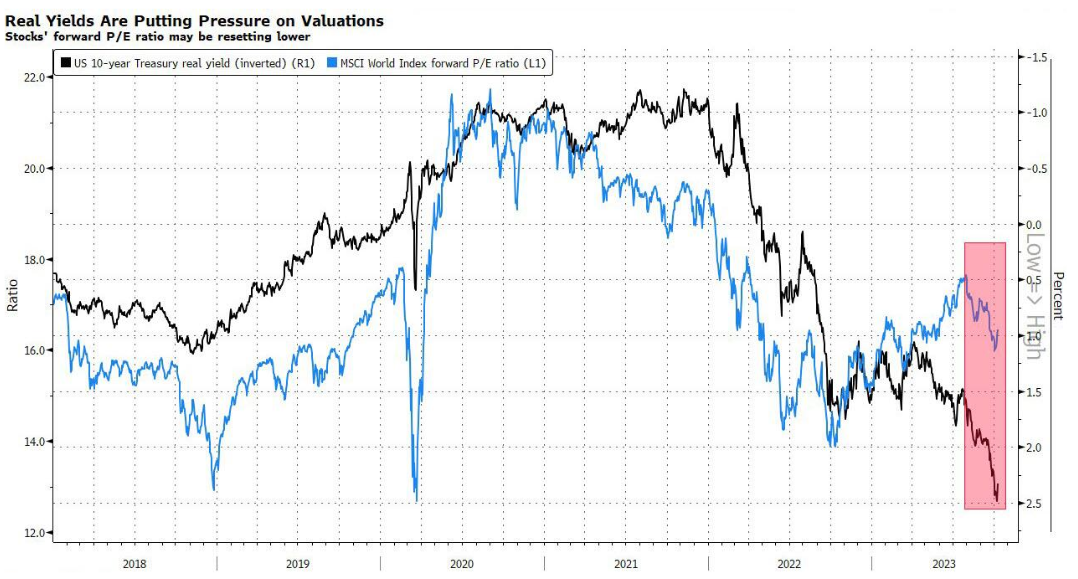
WE BELIEVE IT IS THE PE RATIOS THAT WILL NOW FALL, THOUGH EARNINGS CAN BE EXPECTED TO BEAT, AS ANALYSTS HAVE YET TO PROPERLY REFLECT THIS!
CHART BELOW
Real yields are putting pressure on valuations. Stocks’ Forward P/E ratio may be setting lower as real rates have recently been moving towards 2.5%, thereby widening the gap considerably. We are likely to expect PEs to fall towards closing the gap, as last week Real Rates began pulling back to also close the gap. The S&P 500 could be expected to move towards 15-16 from the current 17.7 level.
Q3 EARNINGS REPORTING
 The Financials sector will be a sector in focus for the market during the next two weeks, as more than 40% of the S&P 500 companies that are scheduled to report earnings for the third quarter over this period are part of this sector.
Companies in this sector expected to report earnings during these two weeks include:
-
- American Express
- Bank of America
- Citigroup
- Goldman Sachs
- JPMorgan Chase
- Morgan Stanley
- Wells Fargo.
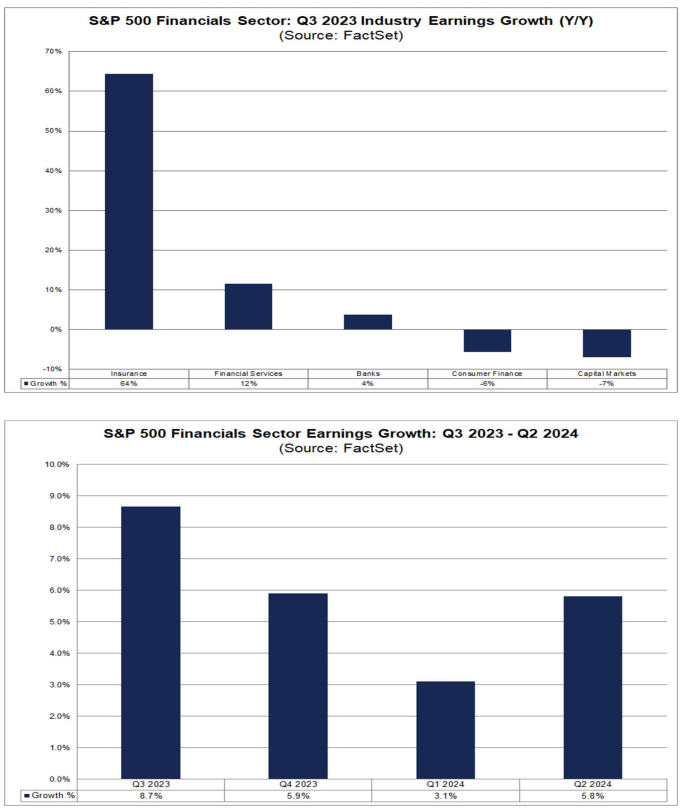
The Financials sector is predicted to report the fourth highest (year-over-year) earnings growth rate of all eleven sectors for Q3 at 8.7%.
At the industry level, three of the five industries in the sector are expected to report year-over-year earnings growth, led by the Insurance industry at 64%. This industry is also expected to be the largest contributor to earnings growth for the sector. If the Insurance industry were excluded, the estimated earnings growth rate for the Financials sector would fall to 2.1% from 8.7%. At the sub-industry level, the Property & Casualty Insurance (113%) and Multi-line Insurance (77%) subindustries are predicted to report the highest earnings growth rates within this industry. The Reinsurance sub-industry is expected to report a profit in Q3 2023 after reporting a loss in Q3 2022.
The Financial Services industry is projected to report the second-highest (year-over-year) earnings growth rate in this
sector at 12%. Both sub-industries in this sector are expected to report double-digit earnings growth: Multi-Sector Holdings
(18%) and Transaction & Payment Processing Services (10%).
The Banks’ industry is predicted to report the third highest (year-over-year) earnings growth rate in the sector at 4%. At the
sub-industry level, the Diversified Banks sub-industry is expected to report earnings growth of 7%, while the Regional
Banks sub-industry is expected to report a decline in earnings of -15%.
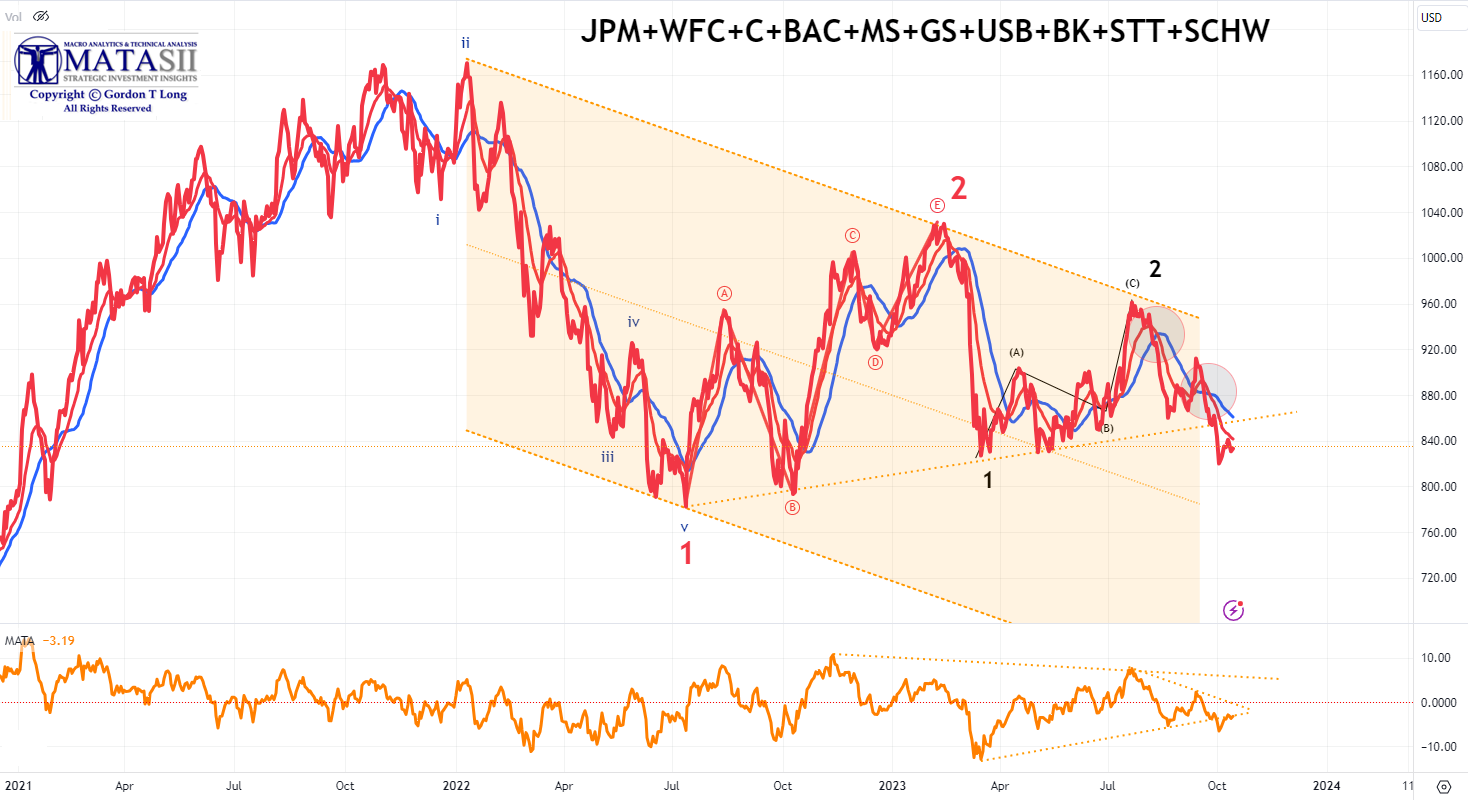
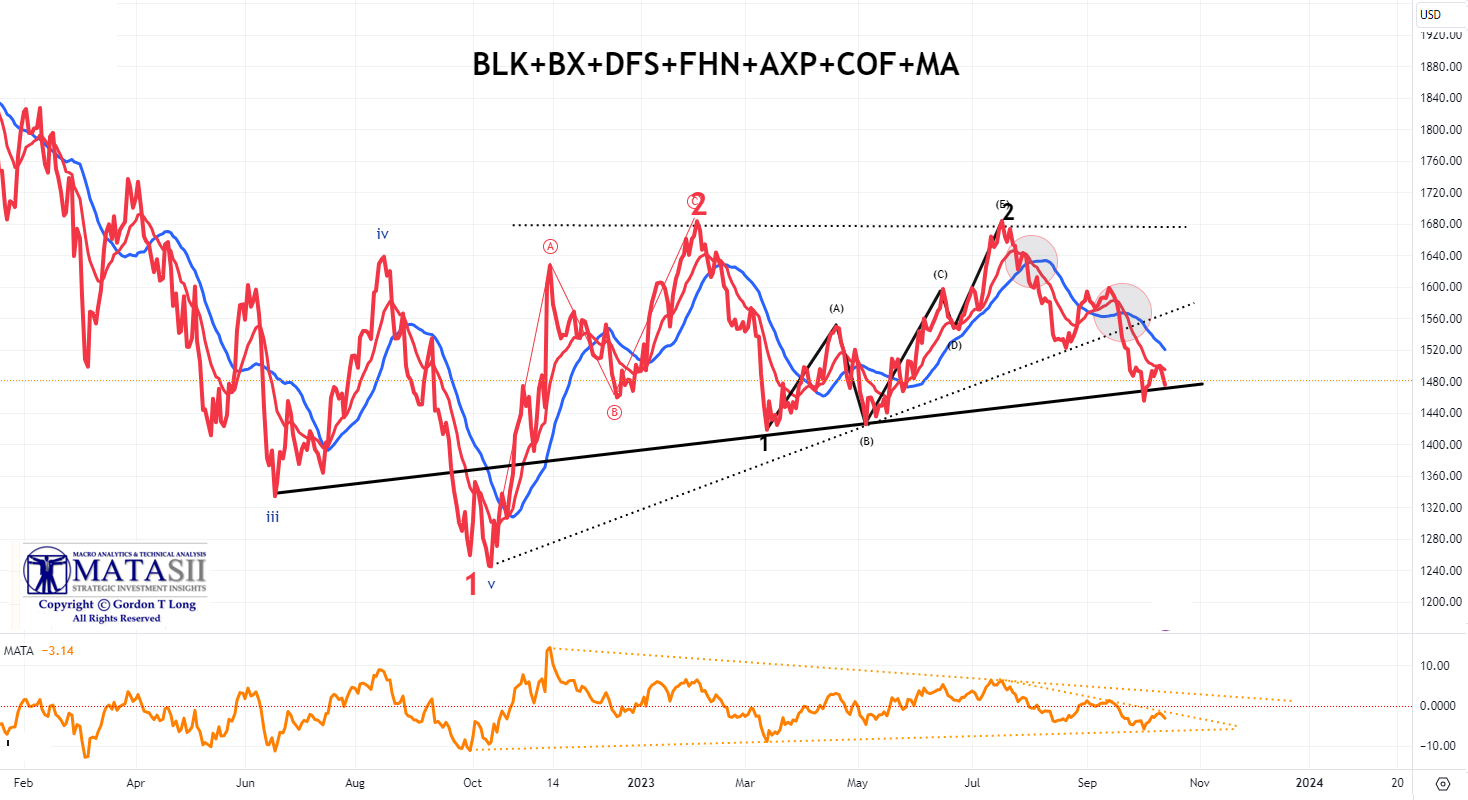
With the following reported on Friday, we have updated the MATASII Banking and Financial Index with the PROPRIETARY MATASII CROSS & MATASII MOMENTUM INDICATOR.
-
- JPM
- C
- WFC
- BLK
S&P 500 VERSUS BANKS & FINANCIALS
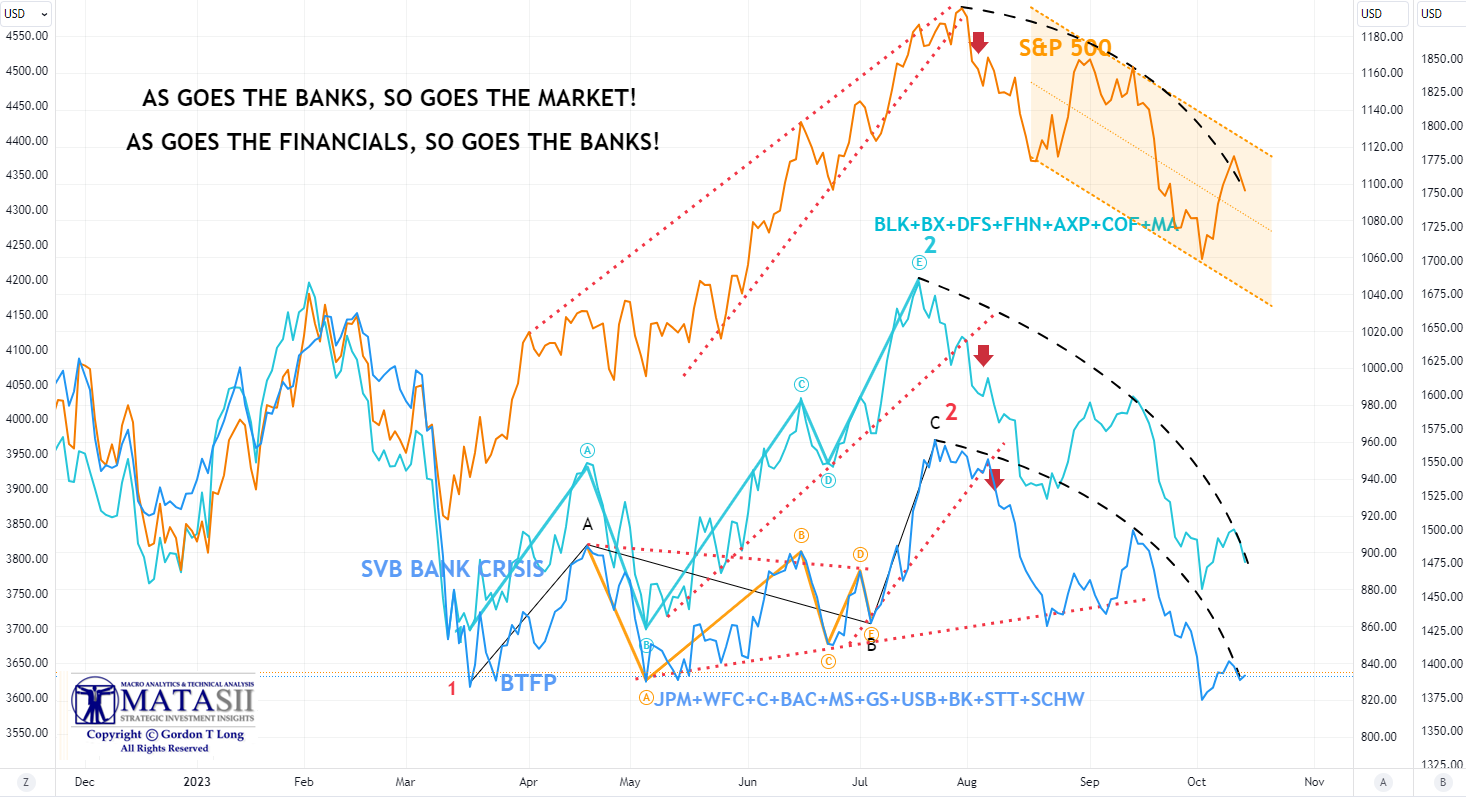
BANKS
A MATASII CROSS DAILY SELL Signal!
FINANCIALS
A MATASII CROSS DAILY SELL Signal!
KEY Q3 REPORTS
-
- Delta Air Lines (DAL) earnings beat and the FY revenue guide was strong, as it noted robust demand for travel is continuing into the December quarter. However, it cut its FY EPS view and next quarter guidance was slightly underwhelming.
- Walgreens Boots Alliance (WBA) beat on revenue and Q1 EPS guidance. Expect benefits from cost savings and US healthcare to have a muted impact in Q1, expected to scale over the balance of the year. Note, profit missed and FY24 guidance was light. Domino’s Pizza (DPZ) surpassed expectations on profit but missed on revenue.
- JPMorgan (JPM) posted a strong report; EPS, revenue, NII, IB and FICC revenue all topped expectations with provision for credit losses lower than forecasted. Looking ahead, company raised FY23 NII view.
- Wells Fargo (WFC) topped Wall St. consensus on EPS, revenue and NII, alongside raising Q4 and FY23 guidance for net interest income.
- UnitedHealth (UNH) earnings beat and lifted the lower end of the FY profit guidance range.
- BlackRock (BLK) missed on revenue but did beat on profit. In the quarter, clients pulled USD 13bln from long-term funds, which marks the first outflow since the onset of the pandemic.
- Citigroup (C) surpassed expectations on the top and bottom line, with the breakdown also strong. Raised FY23 NII ex-markets view and affirmed FY23 revenue guide.
- PNC (PNC) profit and NII beat, but revenue, net interest margin, and deposits missed. Looking ahead, for Q4 sees NII down 1-2% Q/Q.
- Progressive (PGR) topped expectations on net premiums written, net premium earned and EPS.
FINANCIALS COMMENTARY:
-
- JPMorgan (JPM) noted credit card growth may slow down going ahead and expect muted loan growth. Credit card charge-offs are normalizing, while the pace of buybacks will remain modest. They have a healthy pipeline in corporate and IB for Q4 and are a bit more optimistic compared to last quarter. There will continue to be upward pressure on deposits, and we’ll have to reprice some deposits at some point. Concludes they could see some upward pressure on margins as expenses rise.
- Citi (C) expects continued normalization of net credit losses in cards and also sees modest buybacks in Q4. Notes continued deceleration in spending indicates an increasingly cautious consumer. US consumers remain resilient, but there is some pressure on lower FICO score clients.
- PNC (PNC) CEO noted they will continue to be diligent in expense management going forward. Deposits continue to decline, the bank expected that, but that decline is slowing.
- Wells Fargo (WFC) CFO said increased guidance is still the “best guess” and the economy is still doing well so far, and deposit pricing has remained competitive. Commercial deposits have been stable.
GLOBAL ECONOMIC INDICATORS: What This Week’s Key Global Economic Releases Tell Us
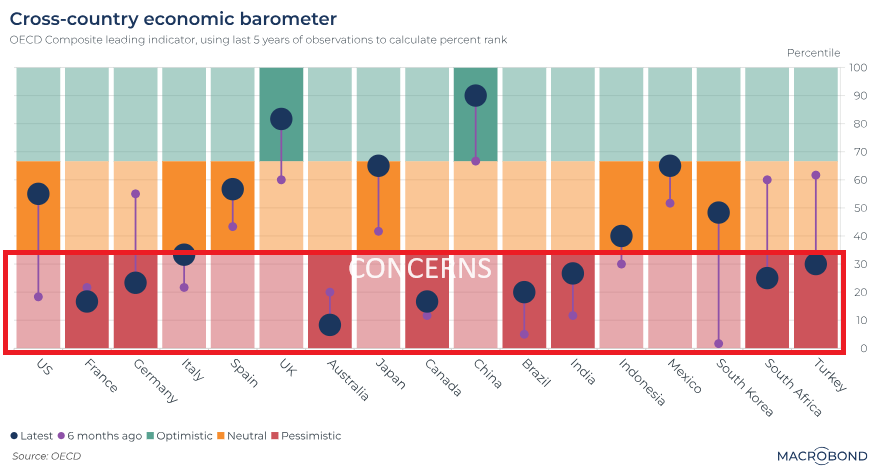 The chart to the right tracks the OECD’s Economic Composite Leading Indicator for 17 major economies.
In the OECD’s words: it’s “designed to provide early signals of turning points in business cycles,” using future-sensitive economic data points that measure early-stage production and respond rapidly to changing circumstances.
Readings are divided into red, yellow and green, based on their percentile over five years. Also added are smaller dots to show the six-month trajectory.
Worryingly for the world economy, a plurality of nations are in the red zone, suggesting their best recent days are behind them.
-
- Deterioration over six months is noted for Germany, Turkey and South Africa. But the indicator shows improvement for the US and Japan.
- China was in the headlines in 2023 for an underwhelming rebound, and Britain’s travails post-Brexit are well-known. But according to the OECD, these two nations have improving economic momentum – relative to their own past five-year experience, that is.
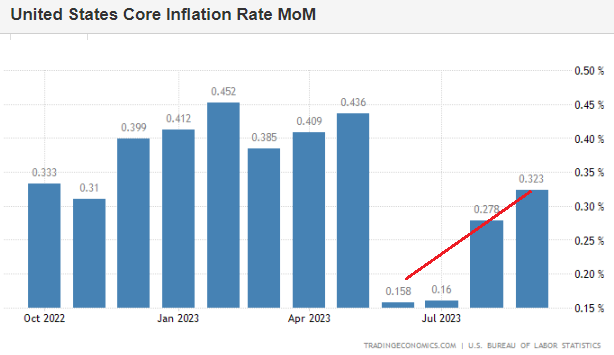 CPI
CPI
-
- US CPI YY (Sep) 3.7% vs. Exp. 3.6% (Prev. 3.7%)
- US Core CPI YY (Sep 2023) 4.1% vs. Exp. 4.1% (Prev. 4.3%)
- US Cleveland Fed CPI (Sep) 0.5% (Prev. 0.3%)
Headline CPI was hotter than expected with the M/M rising 0.4% (exp. 0.3%), but easing from the 0.6% pace in August.
-
- The Y/Y maintained a 3.7% pace, above the 3.6% consensus.
- The core metrics, however, were in line with expectations seeing the M/M rise at a 0.3% pace, matching the prior month and the Y/Y pace eased to 4.1% from 4.3%.
- Overall, it was a hawkish reaction on the hot headline, which also shows prices as more sticky and supports the argument that the return to 2% still has some way to go. On the plus side, it does not appear to be broadly accelerating. Note: The report stated the index for shelter was the largest contributor to the monthly all-items increase, accounting for over half of the increase.
- The main data left before the November FOMC will be the September PCE report, but it is widely expected the Fed will stand pat in November as they “proceed carefully” and perhaps reassess in December when more data is available.
- Money markets currently assign a ~40% probability of a December hike, but as it stands a lot of Fed commentary has suggested further rate hikes may not be needed given tighter financial conditions.
- However, if the recent backup in yields has been driven by strong economic growth prospects, the Fed may have to act.
- Nonetheless, the question the FOMC is now turning to is how long should the Fed keep rates restrictive. This data supports their “higher for longer” message.
- Money markets are now pricing in the first Fed rate cut in July with 70bps of cuts priced for all of 2024, but that is still more dovish than the Fed’s September Dot Plot median of 5.1%.
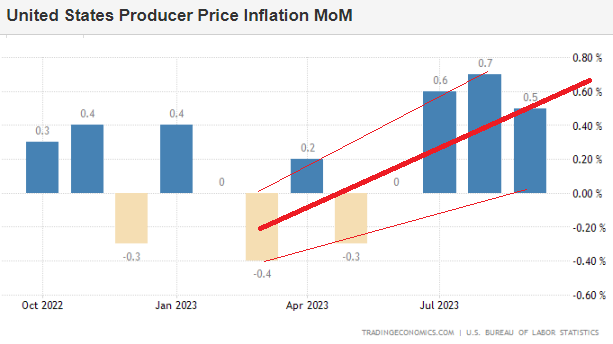 PPI
PPI
-
- US PPI ex. Food/Energy YY (Sep) 2.7% vs. Exp. 2.3% (Prev. 2.2%)
- US PPI Final Demand YY (Sep) 2.2% vs. Exp. 1.6% (Prev. 1.6%, Rev. 2.0%)
Overall, PPI was hotter than expected.
-
- Headline PPI rose 0.5% M/M in September (prev. 0.7%), above the consensus 0.3%, with the Y/Y lifting 2.2% (prev. 2.0%, exp. 1.6%).
- Core metrics also surpassed expectations with M/M and Y/Y climbing 0.3% (exp. & prev. 0.2%) and 2.7% (exp. 2.3%, prev. 2.5%), respectively.
- Although, the super-core measure (ex-Food/Energy/Trade) Y/Y eased in September to a pace of 2.8% (prev. 2.9%).
- The headline was boosted by a 0.9% increase in food prices and a 3.3% jump in energy prices, where Pantheon Macroeconomics note that “neither of which is likely to be repeated this month, and the recent drop in gasoline prices alone will subtract about 0.4% from the October headline.”
- Elsewhere, despite the persistent rise in core services, core goods prices continue to moderate and rose only 0.4% annualised throughout Q3, as goods demand continues to fall.
- As such, analysts add, this trend should continue over the course of the year as demand for goods falls amid slowing consumer appetites and the economy slows as tighter lending conditions dampen business activity.
- Overall, while Fed officials are committed to bringing down inflation and greater weight will be put on the CPI release on Thursday, elevated prices keep the risks of additional rate hikes in play, but for now, markets are strongly suggesting that Fed rate hikes are over.
GLOBAL MACRO
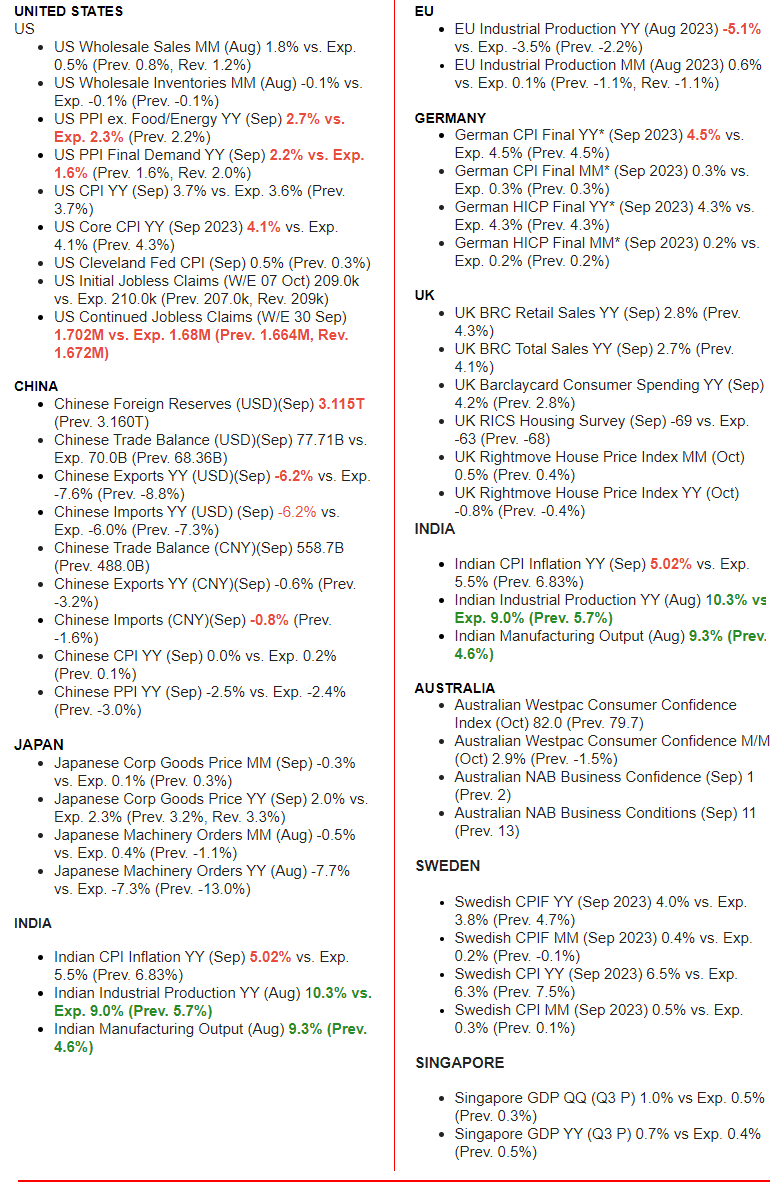
WHAT DOES YOUR SCAN OF THE DATA BELOW TELL YOU? – THE MEDIA AVOIDS BAD NEWS!
We present the data in a way you can quickly see what is happening.
THIS WEEK WE SAW
Exp=Expectations, Rev=Revision, Prev=Previous
DEVELOPMENTS TO WATCH
 BANKING COLLATERAL ISSUES QUIETLY BEING DISCUSSED
There is a lot of quiet talk going on:
The US Treasury is driving the World Bank and others to finalize plans for callable capital by April.
-
- US Treasury official said giving more value to callable capital in balance sheets could unlock significantly more financing power for multilateral development banks,
- BoJ said it will amend the rules based on a regular review of the appropriateness of collateral prices and margin ratios, in light of recent financial market developments with a view to maintaining the soundness of the Bank’s assets.
Separately:
-
- UK Prudential Regulation Authority approached a number of large UK lenders in the past week to see if they were interested in Metro Bank (MTRO LN), according to FT. It was later reported that Metro Bank secured a GBP 325mln capital raise, which includes GBP 150mln of new equity and GBP 175mln of new MREL issuance, alongside GBP 600mln of debt refinancing, while it is in discussions regarding an asset sale of up to GBP 3bln in residential mortgages, according to Reuters.
Separately:
-
- Why did PBoC Governor Pan meet with Fed Chair Powell in Morocco on October 12th and exchange views on cooperation, according to Reuters citing the PBoC?
IMF TAKES OUTLOOK DOWN – AGAIN!
Early this year, the IMF boosted its 2023 outlook on optimism about China’s reopening. But the IMF had a history of reducing its medium-term forecasts.
In an atmosphere of slowing global growth, the IMF updated its World Economic Outlook (WEO) again on Oct. 10. (Chart to the right). The chart measures (mostly downward) the revisions compared to the IMF’s previous outlook published in April.
-
- India is forecast to post the strongest growth, at 6.3 percent.
- Germany and Sweden are notable: they’re among the few countries to receive upward revisions, but the IMF predicts a recession for both.
Q4 EARNINGS SEASONS USUALLY MEANS
YEAR END VALUATION ADJUSTMENTS!
EXPECT PE RATIOS TO BEGIN WEAKENING
Click All Charts to Enlarge
1 – SITUATIONAL ANALYSIS
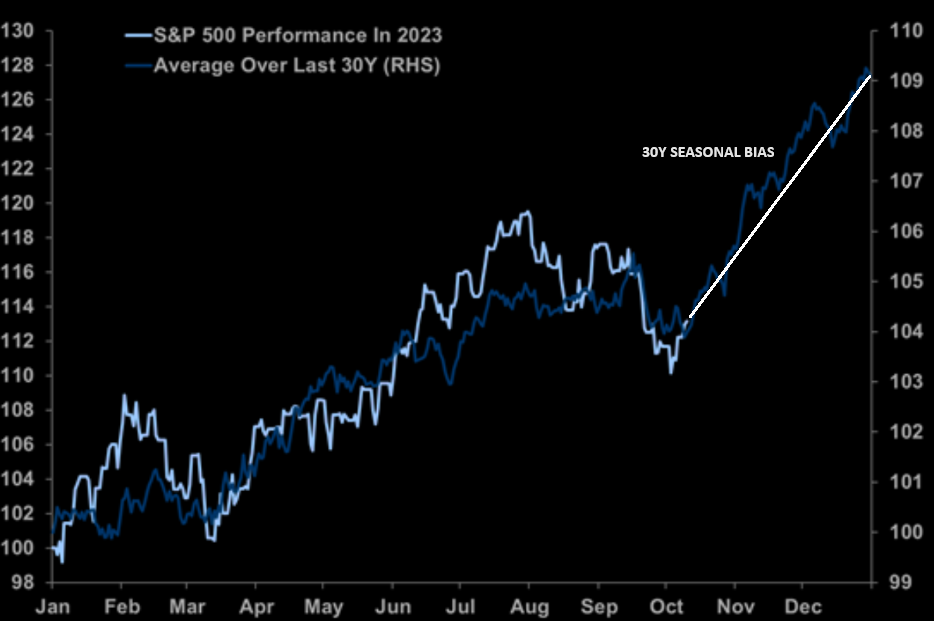 As the chart to the right illustrates, the seasonal bias for the S&P 500 has been extremely positive over the past 30 years.
Currently going into Q3 earnings season, estimates are for Q3 earnings to decline -0.3% Year-over-Year. If -0.3% is the actual decline for the quarter, it will mark the fourth straight quarter of Y-o-Y earnings declines reported by the index. We believe earnings will continue to show weakness. Earnings revisions since June 30, have been a higher -0.4%.
Only four sectors are expected to report higher earnings compared to June 30, due to upward revisions to EPS estimates. So far 76 S&P 500 companies have issued negative EPS guidance and 42 S&P 500 companies have issued positive EPS guidance.
Meanwhile the forward 12-month P/E ratio for the S&P 500 is 17.7. This P/E ratio is below the 5-year average (18.7), but above the 10-year average (17.5).
WE BELIEVE IT IS THE PE RATIOS THAT WILL NOW FALL THOUGH EARNINGS CAN BE EXPECTED TO BEAT AS ANALYSTS HAVE YET TO PROPERLY REFLECT THIS!
CHART BELOW
Real yields are putting pressure on valuations. Stocks’ Forward P/E ratio may be setting lower as real rates have recently been moving towards 2.5%, thereby widening the gap considerably. We are likely to expect PEs to fall towards closing the gap, as last week Real Rates began pulling back to also close the gap. The S&P 500 could be expected to move towards 15-16 from the current 17.7 level.
2 – FUNDAMENTAL ANALYSIS
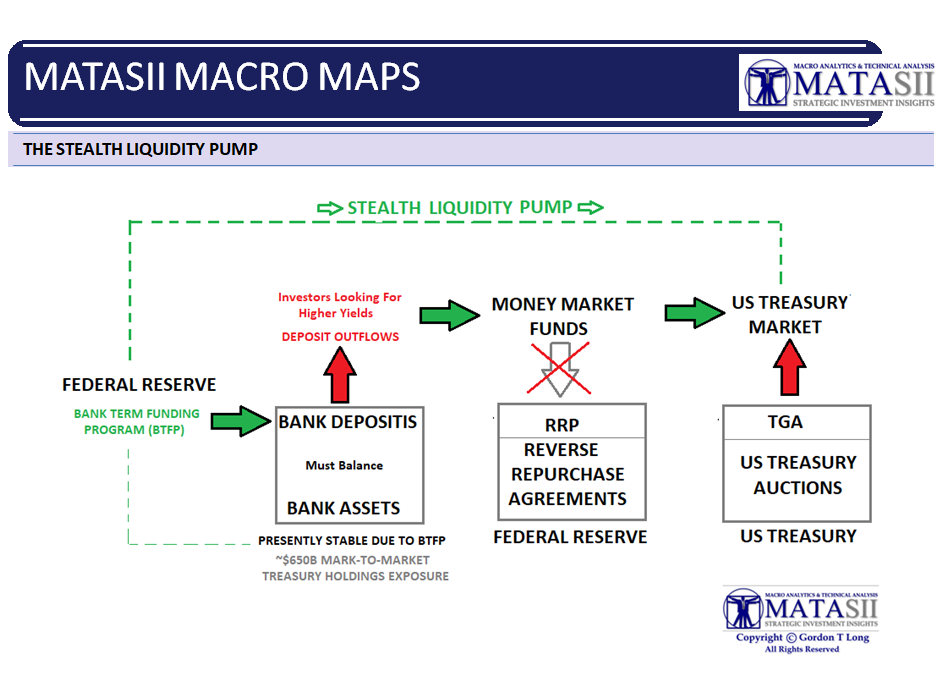 To have a positive impact on market liquidity, the Fed’s Reverse Repo Account must go down at a faster rate than the Bank Deposit Outflow Rate.
The Bidenomics Stealth Liquidity chart that we have shown before illustrates this.
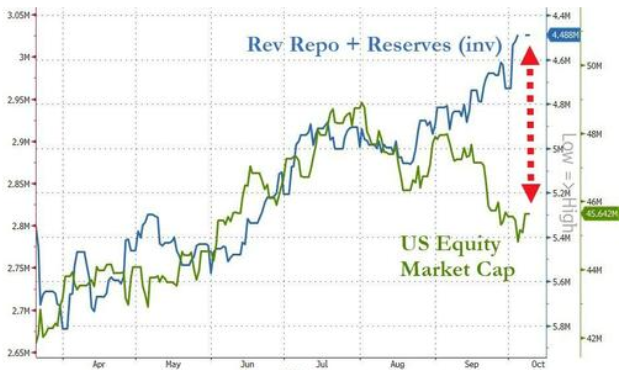
As the chart below shows the decline in reverse repo utilization (and reserves at the Fed), it suggests that the S&P 500 should in the near term be notably higher.
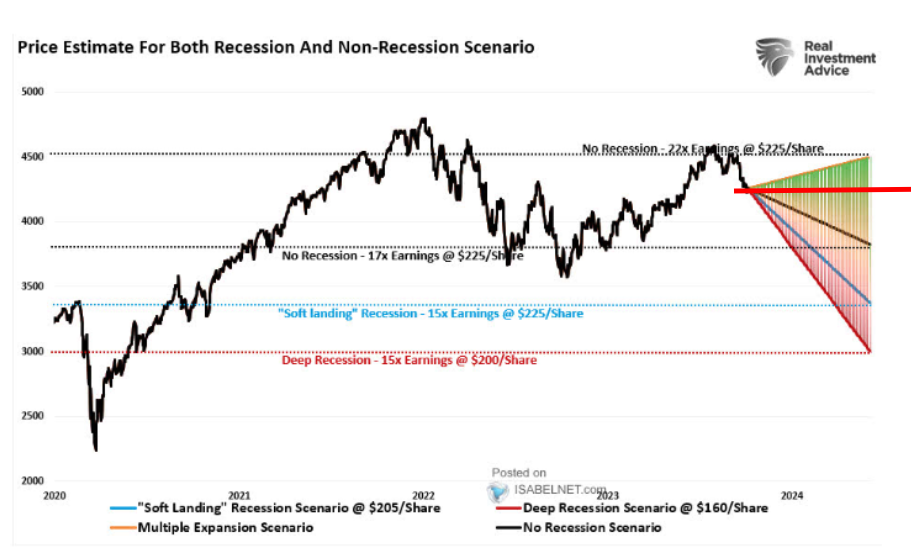
The current big “swing card” for both real rates and forward PE’s is the severity of recession we are likely to experience. The chances of no recession is low. We expect that, though the recession will be delayed, it will be more protracted and worse than we have recently been accustomed to.
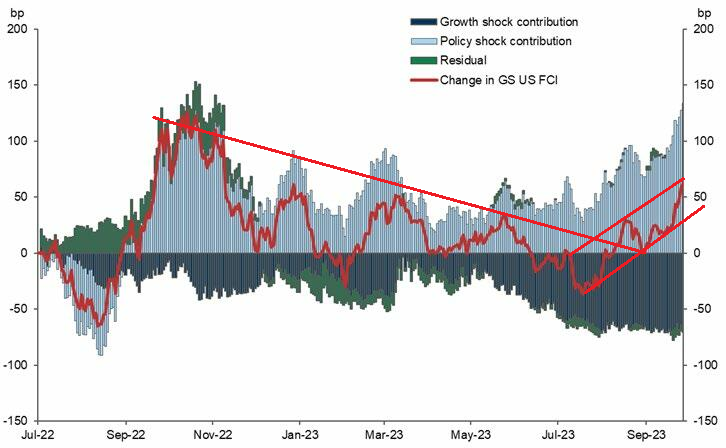
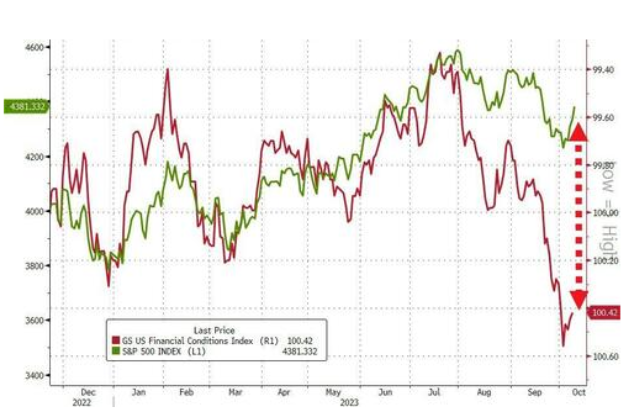
In the Intermediate term the recent tightening in the financial conditions index (chart right) suggests stocks should be considerably lower (chart below).
3 – TECHNICAL ANALYSIS
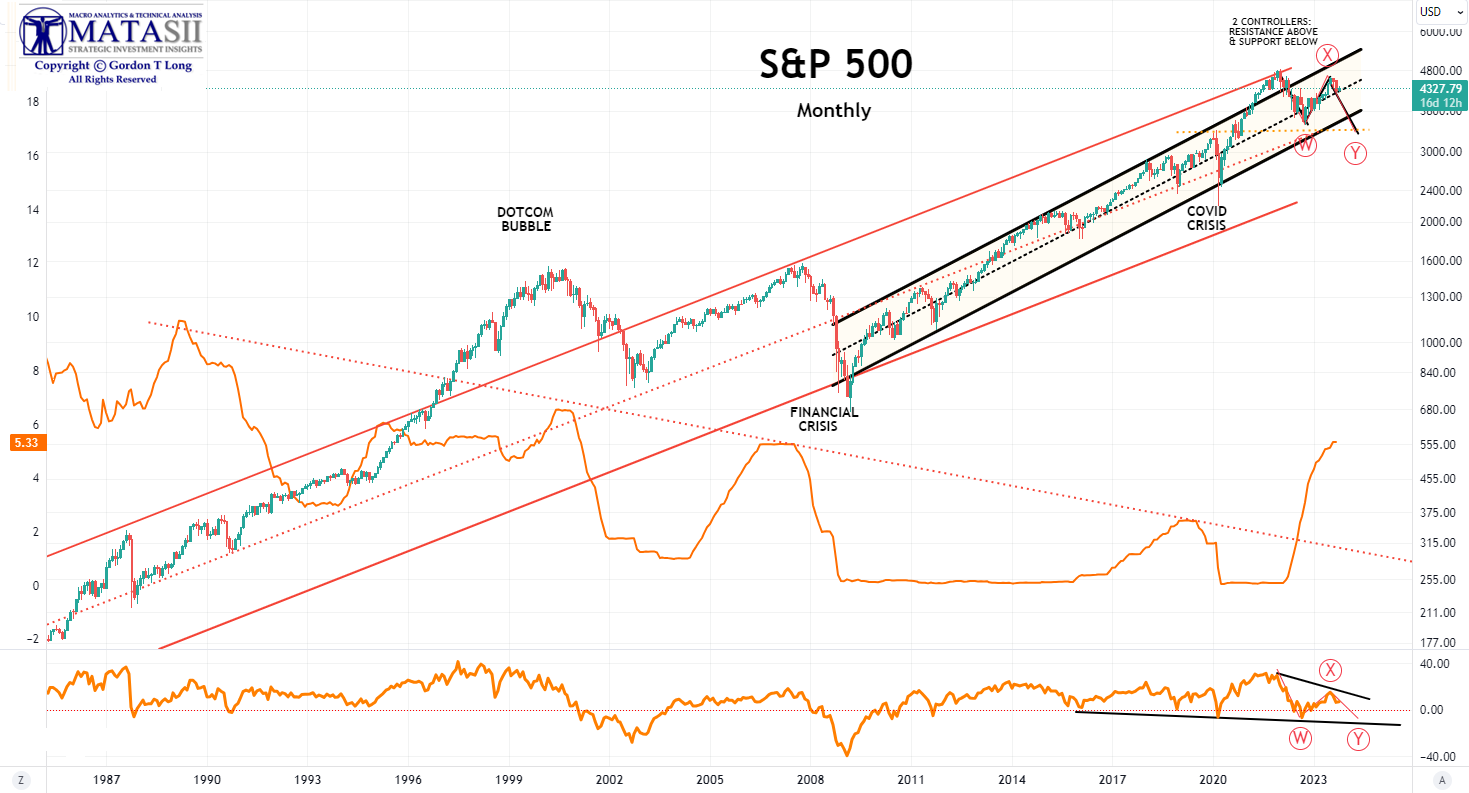
S&P 500 – Long Term View
We expect the S&P 500 to retrace much of the post Covid market rise over the next 8-15 months.
YOUR DESK TOP / TABLET / PHONE ANNOTATED CHART
Macro Analytics Chart Above: SUBSCRIBER LINK
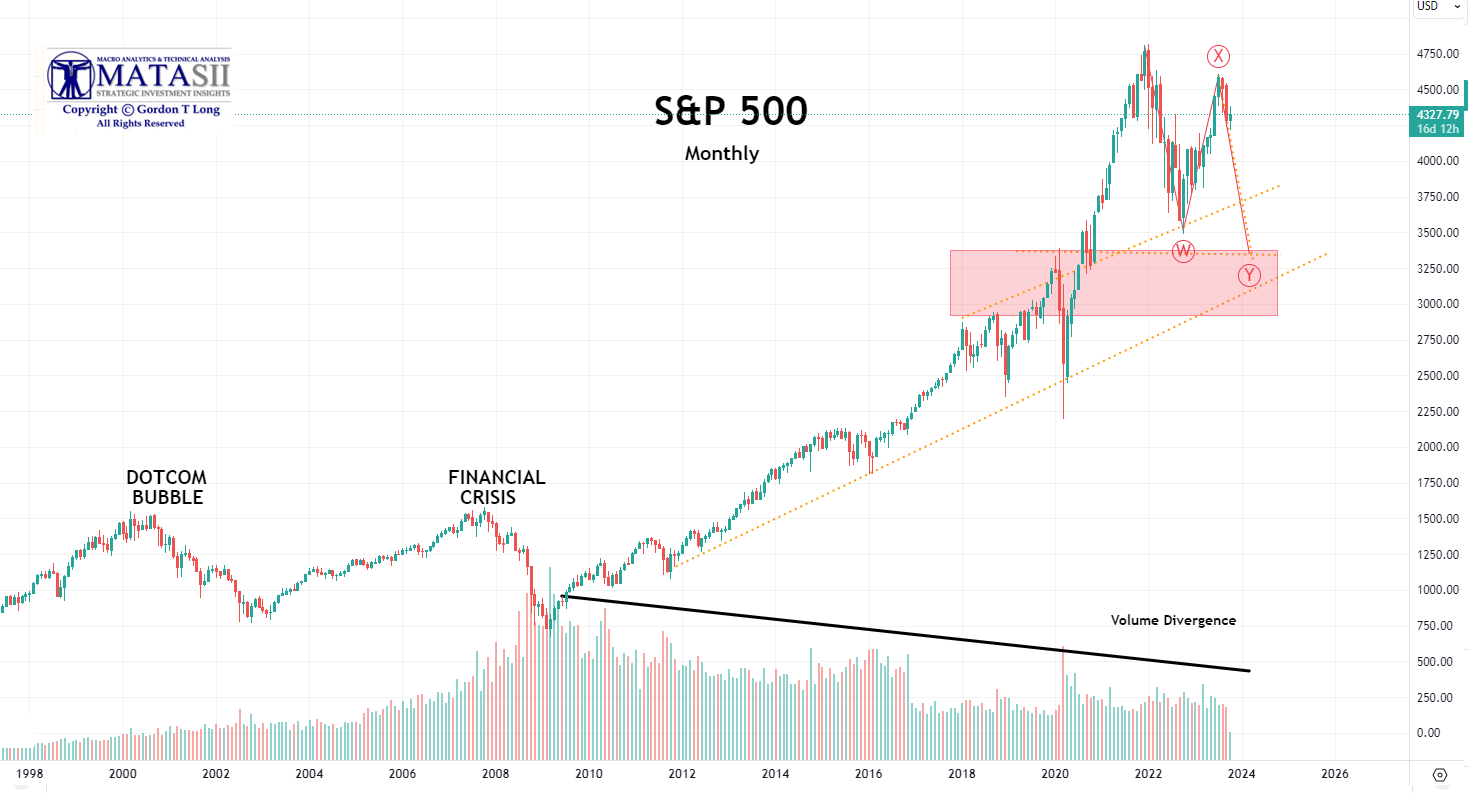
S&P 500 – Intermediate Term View
The market consolidation will likely result in our long held target of 3270 on the S&P 500 by the end of 2024.
YOUR DESK TOP / TABLET / PHONE ANNOTATED CHART
Macro Analytics Chart Above: SUBSCRIBER LINK
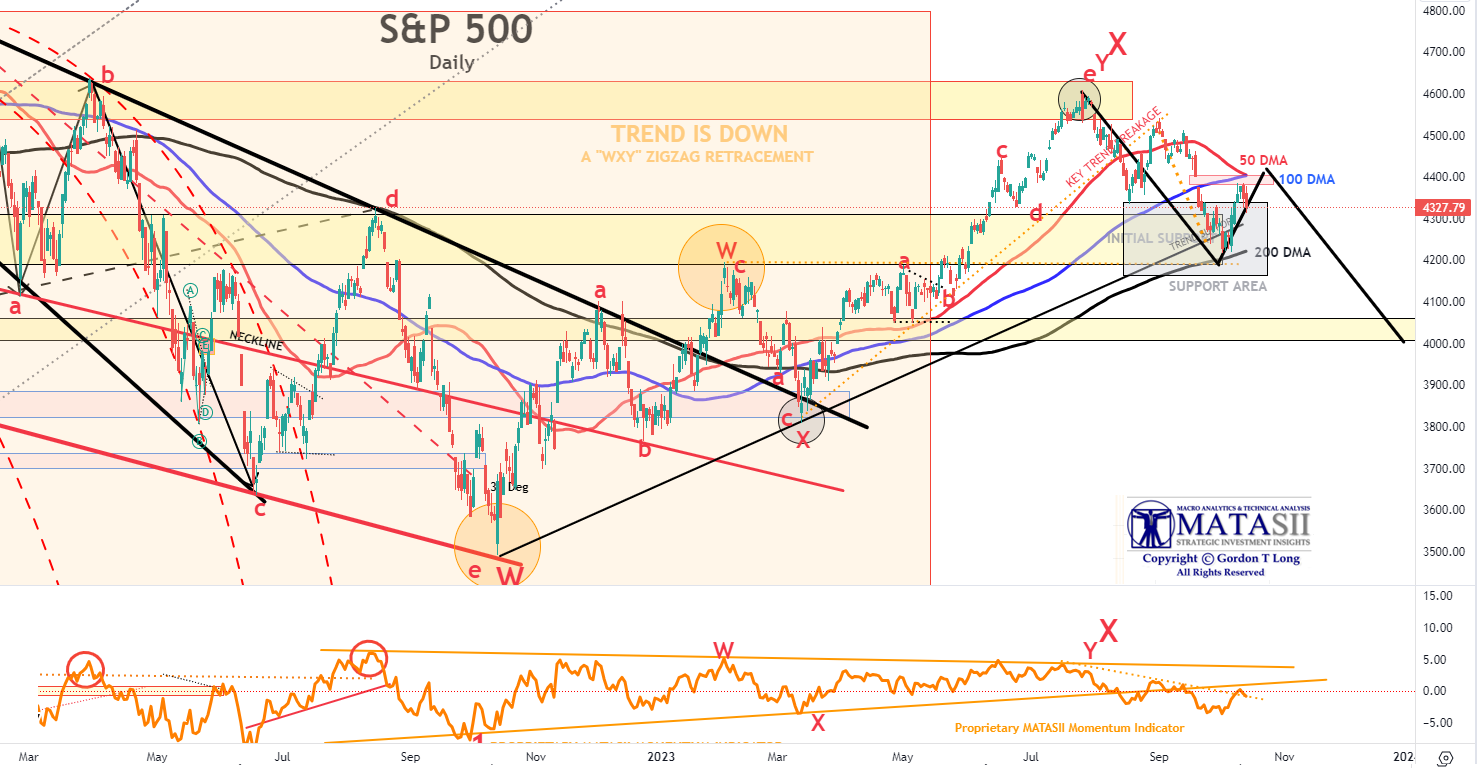
S&P 500 – Short Term View
We are about to potentially complete the downward cross of the 50 DMA through the 100 DMA. This is often a downward triggering event. We suspect the S&P 500 will further consolidate here, (we remind you of the first chart above concerning Q4 seasonal bias), between the rising 200 DMA and the falling 50 DMA before heading lower. Often the second leg down (black line) equals the first leg down in both price and rate of decline.
NOTE: We need to caution that a breach of the 4,200 level in the S&P 500 is likely to require a i) a dollar down, ii) yields up, iii) oil >$100/bbl, as well as iv) clear signs by small business that the credit crunch is causing higher unemployment to occur! This will determine the timeframe for the “trading range” and the slope of the connecting black line below of the two down legs.
YOUR DESK TOP / TABLET / PHONE ANNOTATED CHART
Macro Analytics Chart Above: SUBSCRIBER LINK
FAIR USE NOTICE This site contains copyrighted material the use of which has not always been specifically authorized by the copyright owner. We are making such material available in our efforts to advance understanding of environmental, political, human rights, economic, democracy, scientific, and social justice issues, etc. We believe this constitutes a ‘fair use’ of any such copyrighted material as provided for in section 107 of the US Copyright Law. In accordance with Title 17 U.S.C. Section 107, the material on this site is distributed without profit to those who have expressed a prior interest in receiving the included information for research and educational purposes. If you wish to use copyrighted material from this site for purposes of your own that go beyond ‘fair use’, you must obtain permission from the copyright owner.
NOTICE Information on these pages contains forward-looking statements that involve risks and uncertainties. Markets and instruments profiled on this page are for informational purposes only and should not in any way come across as a recommendation to buy or sell in these assets. You should do your own thorough research before making any investment decisions. MATASII.com does not in any way guarantee that this information is free from mistakes, errors, or material misstatements. It also does not guarantee that this information is of a timely nature. Investing in Open Markets involves a great deal of risk, including the loss of all or a portion of your investment, as well as emotional distress. All risks, losses and costs associated with investing, including total loss of principal, are your responsibility.