Gordon T Long
Global Macro Research | Macro-Technical Analysis
TIPPING POINTS
GUTTED WORKING MIDDLE CLASS
GOVERNMENT AS A USEFUL PARASITE or A KILLER VAMPIRE?
A vampire parasitically drains his victim to sustain itself. Similarly the American people are being robbed of their savings and their incomes so that a bloated bureaucracy can continue expanding. If this is allowed to continue, it will quickly siphon off all the life-blood from Americans’ livelihoods.
How big is this siphoning? In July, the average American worker earned $33.74 an hour and paid $3.37 per hour in federal income taxes. But the drainage through inflation has reduced the purchasing power of a worker’s pay by $4.62 an hour since President Biden assumed power.
Every time Bidenomics spends, borrows, or creates excess money, the Fed creates a dollar for the government. This slightly devalues all other existing dollars, effectively shifting that lost value into the newly created money. This is why inflation is a hidden tax: It transfers wealth from the people to the government.
This results in a reduction in what a worker can buy with their wages. It represents a real tax on the consumer, and drainage of purchasing power is effectively a confiscation from the worker on an hourly basis while working. In other words, the hidden tax of inflation has more than doubled the effective income tax rate of the average American worker to pay for Bidenomics.
The financing costs of the federal debt are exploding, which only further increases government spending, making the situation deteriorate even faster. It’s just like a household budget where the response to a maxed-out credit card is to open another one and max that out too. The interest charges on each one only exacerbate the family’s financial difficulties. The dynamic of this vicious downward spiral is playing a key role in the current reacceleration of inflation, which began again in July and will certainly continue in Q4.
Congress and the White House spent over $6 trillion last fiscal year and are projected to do the same by the end of the current fiscal year too. This level of spending has caused the Treasury to borrow over $1 trillion a year which must be financed at the highest rates in decades.
Is this the strategy you use to run your household?? How would you think that would work out for you and your family?
WHAT YOU NEED TO KNOW!
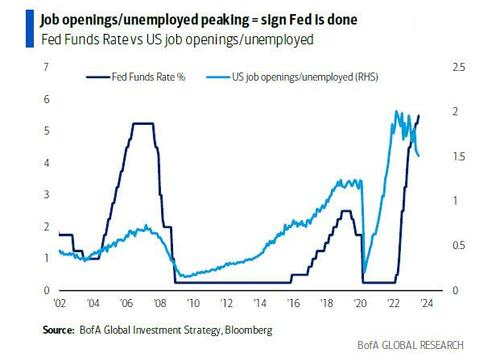 An insightful metric put out by BofAML is the ratio of Job Openings to those workers Unemployed. When overlaid as shown to the right, with the Fed Funds Rate we can see more clearly when “enough may be enough” from the Fed!
The question now is how long can the Fed hold rates at this level before spiking unemployment sends politicians into a reactionary tizzy?
It will be a real test for Fed Chairman Powell to fight both the rising heat of congress and the looming cold of winter blowing in with rising inflationary energy prices?
LABOR STRIFE: Sustained Inflation Has Given The Long Dormant Union Monster New Teeth!
-
- The Inflation spike over the last three years has now galvinized US Workers and Unions.
- The recent UPS Settlement was a Rallying Call for all Unions – especially when their workers saw UPS drivers getting $175K/Annum!
- Major Unions such as UAW, The Teamsters, Public Sevice Employees, Teachers Union are all demanding contract negotiations.
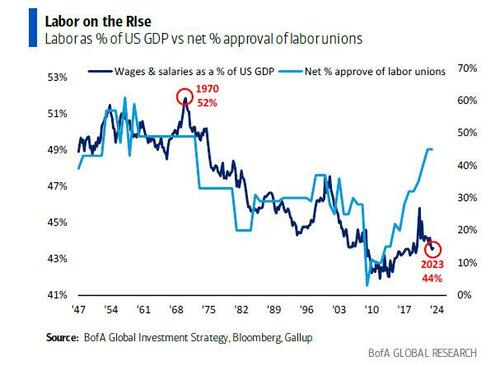
- The policies of fiscal excess, redistribution and protectionism are finally aiding recovery in the labor share of GDP from secular low in the 2010s. We have discussed the magnitude of this problem many times at MATASII,com, most recently in the Macro Analytics presentation with Charles Hugh Smith entitled “The Plundering of Productive Assets“.
GLOBAL ECONOMIC REPORTING: What This Week’s Key Global Economic Reports Tell Us?
-
- Germany and the EU are extremely weak and exposed to any sudden financial shock.
- China continues to weaken. The fact that President Xi JinPing is not attending the G20 meeting for the first time is telling! Home front problems command his full attention.
CONCLUSION
1– CHINA BANS APPLE USE FOR GOVERNMENT USE OR ON GOVERNMENT FACILITIES – Loses $200B IN 2 Days
2– OIL FROM $78 TO CURRENTLY +$90/bl TO SOON $107? (chart right)
3– GOLD CONFISCATION A GROWING POSSIBILITY
LABOR STRIFE: Sustained Inflation Has Given The Long Dormant Union Monster New Teeth!
 INFLATION SPIKE GALVINIZED AMERICAN WORKERS
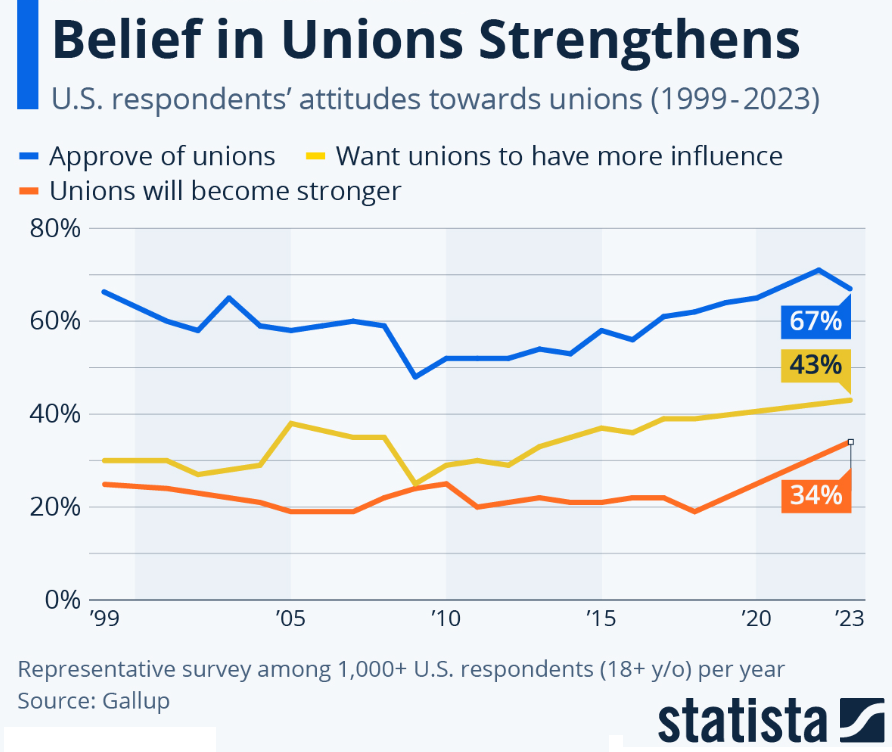
More Americans support unions today than in the entire 19070s, 80s, 90s and 2000s. In 2023, 67 percent of U.S. respondents said they approved of unions, up from only 54 percent ten years ago and comparable to levels in the 1960s. Last year support had reached 71 percent, still short of a high of 75 percent in the Gallup survey in 1953 and 1957.
Belief that unions will become stronger in the future grew even more – to 34 percent of respondents this August, up from just 19 percent in 2018 when the detailed part of the survey was last carried out. 43 percent of people said they wanted unions to have more influence, also significantly up from 39 percent in 2018 and a low of 25 percent in 2009.
The desire for more union power was divided along party lines – 61 percent of Democrats and 21 percent of Republicans are for it – and has not changed much in the past five years, as it was mainly Independents that pivoted to championing stronger unions. When it comes to people’s outlook on unions, however, Republicans have started to agree that unions are strengthening. 14 percent of Republicans thought so in 2018, compared with 20 percent in 2023.
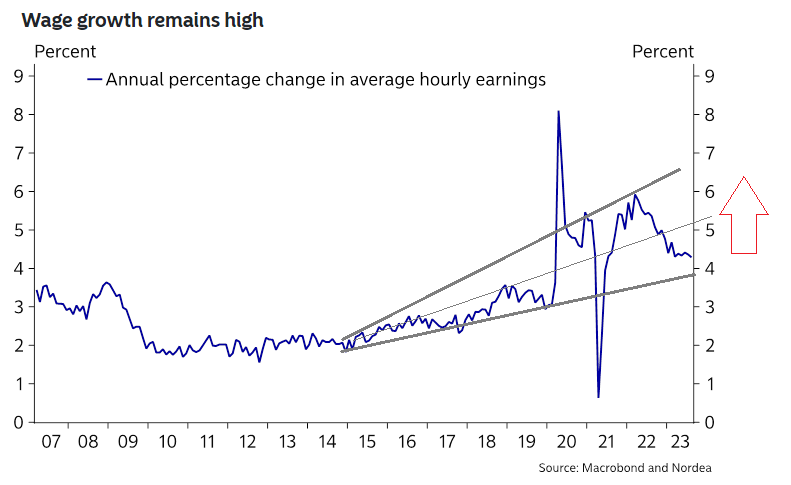
Analysts now believe reflation is bound to be far stickier than the Fed expects, and it has to do with wages, and specifically the growing influence of labor unions.
UPS SETTLEMENT WAS A RALLYING CALL FOR ALL UNIONS!
 After the teamsters recently reached an agreement with UPS, which among other things included massive pay raises for both part-time and full-time workers, we are seeing strikes galore and labor unions aggressively negotiating for double-digit wage increases. The culmination of this is that a net 44% of Americans now support labor unions. This is the highest since ‘72.
The International Brotherhood of Teamsters (IBT) and UPS reached a five-year contract agreement on July 25.
The agreement includes wage increases of at least $7.50 per hour for current employees over the life of the contract.
The top rate of pay for a full-time UPS worker would become $49 per hour.
The agreement also includes:
-
-
- Creating thousands of new full-time jobs
- Securing important workplace protections, including air conditioning
- New part-time hires starting at $21 per hour and advancing to $23 per hour
- Ending mandatory overtime
-
 The contract goes into effect immediately and covers a five-year period through July 31, 2028. The IBT UPS members approved the contract with more than 86 percent support.
Inflation is tied directly to wages and labor costs. All businesses large and small will be affected, as usual, small businesses will get hit hardest. This translates into consumers having to pay more and workers demanding higher pay. We know that government workers will never lower their pay and unlike the private sector, it is not held back by an employer’s ability to pay. Add government workers to those screaming for more money. In short, get ready for higher everything.
Certainly, UPS customers are likely to face higher shipping rates, according to analysts.
“A new Teamsters deal could drive the cost per piece [about] 2 percent higher than current expectations,” Bascome Majors, an analyst at Susquehanna International Group, told clients in a note earlier in July, according to Reuters.
A potential supply chain catastrophe has been narrowly avoided with mere days to spare. However, expect to pay more to ship items in the not-to-distant future.
RESULT: A $26.7B MARKET CAPITIALIZATION LOSS
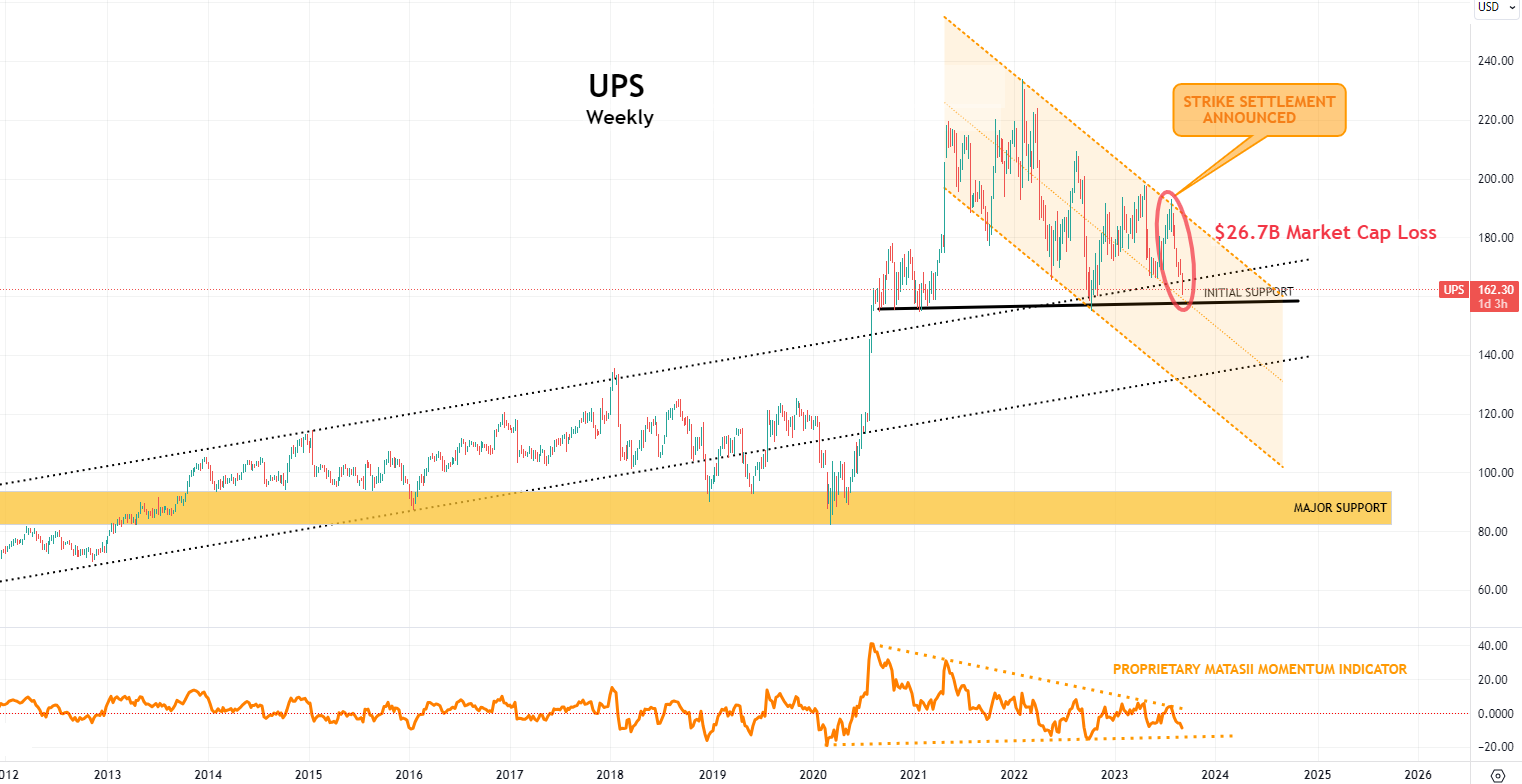
IT HAS ONLY JUST STARTED
ENERGY WORKERS
-
- “They Lose A Few $Billion”: Chevron Workers Plan Multi-Week Strike At Major Australian LNG Plants “The Offshore Alliance is escalating protected industrial action to demonstrate that our bargaining negotiations are far from ‘intractable.'”
- Chevron Launches Mediation Talks With Aussie LNG Workers To Avert Strike “Ballot results show that they (Chevron) are out of touch with OA members and haven’t listened to a word spoken in their discussions with members, Reps and the Offshore Alliance.”
RAIL WORKERS
Having watched UPS drivers score the contract of the century, airline pilots start to secure better contracts, and in the midst of watching the UAW consistently apply pressure to Detroit and the Biden administration, northeastern railroad unions are trying to follow suit.
Wages remain the key issue for railworkers. The Brotherhood of Locomotive Engineers and Trainmen said it and NJ Transit are said to be $6 to $7 an hour apart on wages. They make up just one of 15 rail unions that NJ Transit will find itself having to negotiate with. NJ Transit and SEPTA are both said to seek $50 an hour for engineers.
AUTO INDUSTRY
-
- UAW President Has “Only One True Enemy, Multibillion Dollar Corporations “This all plays into Trump’s hands. I expect a long, nasty strike. If the big three give into the preposterous demands of auto negotiator Fain, they are all headed for bankruptcy, GM for a second time.”
Ford Fast Tracks Pay-Raise For 8,000 UAW Employees Amid Union Battle Over New Labor Contract
Ford Motor Co. announced Thursday morning that nearly 8,000 United Auto Workers-represented employees “have been fast-tracked to higher earnings,” and some will earn $9,000 more per year. This comes as the automaker and the union have been discussing a new four-year labor agreement, as the current one expires next Thursday. UAW members have already voted in favor of a strike if no labor agreement is reached.
-
- Employees will earn $4.33 more per hour, or $9,000 a year; some could earn more than $10,000 a year with overtime.
-
- “The pay hikes were negotiated by Ford and the UAW in 2019 to shorten the time it takes workers to reach the average top wage rate of $32 an hour,” the automaker said.
-
- “Pay raises” is an example of Ford’s commitment to improving the finances of its workforce. “The negotiating teams nicknamed this deal ’23 Jump Street’ , because in 2023 a significant number of UAW-Ford team members would see a jump in pay. And we are offering further improvements in the next contract.”
-
- Ford said the wage rate hikes usually take eight years to play out, but this new agreement with 8,000 unionized employees means they have reached the top wage rate in four years.
-
- The automaker has 57,000 UAW-represented hourly employees, with an average of 80% of all UAW employees at the top wage rate or making around $32 per hour.
-
- UAW has been in heated discussions with Ford, General Motors Co, and Stellantis NV over new labor contracts that expire next Thursday. The union has demanded 40% pay hikes for its workers across all three automakers.
-
- Last week, Ford offered a 9% wage rise until 2027, significantly lower than the 40% increase the union demands. UAW members have voted to strike if no new labor contract can be negotiated across Detroit’s Big Three automakers.
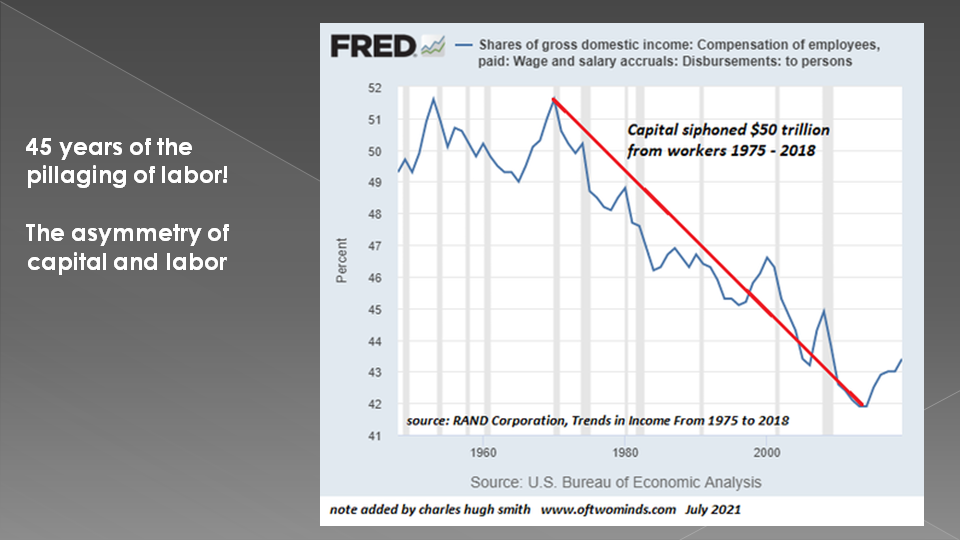 The policies of fiscal excess, redistribution and protectionism are finally aiding recovery in the labor share of GDP from secular low in the 2010s.
We have discussed the magnitude of this problem many times at MATASII,com. Most recently in the Macro Analytics presentation with Charles Hugh Smith entitled “The Plundering of Productive Assets“.
GLOBAL ECONOMIC REPORTING: What This Week’s Key Global Economic Reports Tell Us
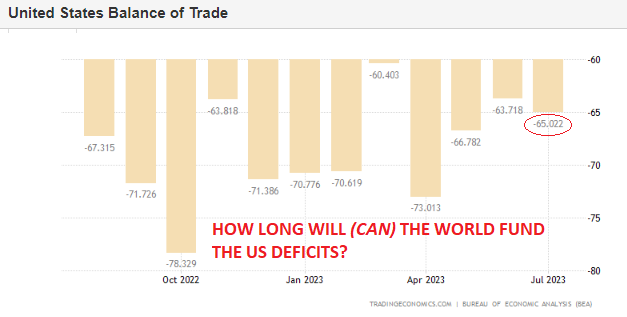 US TRADE DEFICIT
The US trade deficit widened less than expected to $65 billion in July 2023 from a downwardly revised $63.7 billion in June, compared to market forecasts of a $68 billion gap.
Exports were up 1.6% to a four-month high of $251.7 billion, led by passenger cars, trucks, buses and special purpose vehicles, nonmonetary gold, crude oil, pharmaceutical preparations, travel and transport while shipments fell for gem diamonds. Meanwhile, imports increased 1.7% to $316.7 billion, boosted by cell phones and other household goods, pharmaceutical preparations, semiconductors, computers, crude oil and travel.
On the other hand, purchases declined for finished metal shapes, iron and steel mill products, nonmonetary gold and transport. The deficit with China increased $1.2 billion to $24.0 billion; the surplus with Hong Kong decreased $1.0 billion to $1.5 billion, and the balance with the UK shifted to a surplus of $0.5 billion from a deficit of $0.8 billion in June.
US EMPLOYMENT TRENDS:
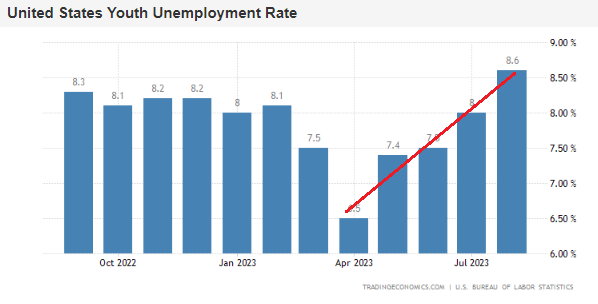 The Conference Board’s Employment Trends report saw the headline slip to 113.02 in August from the revised down 114.71 seen in July. The CB noted that the ETI has been on a declining trend since March 2022, and the index remains elevated, and accordingly, “job gains may continue over the coming months, but the rate of growth may lessen and eventually will switch to job losses,” it said. “The ETI suggests that weakness in the job market will eventually broaden to the rest of the labor market,” it added.
The chart to the right of rising youth Unemployment in the US is supportive of the Conference Boards warning.
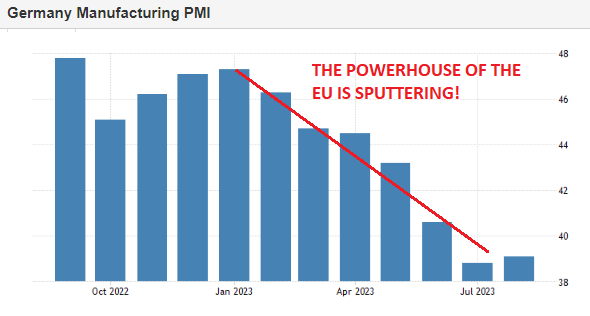 THE HCOB GERMANY MANUFACTURING PMI: was confirmed at 39.1 in August 2023, the second-lowest reading since May 2020 and still firmly inside sub-50 contraction territory. Output declined at the fastest pace since the initial COVID shutdowns in spring 2020 and new orders dropped the most for over three years, amid customer uncertainty, weakness in the construction sector and a general lack of appetite for investment.
Additionally, new export orders were down markedly on reduced sales to China and across Europe. Factory employment fell modestly as firms were reluctant to make large-scale reductions in staffing capacity. On the price front, both input costs and factory gate prices decreased. Finally, manufacturers remained downbeat about production prospects over the forthcoming year.
German Industrial Output MM (Jul 2023) -0.8% vs. Exp. -0.5% (Prev. -1.5%)
German Composite Final PMI (Aug) 44.6 vs. Exp. 44.7 (Prev. 44.7)
German Industrial Orders MM (Jul) -11.7% vs. Exp. -4.0% (Prev. 7.0%, Rev. 7.6%)
German Trade Balance (EUR)(Jul) 15.9B vs. Exp. 18.0B (Prev. 18.7B)
 EU ECONOMIC CONDITIONS
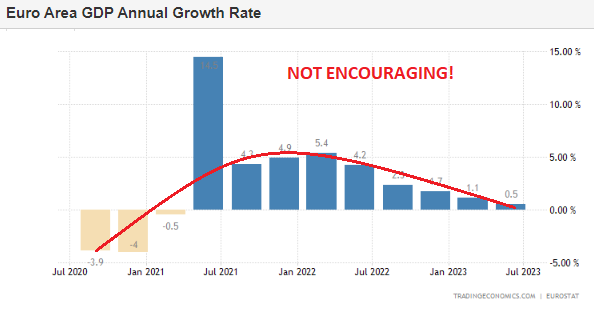
The Euro Area economy expanded 0.5% year-on-year in the second quarter of 2023, slightly below 0.6% seen in the previous estimates, and the lowest growth rate since the contractions in 2020 and Q1 2021. It compares with 1.1% rate in the first three months of the year. Germany, which is the bloc’s largest economy, fell 0.1%.
EU GDP Revised QQ (Q2 2023) 0.1% vs. Exp. 0.3% (Prev. 0.3%); YY (Q2 2023) 0.5% vs. Exp. 0.6% (Prev. 0.6%)
GLOBAL MACRO
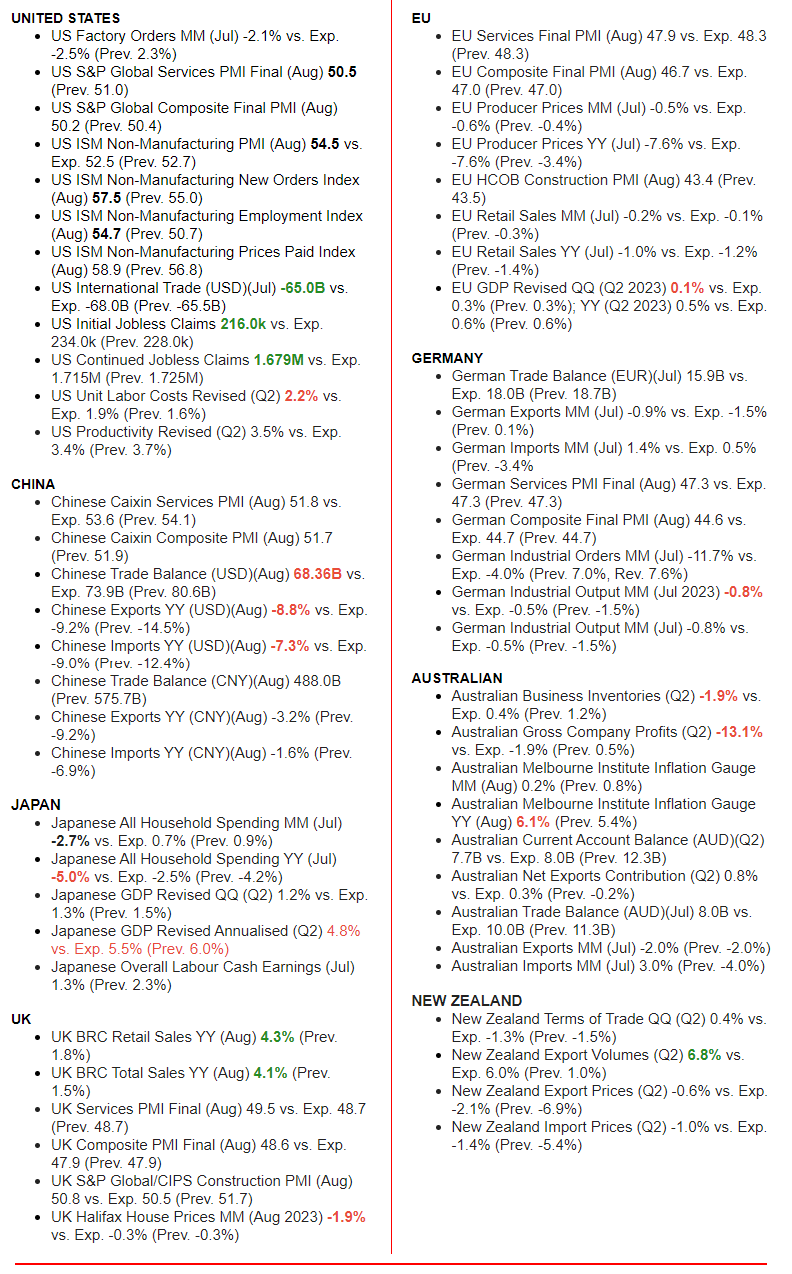
WHAT DOES YOUR SCAN OF THE DATA BELOW TELL YOU? – THE MEDIA AVOIDS BAD NEWS!
We present the data in a way you can quickly see what is happening.
THIS WEEK WE SAW
Exp=Expectations, Rev=Revision, Prev=Previous
CONCLUSION
 1– OIL FROM $78 TO CURRENTLY +$90/bl TO SOON $107? (charts right)
-
- Oil To Posssibly Hit $107 As Deficit Approaches 3 Million Barrels Per Day “The return to deficits, in turn, largely explains the summer rally in timespreads and oil prices.”
-
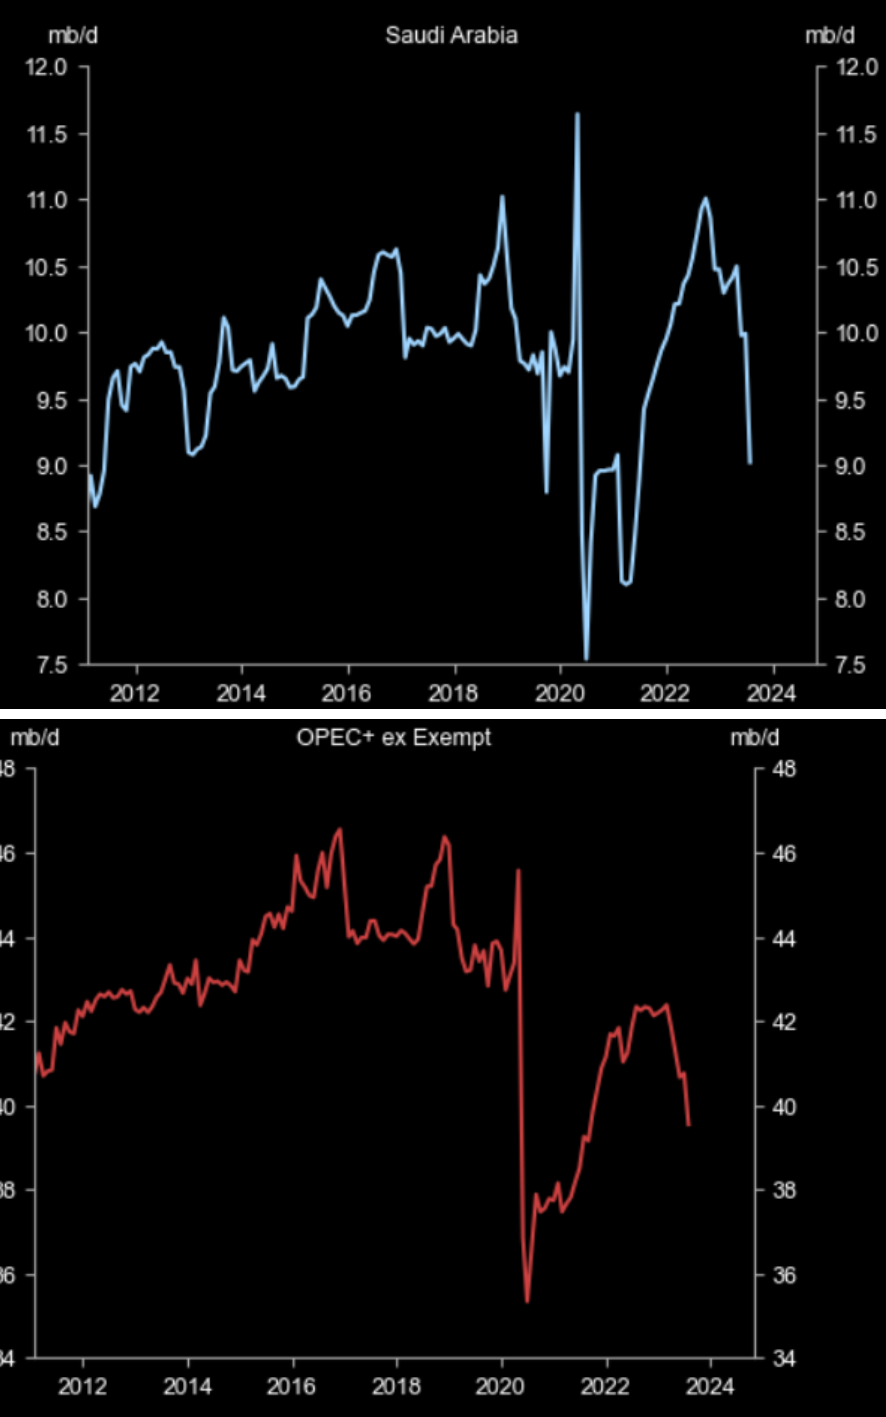
- Crude gained on news that Saudi Arabia and Russia are to extend voluntary production cuts through to year-end and with Saudi to review it monthly to consider either deepening the cut or increasing production.
- Saudi Arabia will extend the voluntary cut of 1mln BPD for 3 months (exp. 1 month) until the end of December and will review it monthly to consider deepening the cut or increasing production, according to SPA.
- Russian Deputy PM Novak said Russia will extend the reduction of oil exports until the end of the year with the additional voluntary reduction in oil supplies to world markets by 300k BPD extended until the end of December which will be reviewed monthly.
2– GOLD CONFISCATION A GROWING POSSIBILITY
-
- Don’t Dismiss The Possibility Of Gold Confiscation So how would this unfold?
-
- APPROACH: If the US and the EU could come up with a large volume of gold quickly, they could issue a gold-backed currency themselves. It’s a simple equation: The more gold they have = the more backed notes they can produce = the more power they continue to hold. By seizing upon the private supply of their citizens, they would increase their holdings substantially in short order.
-
- PROTECTION: The government can’t easily confiscate what’s outside its own borders, which is why it’s working night and day to make it as difficult as possible for you to protect your assets abroad. This sad reality means that you need to take action before it’s too late. Your first step? Learn how to start internationally diversifying your wealth – and your life. From investing in international markets and opening offshore bank accounts to setting up an offshore LLC or annuity.
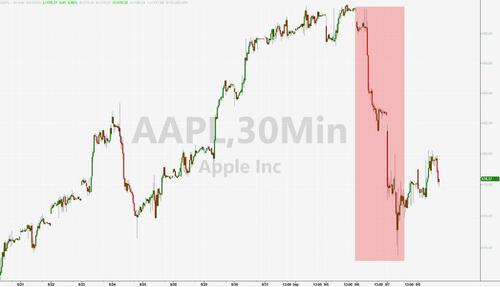
 3– CHINA BANS APPLE USE FOR GOVERNMENT USE OR ON GOVERNMENT FACILITIES – Loses $200B IN 2 Days
According to the Wall Street Journal, China has banned the use of iPhones and other foreign-branded devices for work by government officials.
The ban also applies to bringing these devices into the office. Managers have been notifying staff of the ban through meetings or chat groups.
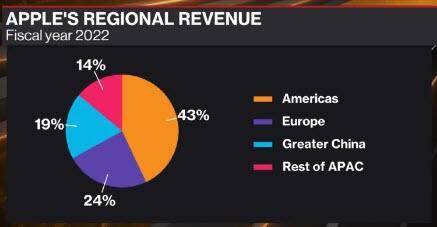
It’s unclear how widely the bans have been issued. The ban may also apply to other government-controlled organizations, including state-owned enterprises. China is Apple’s third-largest market, accounting for 18% of total revenue last year. After the reports of the ban, Apple’s stock fell by $200 billion in two days.
-
- China seeks to broaden the Apple (AAPL) iPhone ban to state firms and agencies, according to Bloomberg.
- China has ordered officials at central government agencies not to bring iPhones into the office or use them for work, The Wall Street Journal reported on Wednesday. It was unclear how widely the bans were issued.
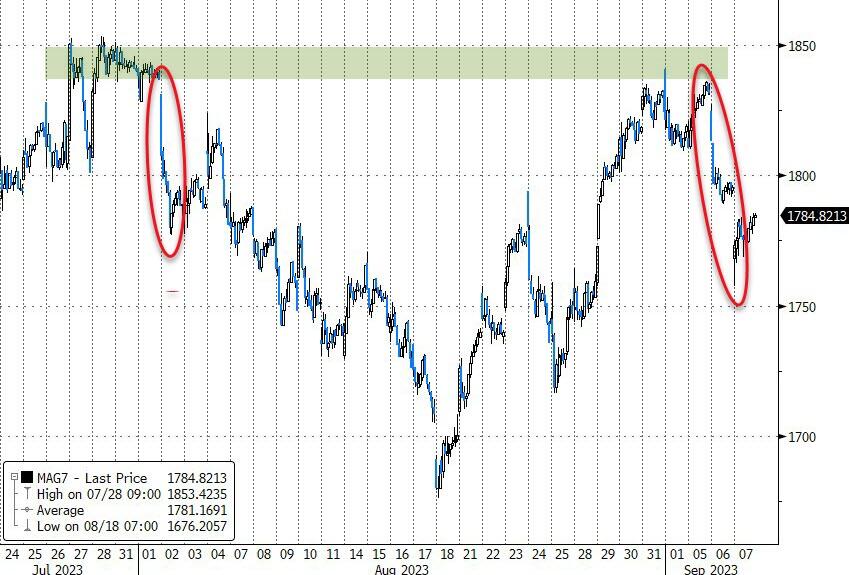
Apple’s worst 2-day drop in a year (AAPL market cap is down around $200BN) dragged it below its 100DMA…
OIL BACK ON THE RISE!
BRICS-11 GO ON THE OFFENSE IN NEW POST PETRODOLLAR ERA
Click All Charts to Enlarge
1 – SITUATIONAL ANALYSIS
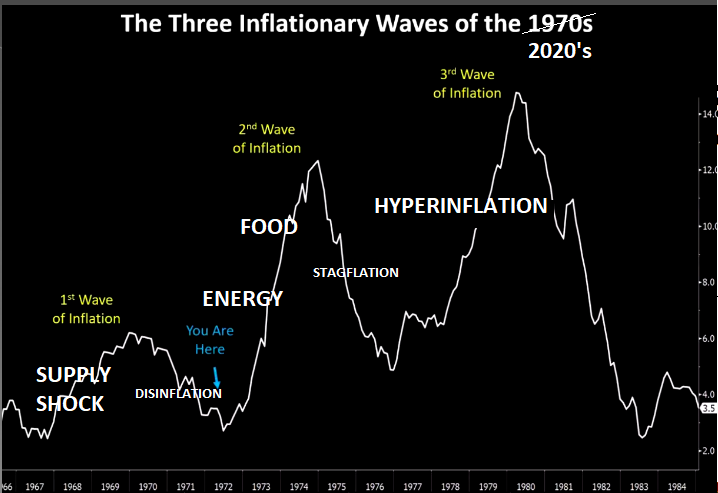 An upward movement in crude oil prices will potentially re-ignite Inflation pressures, since it has been primarily falling energy prices that have been the source of falling inflation pressures as measured by the CPI. It is our view that the inflation monster is a long way from being caged!
We fully expect to see a second Inflation wave driven by Energy and Food to soon emerge, as we have long advocated and as schematically represented to the right.
We recently published two weekly “Latest Charts” newsletter, one highlighting Energy and the other Gold. In this newsletter we want to update both and show the relationship we believe Gold and “Black Gold” is now operating together within.
-
- 09/0323: GOLD – “IS GOLD ON THE LAUNCH PAD?” PUBLIC
- 08/06/223: ENERGY – DON’T TAKE YOUR EYE OFF ENERGY! PUBLIC
MAJOR DEVELOPMENT
SAUDIA ARABIA & RUSSIA EXTEND CRUDE PRODUCTION CUTS
Saudi Arabia and Russia announced last week they have extended their voluntary oil production cuts through the end of this year. The cuts are intended to support upward oil pricing pressures. The cuts are 1.3 million barrels per day of crude out of the global market. This consists of Saudi Arabia cutting one million barrels a day of output, and Russia is cutting 300,000 barrels a day of exports.
The cuts are the biggest in years for Saudi Arabia. The Saudi cut has been in place since July and has depressed the kingdom’s output to nine million barrels per day.
The cuts are intended to prop up prices. The two largest oil producers are trying to boost income from oil, even as demand has weakened with the economy.
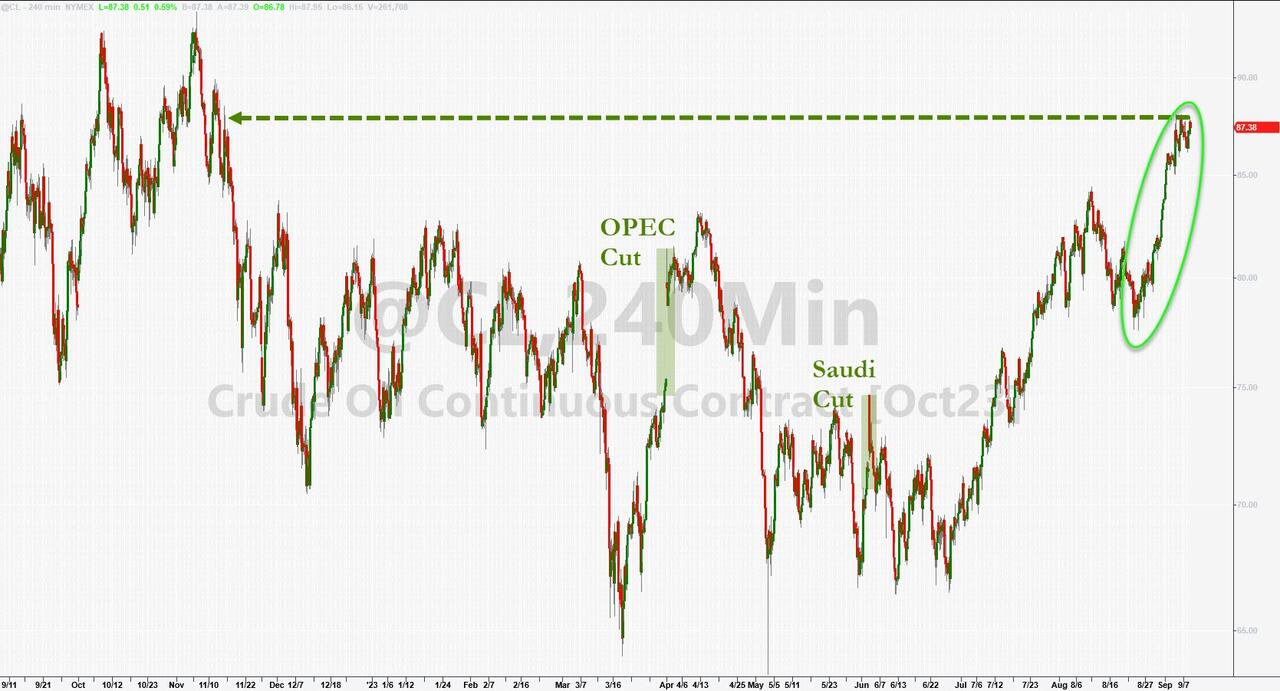
The cuts have boosted energy prices. Futures for Brent crude, the international benchmark, breached $90 a barrel for the first time this year. West Texas Intermediate crude, the U.S. benchmark, reached $87.75.
US STRATEGIC PETROLEUM RESERVES (SPR)
Meanwhile as we have reported extensively, US inflation has been primarily falling because of falling Energy costs. Those costs in the US have fundamentally reflected the falling prices of gasoline at the pump. This has been because the Biden Administration has sold off the SPR to bring down prices. The SPR is now empty!
Biden’s “plan” to drain the SPR in hopes of keeping gas prices low and winning re-election is potentially about to backfire spectacularly with Saudi Arabia and Russia cutting production.
This all very dangerously flies in the face of crude inventories now being at historic low levels! Clearly OPEC+ knew exactly when to take the actions they have when the US is at its most vulnerable.

2 – FUNDAMENTAL ANALYSIS
The visualization below (in the top pane) tracks the year-on-year change in the price of Brent crude (in blue) against the year-on-year change in total US oil inventories (in green, on an inverted axis).
As the chart illustrates, historically, these variables are negatively correlated and the lines move in unison: when inventories go down, prices go up, and vice versa. (The post-pandemic demand snap-back is notable in late 2020: inventories plunged and prices rebounded.)
However, the 2022 SPR episode is clearly visible as a gap opened up between the two lines. The second “inventory breakdown” pane shows why this occurred: the SPR (in purple) kept releasing oil while commercial oil companies rebuilt inventory.
While that “commercial” segment has been rebuilding reserves lately, the SPR has not. It remains at its lowest level since 1983, with the Department of Energy waiting for a cheaper refill price.

 NOTE: WORTH A READ (IGNORE THE AUTHOR’S ANGRY RANT) TO SEE WHERE WE CURRENTLY STAND
“No Plan B, No Excess Capacity Anywhere”: Oil Industry Warns Of Looming Refining Crisis
3 – TECHNICAL ANALYSIS
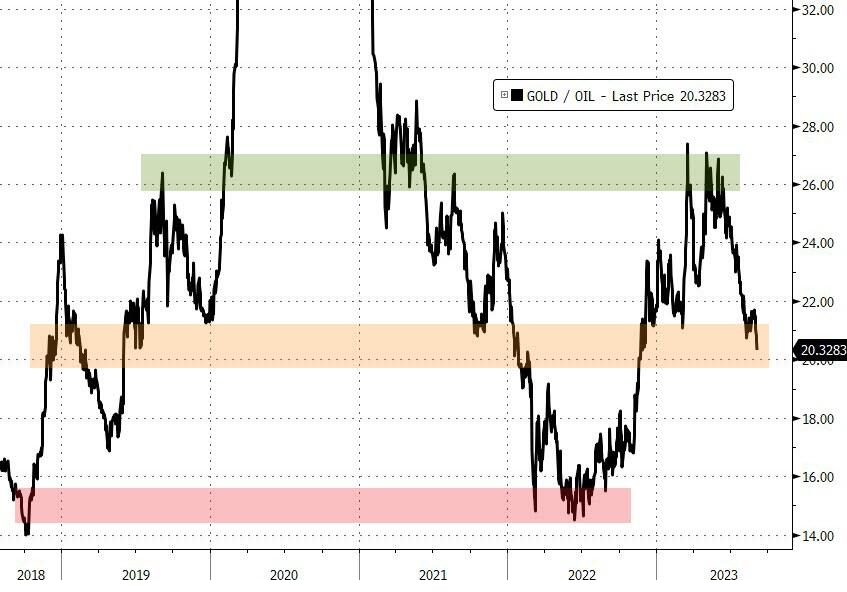 THE OIL:GOLD RATIO FOR GUIDANCE
There are times when the Oil/Gold Ratio can be a valuable input in assessing directional and support calls for one or the other of its components.
SITUATION: The relative outperformance of oil over gold has pushed the number of barrels of Saudi Crude per ounce of gold down to around 20. What the ratio shows this ratio has reached a level of support. This support level can act as a consolidation period for the ratio before moving either strongly upward or downward.
TAKEAWAY: Last week we talked about gold having a leg down in front of it, while we are seeing oil move from below $80/bl to $90/bl on reduced supply by Saudi Arabia and Russia. If gold goes down while oil goes up then the current Oil/Gold Ratio movement to the colored support level will have potentially been a “B” Wave in an upward ABC corrective movement of the ratio.
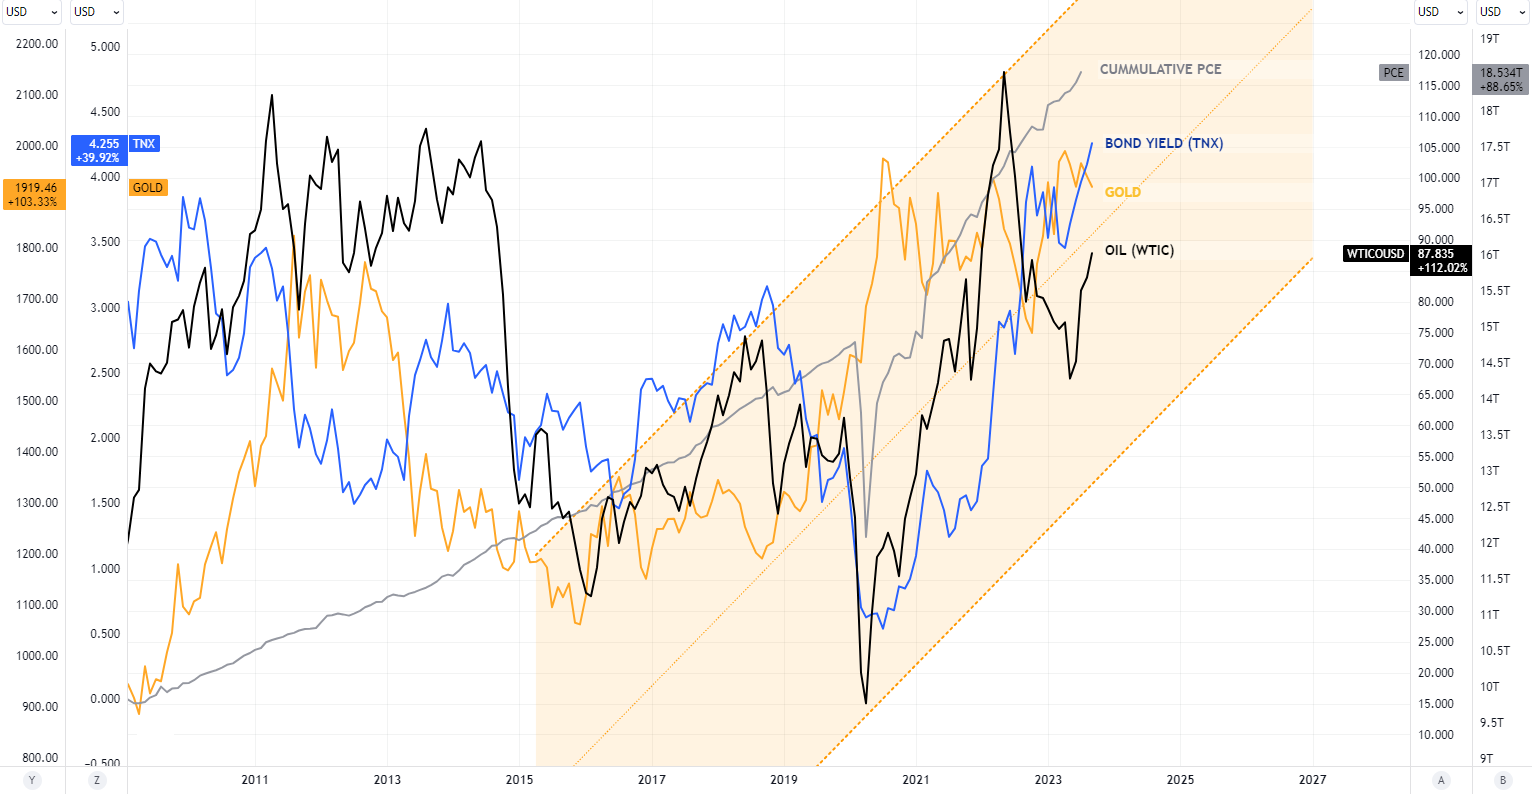
This is supported by the analysis below. What the chart depicts is:
-
- The chart shows Inflation (in grey) on a cumulative basis as represented by the Personal Consumption Expense (PCE).
- We see the correlation with lags against WTIC, Gold and the Yield on the US 10Y Treasury.
- The recent rise in US 10Y Treasury Yields are “catching up” to cumulative inflation.
- Energy as represented by WTIC (in black) should be expected to soon rise further. This fits with Saudi Arabia and Russia taking the actions they have It also aligns with a possible ABC in the Gold/Oil Ratio.
WTIC
Note: The Elliott Wave Count used below is that of MATASII.com for the WTIC CFD’s, but those counts are labeled as within the larger construct developed by the widely followed Technical Indicator Index.
MONTHLY – cfd
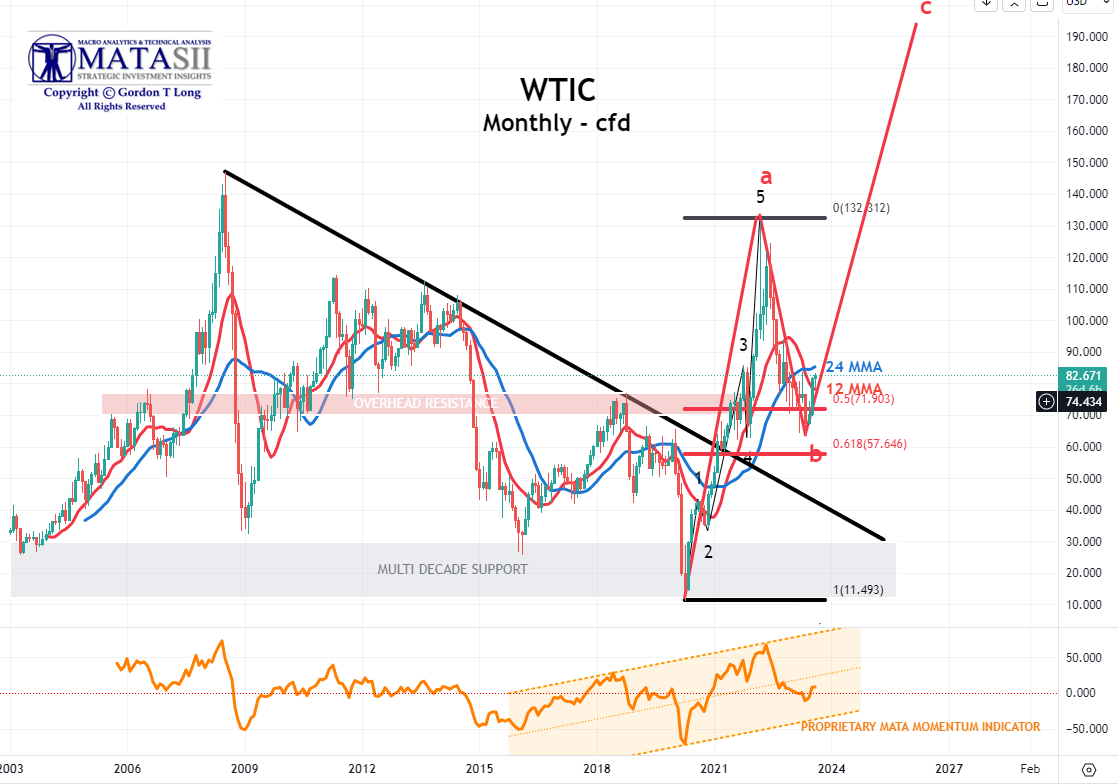 WE PREVIOUSLY WROTE:
There is a possibility that the Saudi cuts may move WTIC to the 24 MMA (shown below) at approximately $85/bl….. or higher if the cuts are sustained or increased.(Chart Right)
CURRENT (Chart Below)
-
- Price moved to the 24 MMA with the Saudi and Russian production rates.
- The MATASII Momentum Indicator has moved towards an upward bias suggesting more upward price action is likely.

YOUR DESK TOP / TABLET / PHONE ANNOTATED CHART
Macro Analytics Chart Above: SUBSCRIBER LINK (Set Chart to “M” for Monthly)
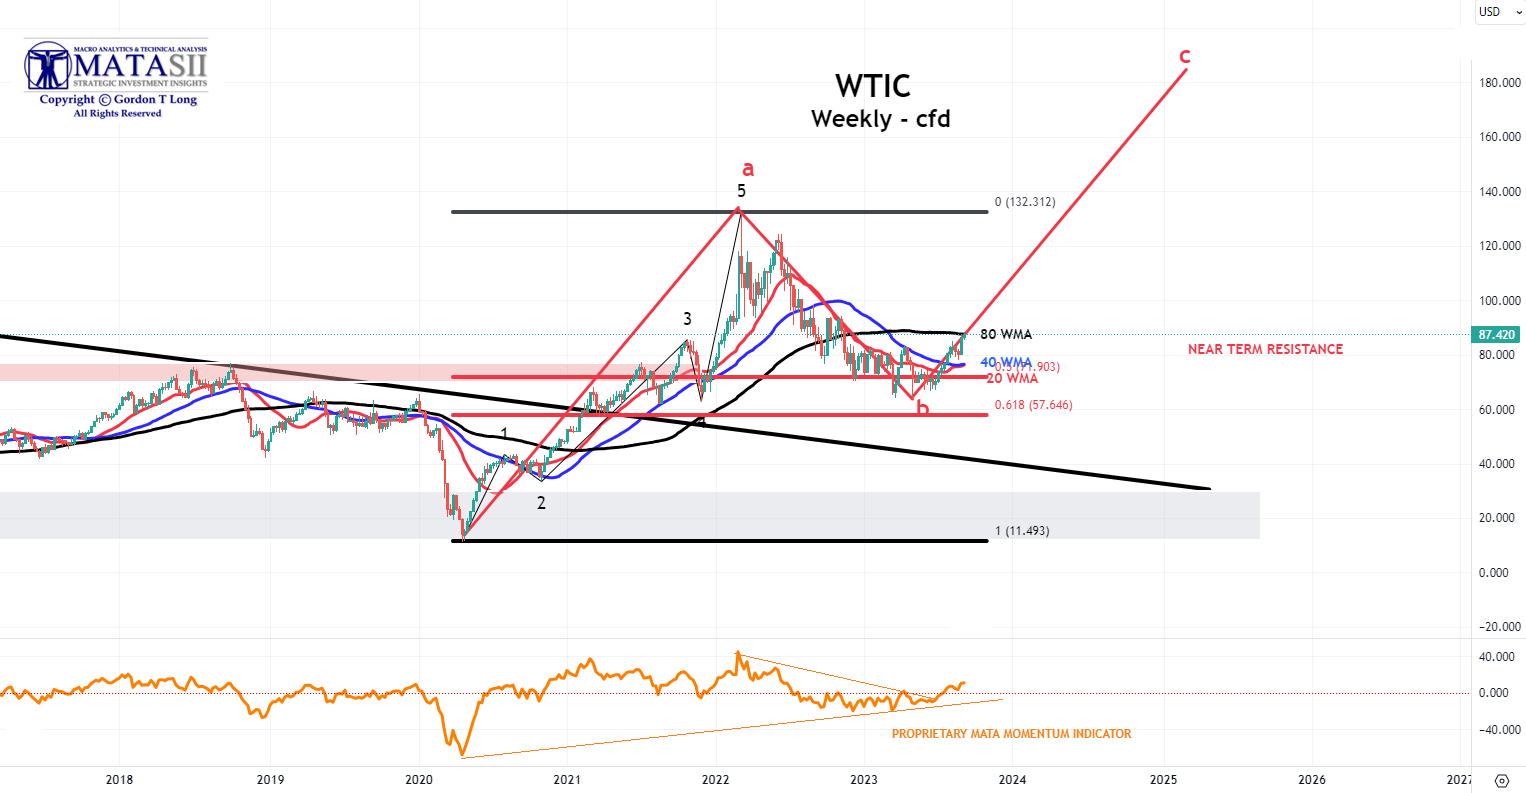
WEEKLY – WTIC cfd
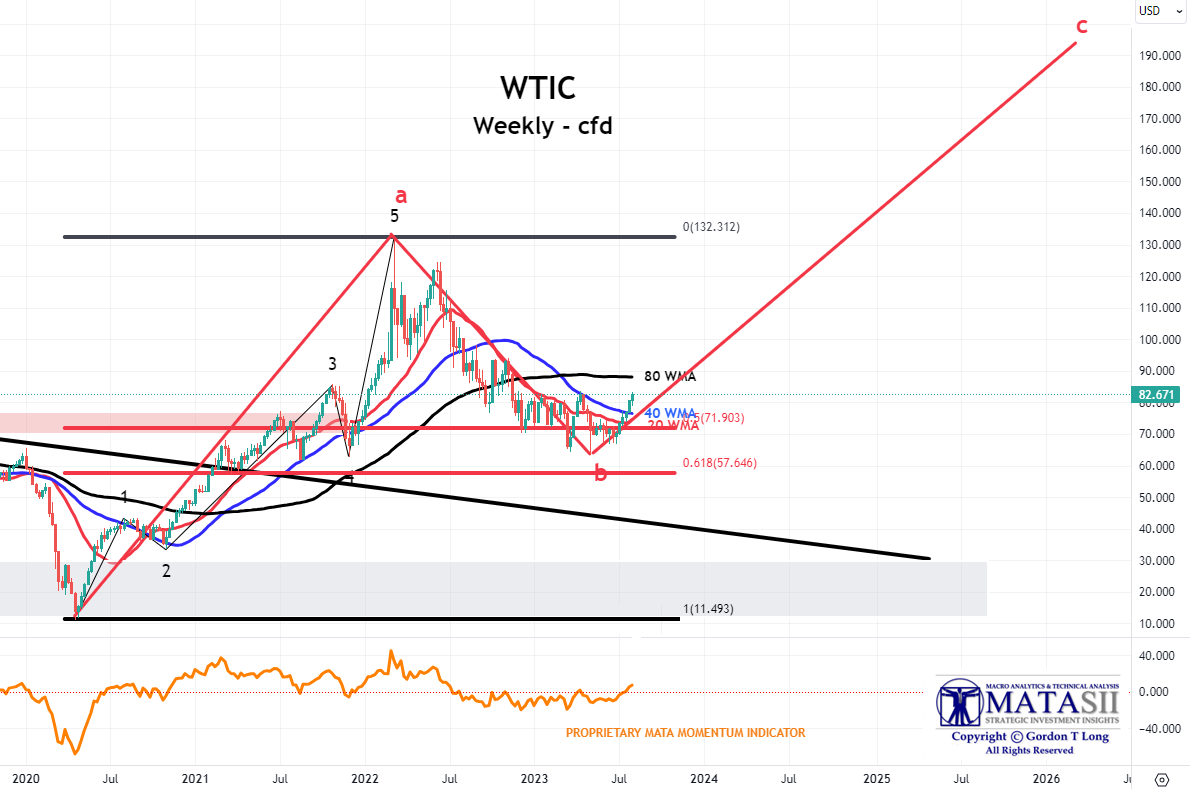 WE PREVIOUSLY WROTE:
The Weekly chart suggests the possibility of a move slightly higher towards the 80 WMA at ~$88/bl before pulling back.(Chart Right)
CURRENT (Chart Below)
-
- Price moved upward to the 80 WMA.
- The MATASII Momentum Indicator has shifted to an upward bias suggesting further upward price action.
YOUR DESK TOP / TABLET / PHONE ANNOTATED CHART
Macro Analytics Chart Above: SUBSCRIBER LINK (Set Chart to “W” for Weekly)
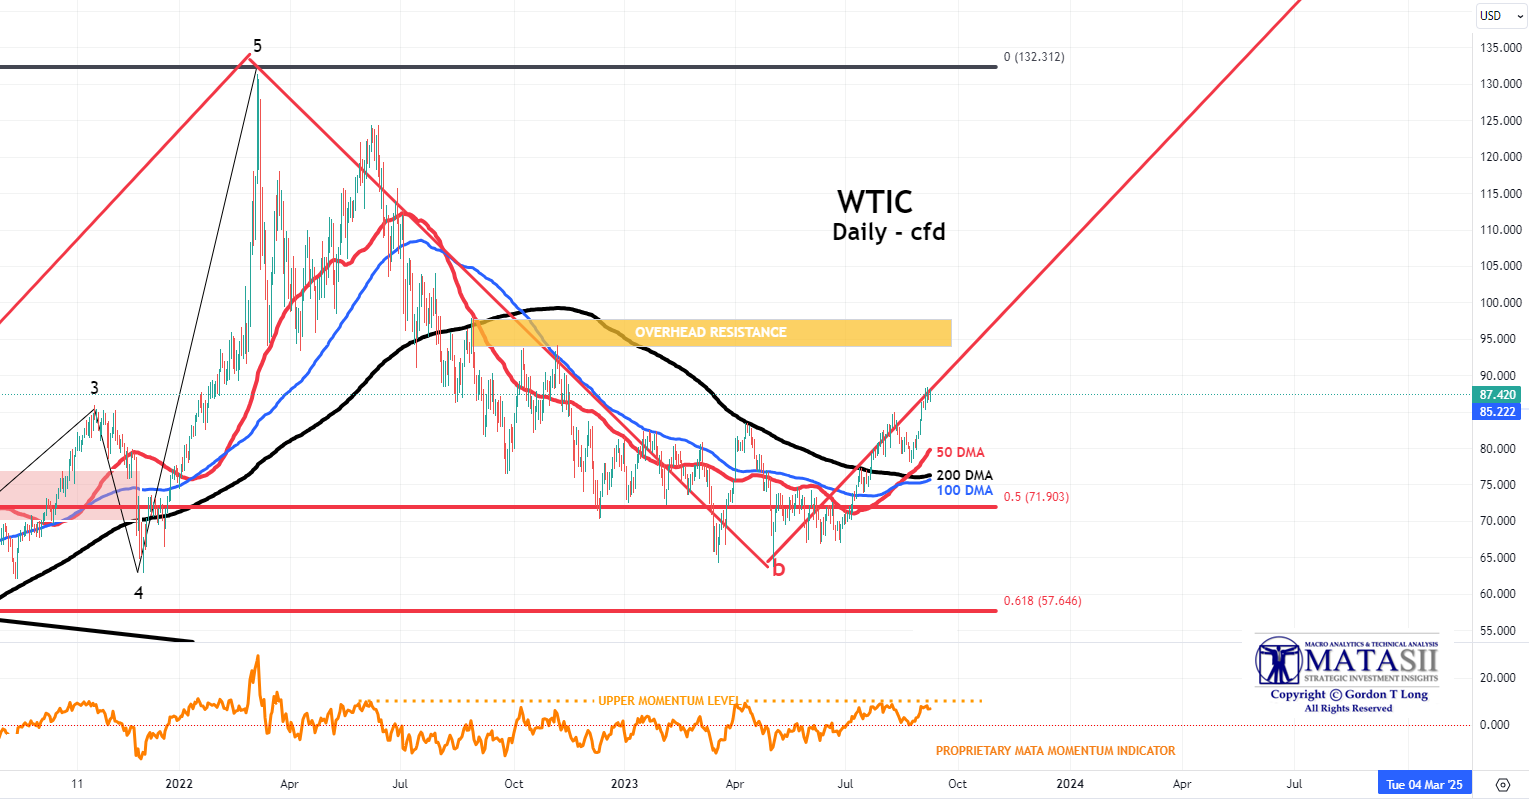
DAILY – cfd
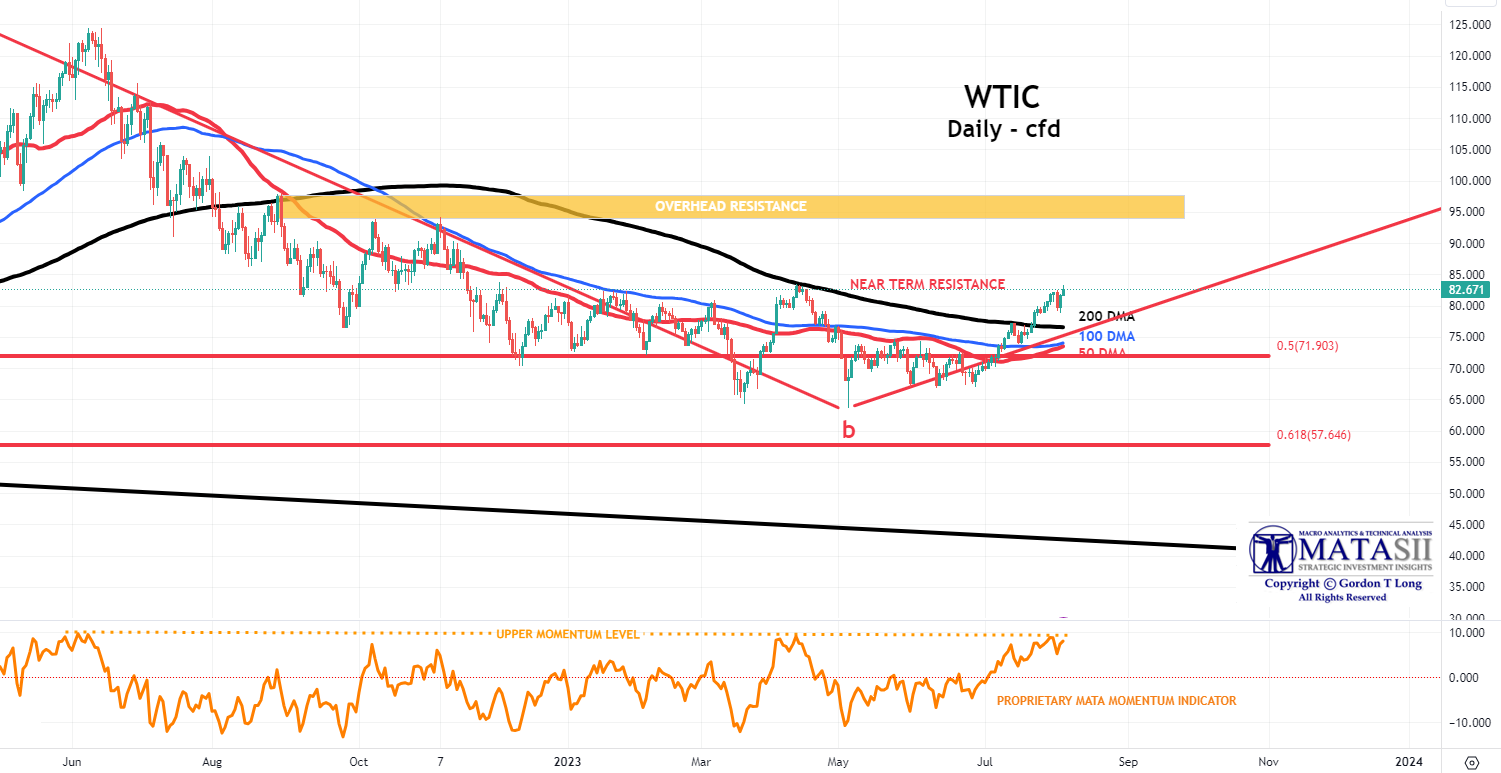 WE PREVIOUSLY WROTE:
The Daily chart suggests that in the short term WTIC may face overhead resistance, but after some further consolidation a move towards intermediate term overhead resistance at ~$94/bl is a possibility. (Chart Right)
CURRENT (Chart Below)
-
- Price has decidely moved upward with a gap on the Saudi/ Russian announcements.
- The 50 DMA has crossed decidely above the 100 and 200 DMAs.
- The 100 DMA has not yet crossed the 200 DMA.
- The MATASII Momentum Indicator appears to be at important overhead resistance. This may mean further time is required before price moves higher.
YOUR DESK TOP / TABLET / PHONE ANNOTATED CHART
Macro Analytics Chart Above: SUBSCRIBER LINK (Set Chart to “D” for Daily)
GOLD
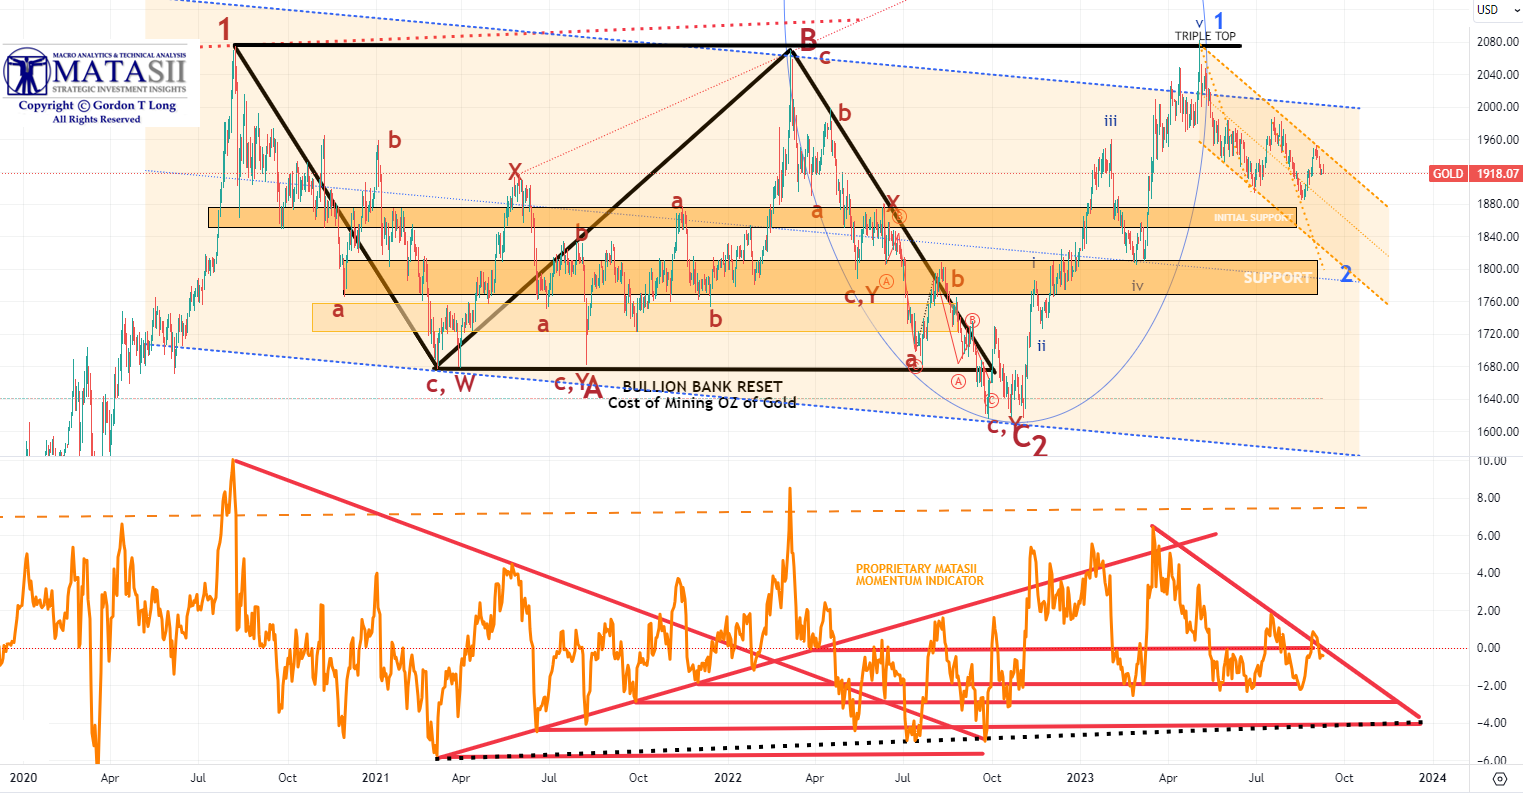
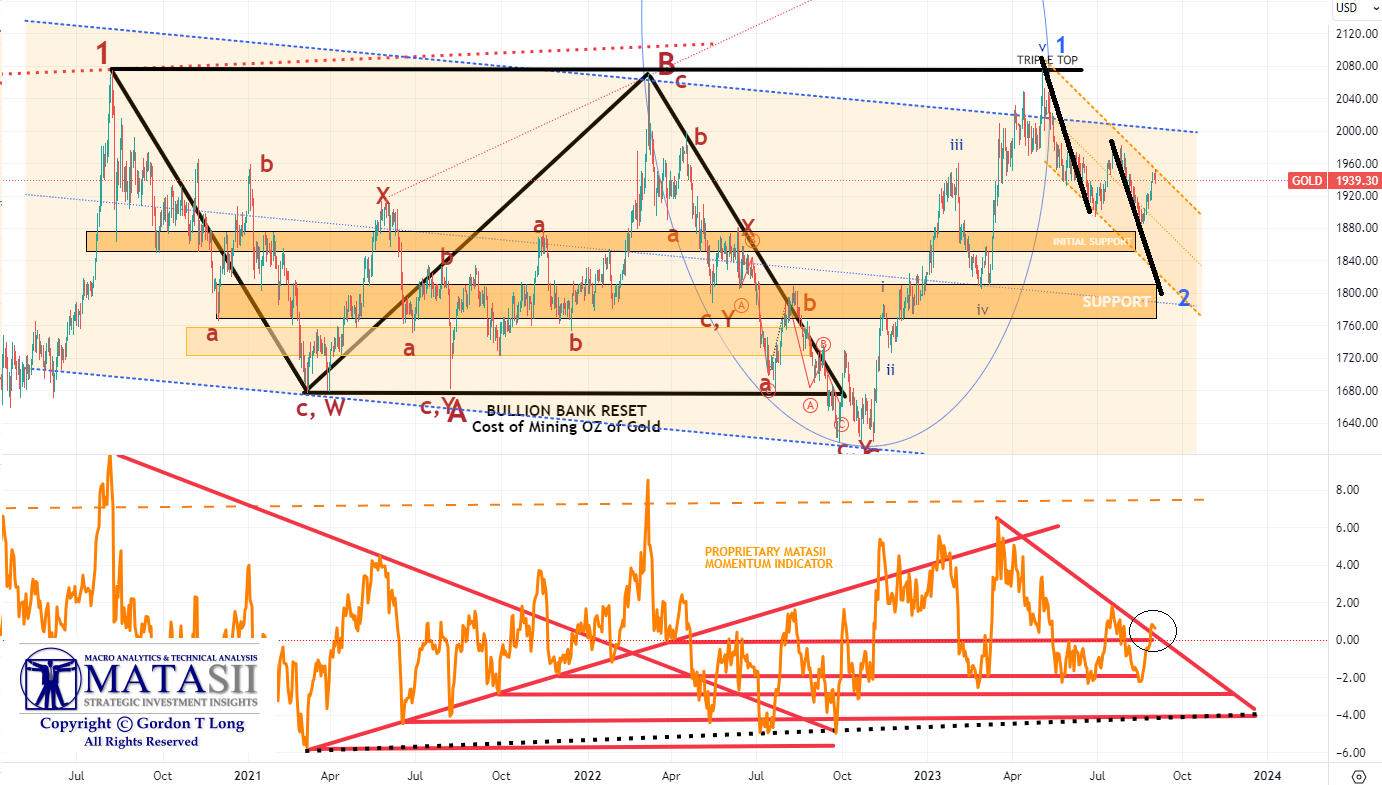 WE PREVIOUSLY WROTE:
As we drill down into the short-term charts for Gold, we see a pretty clear Elliott Wave count set-up of Initial 1-2 Waves, suggesting gold is setting up for a major lift. HOWEVER, before that occurs, there is likely one more leg down to complete a smaller Wave 2 (in black).
CURRENT (Chart Below)
-
- Price reversed downward within the downward trend channel as expected in the prior chart version.
- The MATASII Momentum Indicator downward trend line held as expected and is headed lower.
YOUR DESK TOP / TABLET / PHONE ANNOTATED CHART
Macro Analytics Chart Above: SUBSCRIBER LINK
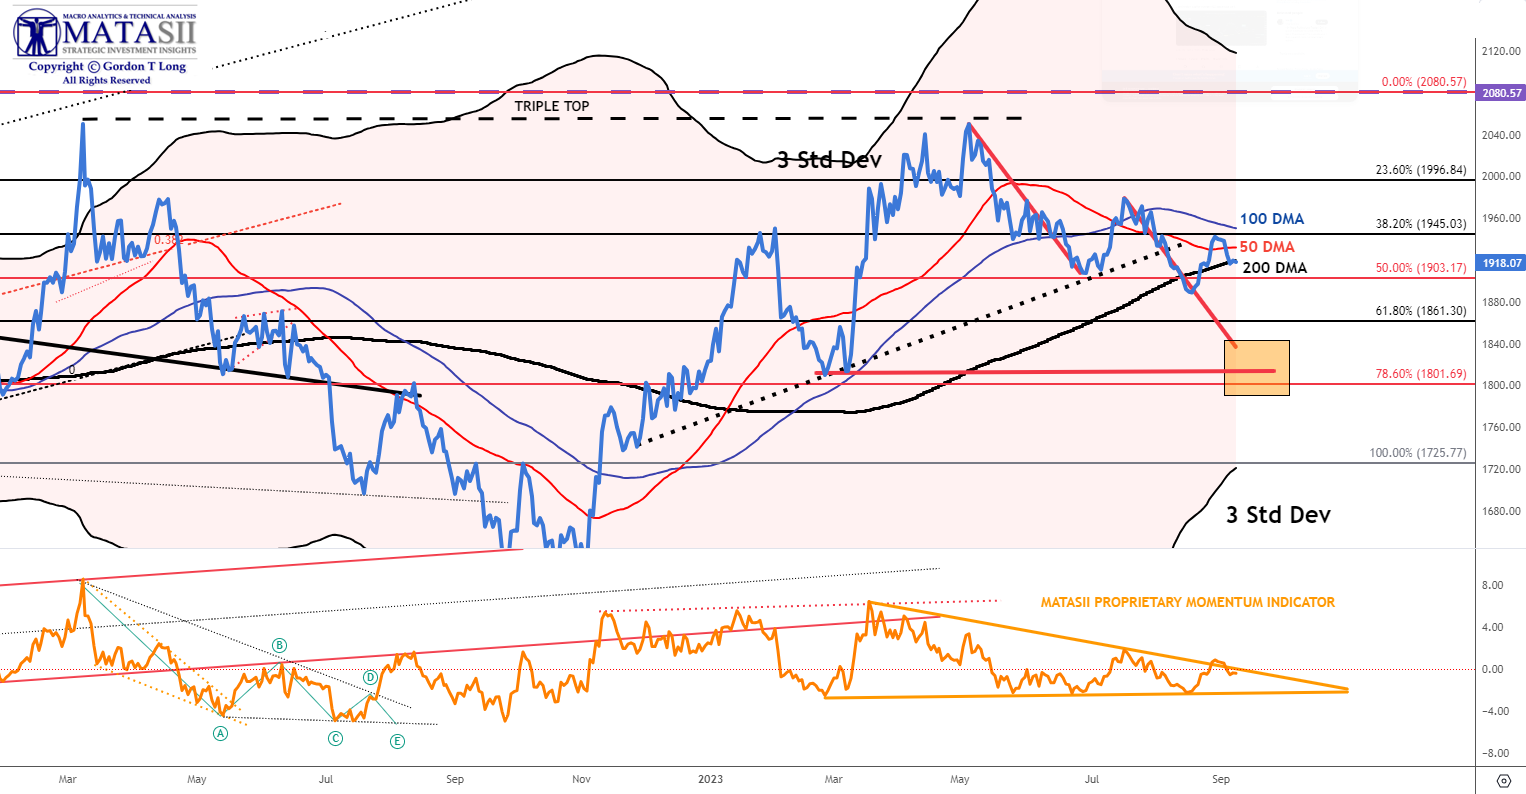
The next chart requiring consideration is the Daily chart with 50/100/200 Daily Moving Averages and the Bomar 3 Standard Deviation Bands.
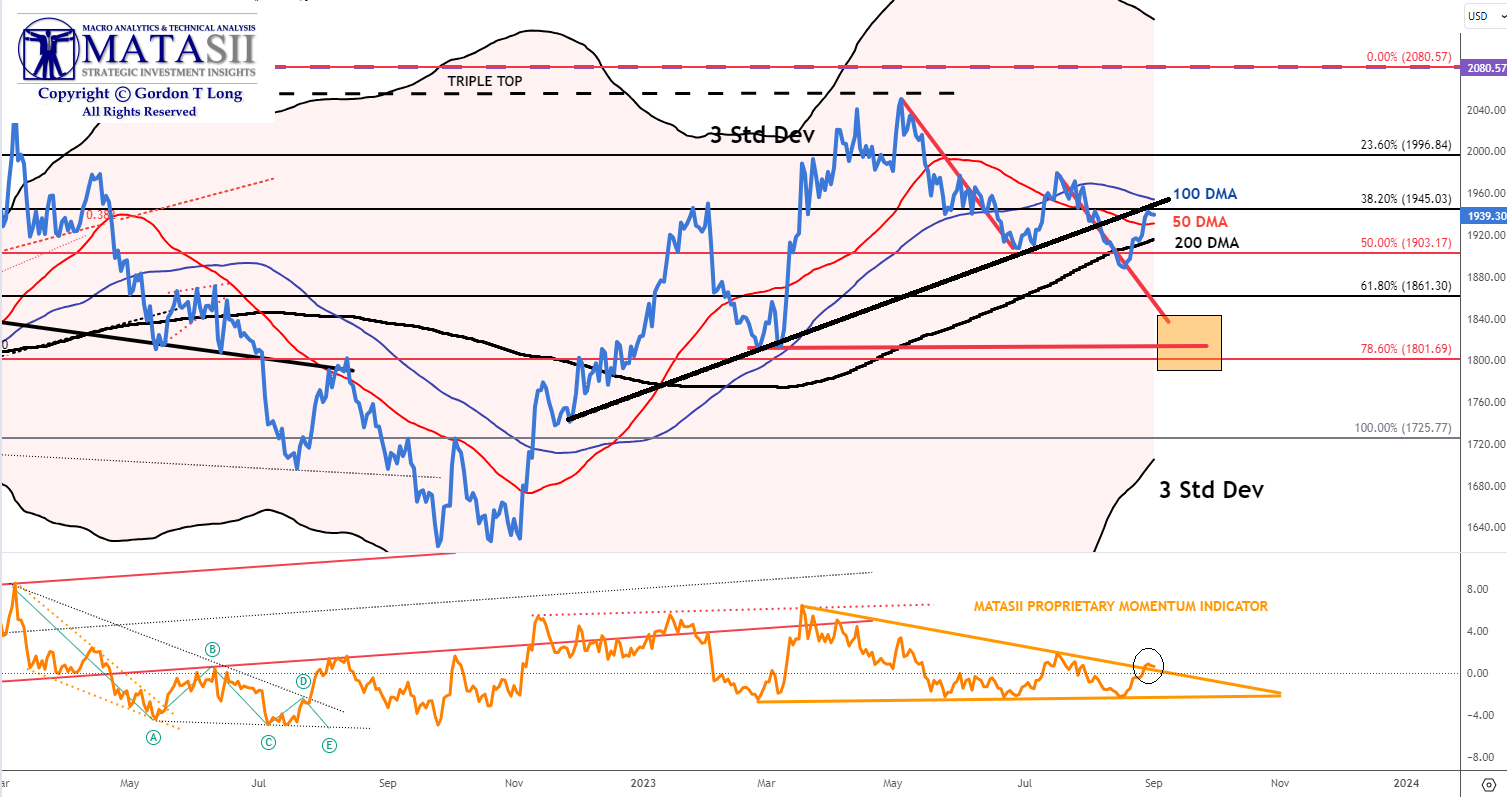 AS WE PREVIOUSY WROTE:
-
- The 50 DMA (in red) has crossed below the 100 DMA (blue line) in a downward trend. The 100 DMA is currently in a downward trend towards a potential cross of the 200 DMA.
- The 50/100/200 DMAs are tightening their pattern in a typical “Banding” manner. This usually proceeds a major move – up or down.
- A possible corrective ABC (in red) where “A” = “C” projects a logical support area (gold box).
- The 3 Standard Deviation Bomar bands, which gold has been operating with (which are unusual), suggests a likely classic Bollinger Band Cross, which means a potential touch of the rising lower 3 Std Dev Bomar (lower rising black line).
CURRENT (Chart Below)
-
- Price has moved down to the 200 DMA support level.
- The MATASII Proprietary Momentum indicator is signalling potential further price weakness. LIkely short lived and relatively minor.
YOUR DESK TOP / TABLET / PHONE ANNOTATED CHART
Macro Analytics Chart Above: SUBSCRIBER LINK
FAIR USE NOTICE This site contains copyrighted material the use of which has not always been specifically authorized by the copyright owner. We are making such material available in our efforts to advance understanding of environmental, political, human rights, economic, democracy, scientific, and social justice issues, etc. We believe this constitutes a ‘fair use’ of any such copyrighted material as provided for in section 107 of the US Copyright Law. In accordance with Title 17 U.S.C. Section 107, the material on this site is distributed without profit to those who have expressed a prior interest in receiving the included information for research and educational purposes. If you wish to use copyrighted material from this site for purposes of your own that go beyond ‘fair use’, you must obtain permission from the copyright owner.
NOTICE Information on these pages contains forward-looking statements that involve risks and uncertainties. Markets and instruments profiled on this page are for informational purposes only and should not in any way come across as a recommendation to buy or sell in these assets. You should do your own thorough research before making any investment decisions. MATASII.com does not in any way guarantee that this information is free from mistakes, errors, or material misstatements. It also does not guarantee that this information is of a timely nature. Investing in Open Markets involves a great deal of risk, including the loss of all or a portion of your investment, as well as emotional distress. All risks, losses and costs associated with investing, including total loss of principal, are your responsibility.