Gordon T Long
Global Macro Research | Macro-Technical Analysis
TIPPING POINTS
STOCK BUYBACKS
FALLING PRODUCTIVITY CAN BE SEEN IN THE LITTLE THINGS
Increasingly I find myself concerned about real productivity in the US. It isn’t that US workers aren’t working harder or smarter. Actually that is part of the problem. The productive members of the US work force are working so hard to survive that they have little time to see fully what is happening to them and their families.
It seems more and more I find “things” simply no longer work In America. Corporations have cut costs to such an extent that small “white space” problems are everywhere with untrained and ill- equipped incompetence being no longer the exception but rather the rule.
Computerization has left almost no one able to solve the problem someone caused for you. The problem often stems from small adjustments occurring faster than the “code” can be identified or resourced to be “tweaked”! Corporate cuts on their books may be showing up as productivity, but their customers are simply getting less and less for more and more! The panacea of AI is likely to only take us to a new level of disconnection from our corporate over-lords.
But the problem is more than eroding management depth, experience and the shallow MBA mentality that has captured American business! It is increasingly about the interference of government at all levels of business and personal matters. This comes with the inevitable cancer of corruption.
Government regulation is monkey-hammering businesses, especially small businesses. High wages kill small businesses that can’t afford to automate. Many small businesses are being forced to cut hours and staffing until they simply go out of existence. If you want, you can declare this the plan of a government seeking to control everything and everyone?
Real growth and productivity are generally a direct result of private enterprise being able to move forward without barriers from the government constantly impeding progress.
Productivity is a huge factor contributing to real growth. Sadly, it is becoming apparent that Quantitative Easing failed to bring much growth. Easy money was an experiment that did not fulfill its promise. The side effects of unlimited and false liquidity has proven toxic to how America now runs.
This has expectantly only resulted in bigger government, more regulation, less productivity and mal-investment of an ever increasing shortage of producitvity enhancing capital.
WHAT YOU NEED TO KNOW
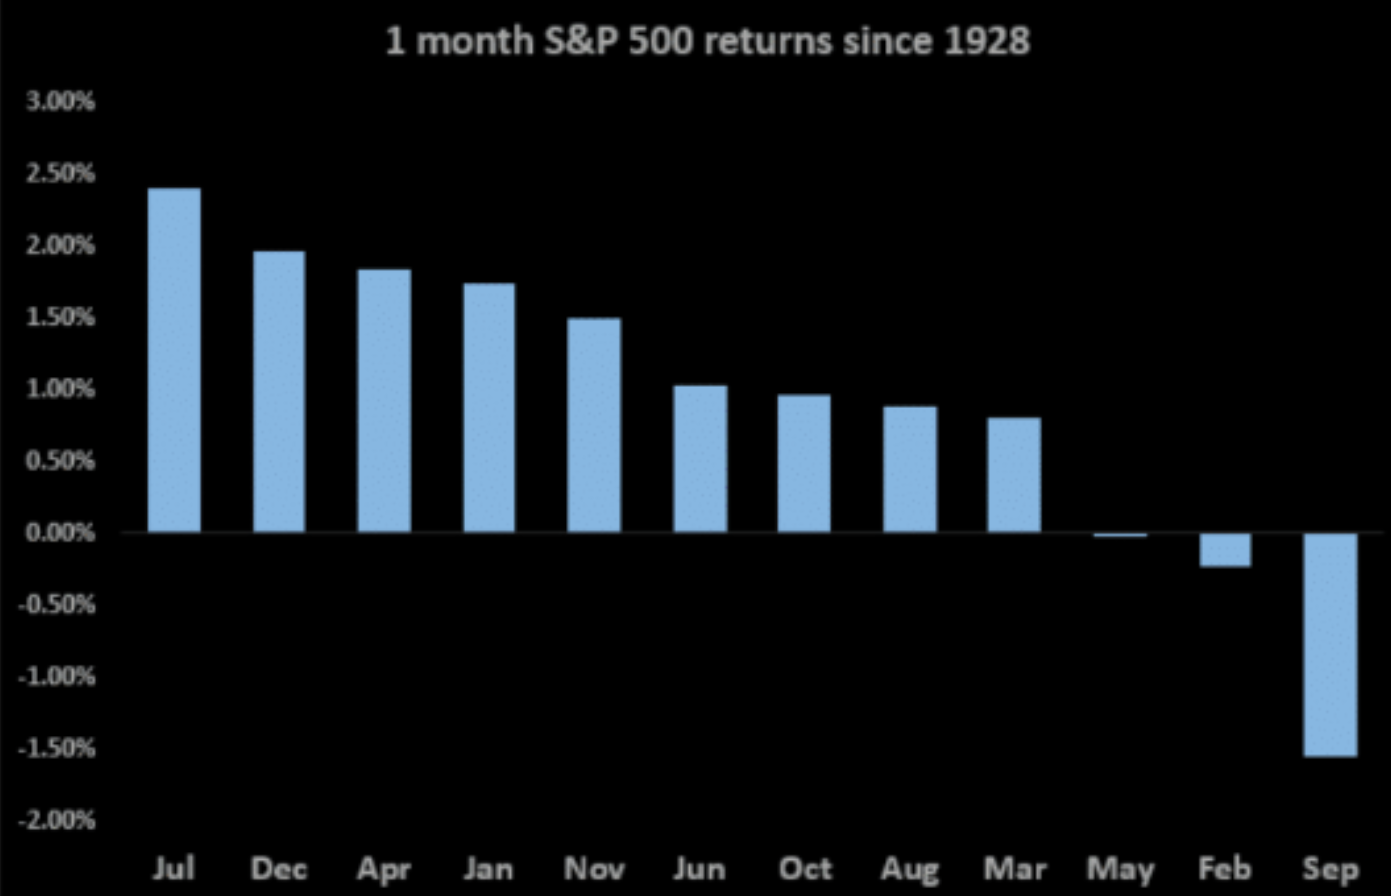 BEWARE OF THE WORST MONTH OF THE YEAR! It is always wise to be cautious in September, as since 1928, it stands out as the worst month of the year! Why?
-
- It proceeds Q4 earnings season when estimates are taken down in advance of reporting, so “beats” are delivered.
- The realities of Q4 earnings often no longer match “hockey stick” YE expectations and analysts are forced to adjust their ratings.
- 2023 earnings become more important and if lower expectations over the 2022-2023 period are evident, stocks valuations are reduced.
- Current VIX projections are signaling a major spike in September 2023.
CORPORATE EARNINGS: The Earnings Conference Calls Showed Us What is really Going on!
-
- Corporations as recently as March of 2022 sold bonds at historic low rates to fund stock buybacks.
- With rising Interest Rates Corporations have increasingly been redirecting their cash raised and initially allocated for Stock Buybacks to instead buy short term US Treasury Bills Yielding +5%.
- These interest payments are going directly to the corporate bottom line, thereby offsetting weakening top line sales growth!
- Separately, their previously sold bonds are now worth significantly more in the after market, thereby rewarding institutional players like Pensions and Insurance companies that invested in these corporations. Effectively, these corporations have given investors increasing confidence they can play the “stock game” as well as Wall Street can!
BIDENOMICS IS FAILING MISERABLY: Food Stamps Telling the Real Story About The American Consumer
-
- Among households using the Supplemental Nutrition Assistance Program’s boosted pandemic benefits, 42% skipped meals in August and 55% ate less because they couldn’t afford food, more than double last year’s share, according to a Wednesday report from Propel Inc., a benefits software developer.
- While the number of people on food stamps has risen 3% since Biden took office, costs have exploded, with benefits rising a whopping 54% in just two years.
- Administrative costs for food stamps have also ballooned, rising over $500 million since Biden took office, bringing the program’s total cost to the taxpayer to $120 billion a year.
GLOBAL ECONOMIC REPORTING: What This Week’s Key Global Economic Reports Tell Us?
-
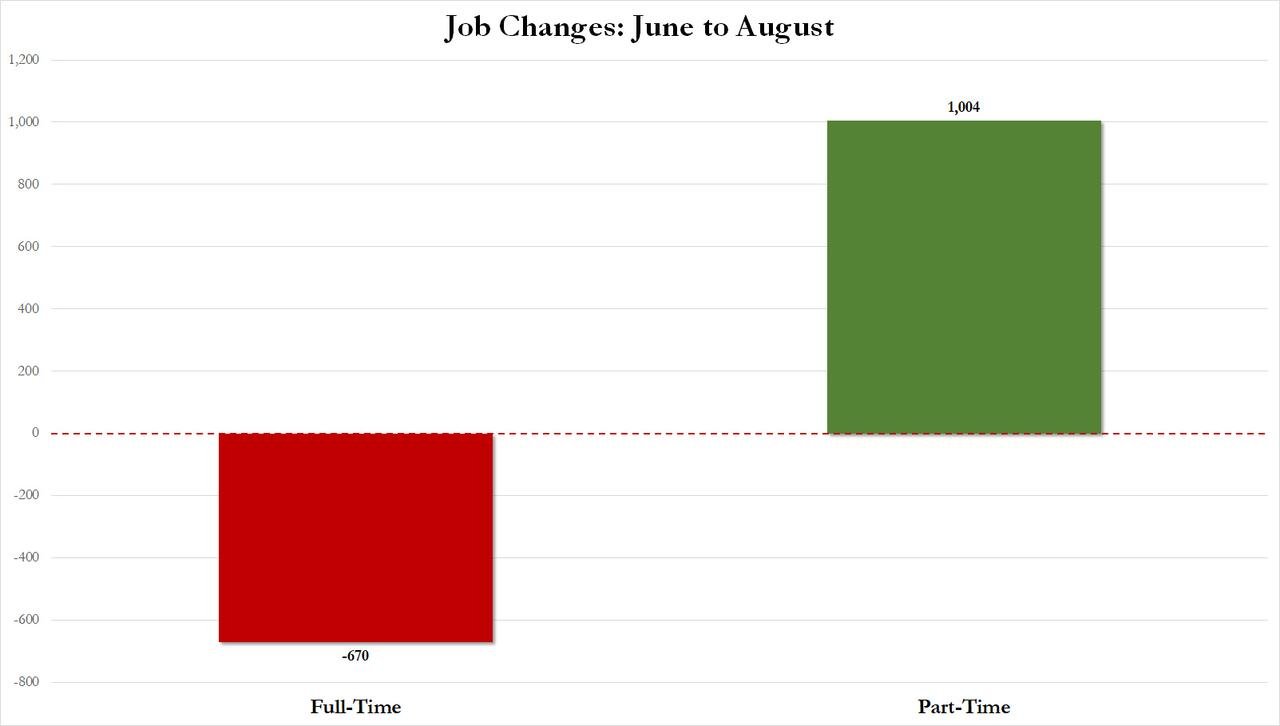
- Though the BLS doesn’t report it this way, what we saw was the US Non-Farm Payrolls witnessed a 670K drop in full-time workers in the past months, offset by a 1,004K jump in part-time workers.
CONCLUSION
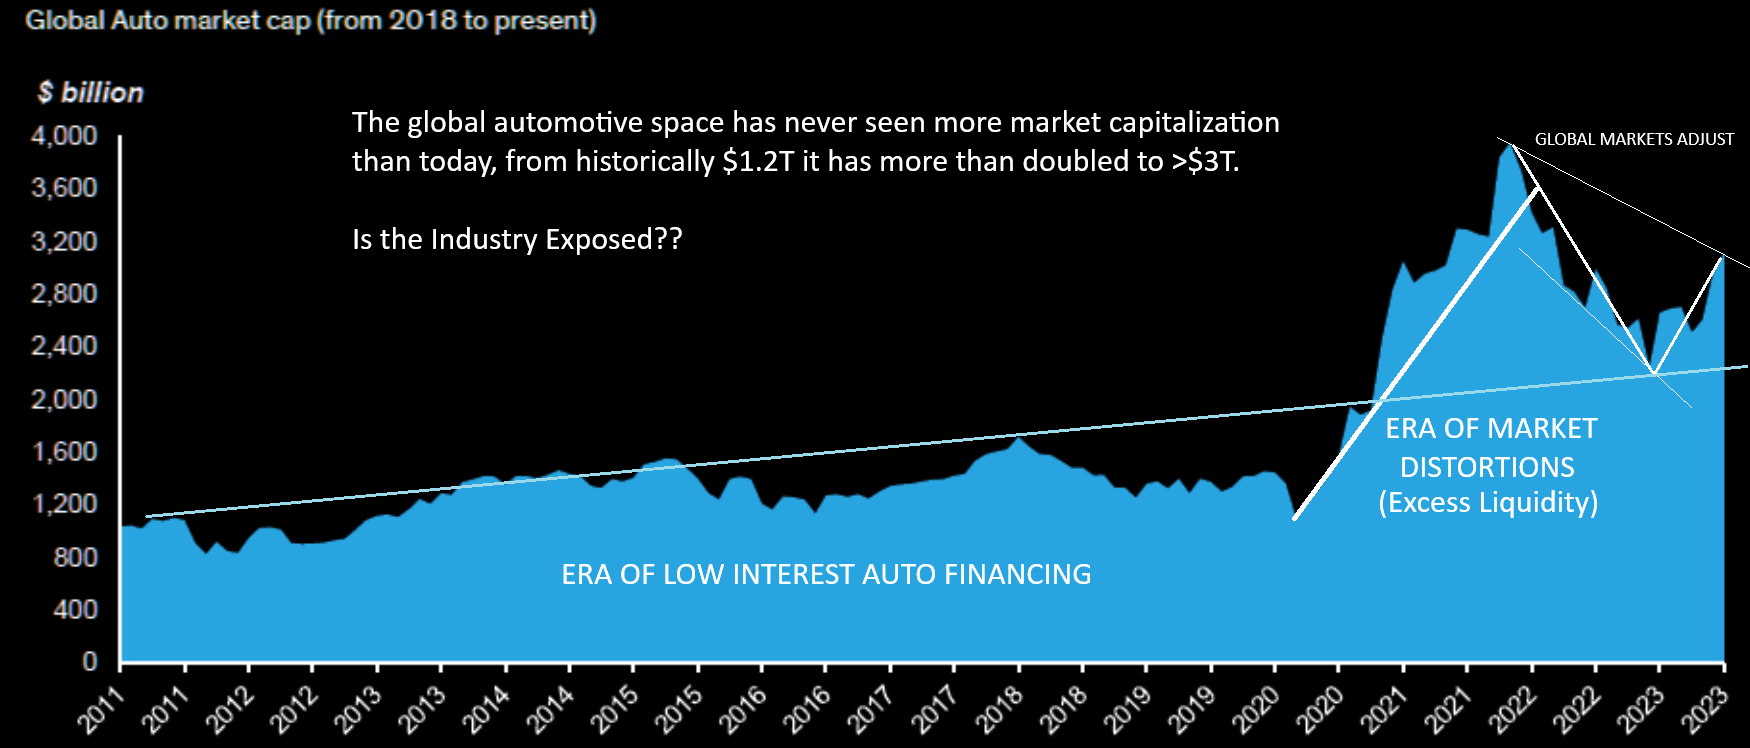
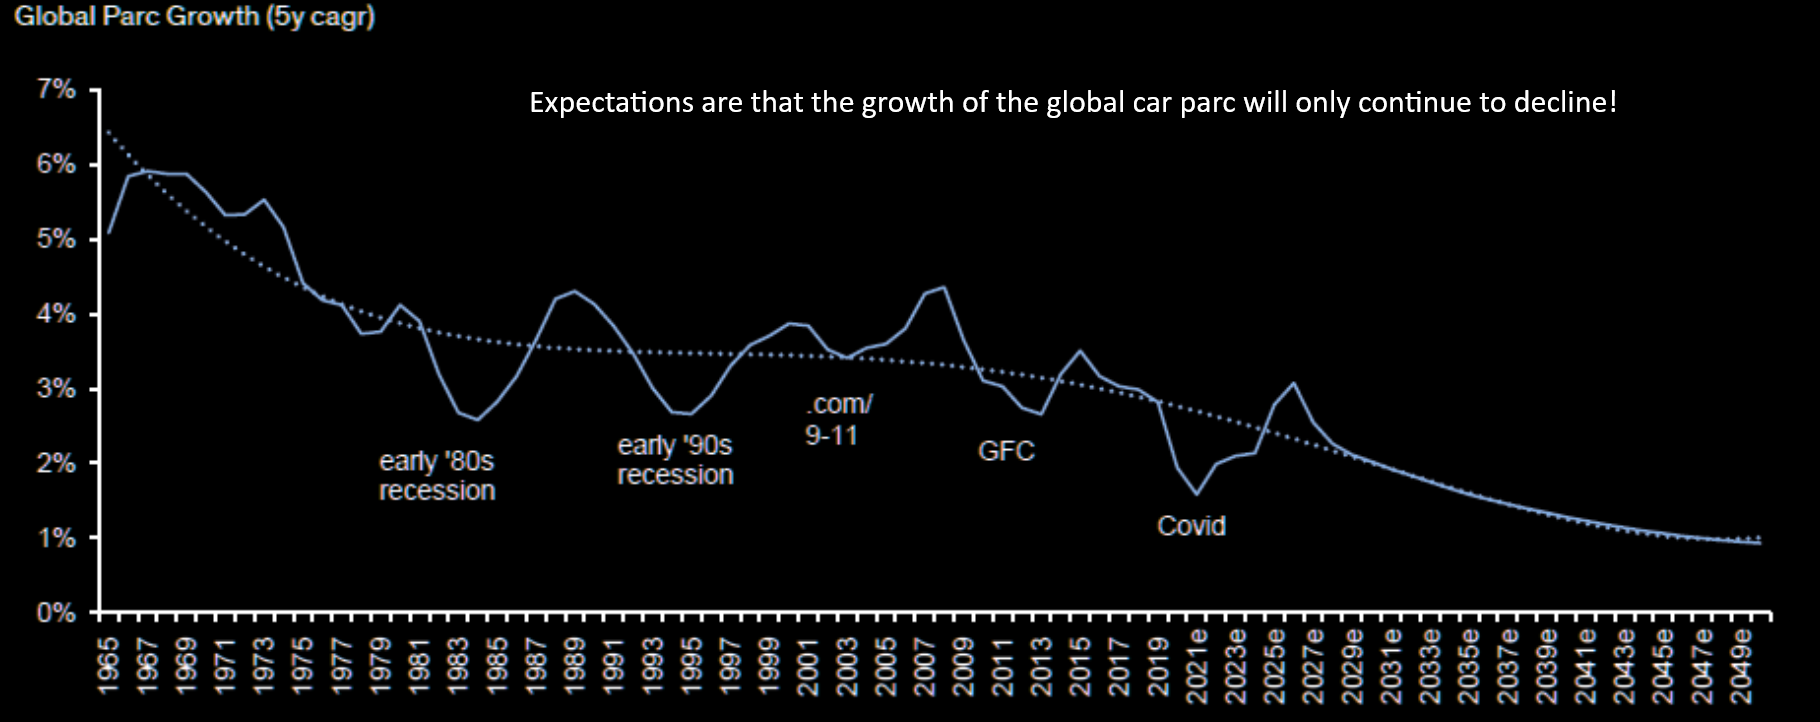
 THE GLOBAL PICTURE IS WEAKENING FASTER THAN INVESTORS FULLY APPRECIATE
It is becoming increasingly evident that the global economic situation continues to worsen without any clear indications on what might change this. I read the following highlight clips last week and it indicated all you need to know…..
“EV demand might have plateaued while major automakers are still ramping up production. By 2026, the US market is expected to have 90 new EV models, according to AutoForecast Solutions. We suspect many brands will suffer with profitability.”
CORPORATE EARNINGS: The Earnings Conference Calls Showed Us What is Really Going on!
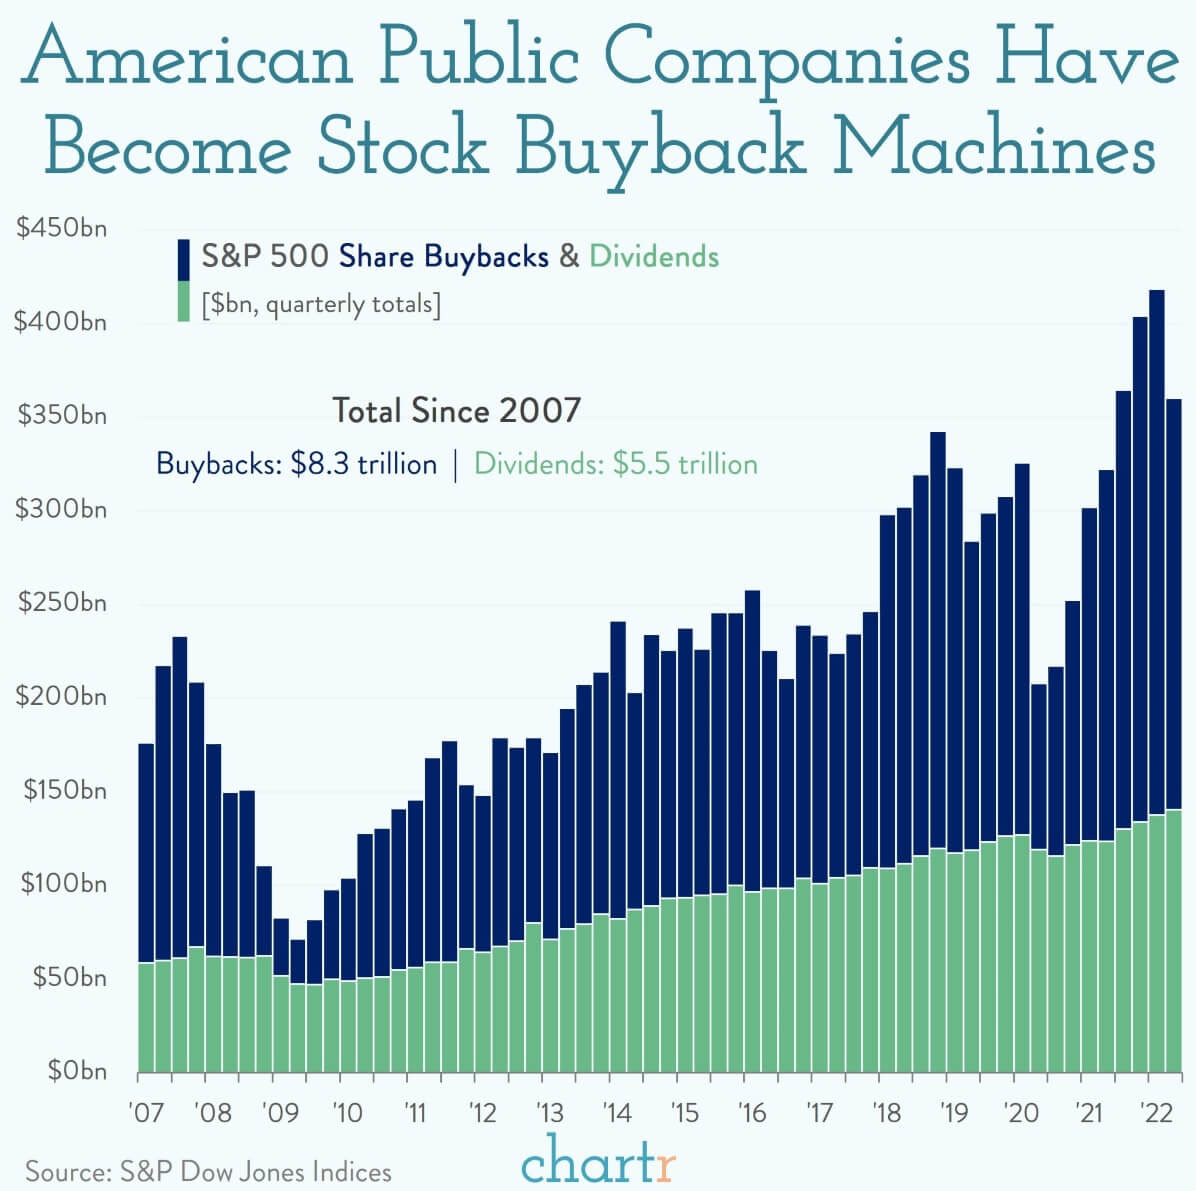 As recently as March of 2022, larger S&P 500 corporationas were selling their bonds at historic low rates to raise capital. Corporations fully capitalized on near Zero based rates that Quantitative Easing delivered.
The cash raised has predominately been used to fund stock buybacks and/or increase dividend payouts, which made their stock attractive and resulted in higher PE valuations driven by eager investors looking for yield with the added bonus of stock appreciation.
This game has served all participants well for nearly a decade and taken stock markets to dizzy heights.
However, that game has changed as rising rates have made corporate bonds more expensive for corporations to issue. Additionally, higher valuations are making buybacks quite expensive as a use of capital (inlcuding money already raised and allocated to Buybacks).
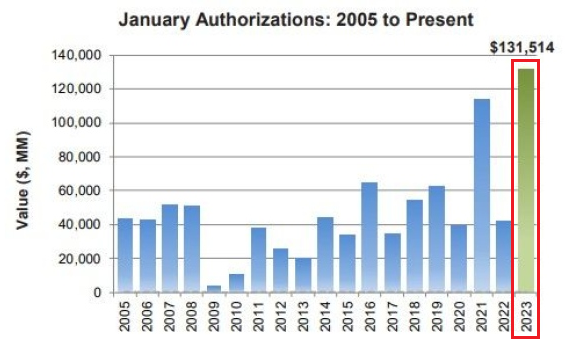 We noted in January that there were major concerns on whether corporations would follow through with buybacks with such large hoards af cash already allocated to buybacks:
In the first month of 2023, announced buybacks more than tripled to $132 billion from a year ago, reaching the highest total ever to start a year, according to data compiled by Birinyi Associates. The planned repurchases surpassed the previous January record, set two years ago, by more than 15%.
….. at a time when recession risks are mounting amid Federal Reserve tightening, the buying spree may be viewed as a ruthless deployment of cash. To investors who watch companies cut costs on everything from travel and hiring, however, the unbroken commitment to share buybacks offers a dose of comfort amid all the doom forecasts.
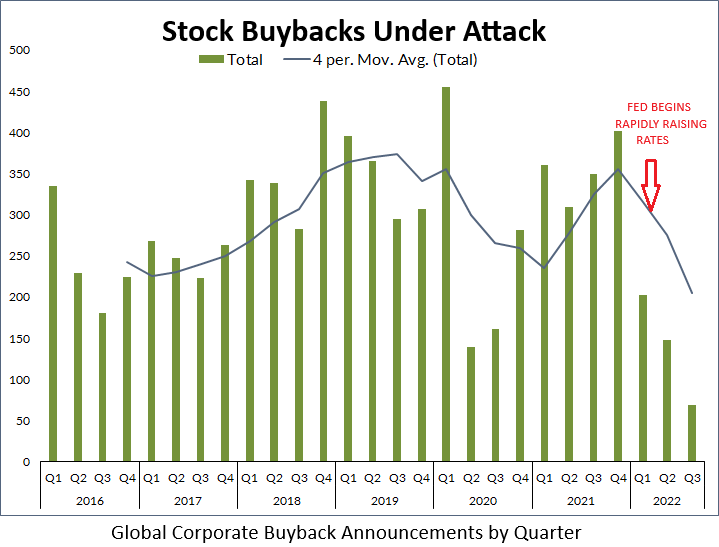 However, clever CFOs and management consultants already quickly grasped that a change of strategy was required as they looked down the “gun barel” of a looming recession and seeing their top line sales growth increasingly under attack. The question was how to protect the bottom line and valuations?
The answer was to immediately take their available capital account, buyback allocation funds and free cash flows and buy US Treasury short term US Treasury Bills.
Treasury Bills quickly began paying very attractive prices and still are currently paying north of 5%. This is 5% that could go directly to the pre-tax bottom line, thereby in most instances, offsetting top line deterioration.
CEO’s immediately pushed the buy button, which flushed Janet Yellens TGA coffers, market liquidity and corporations net interest payments.
THE RESULTS
Larger corporations have been relatively immune to rising rates (red Line below). Meanwhile financing is getting tougher and tougher for smaller companies without the same access and expertise. With the ongoing challenges faced by small to mid-sized companies as signs point towards an impending recession, larger corporations might seem insulated.
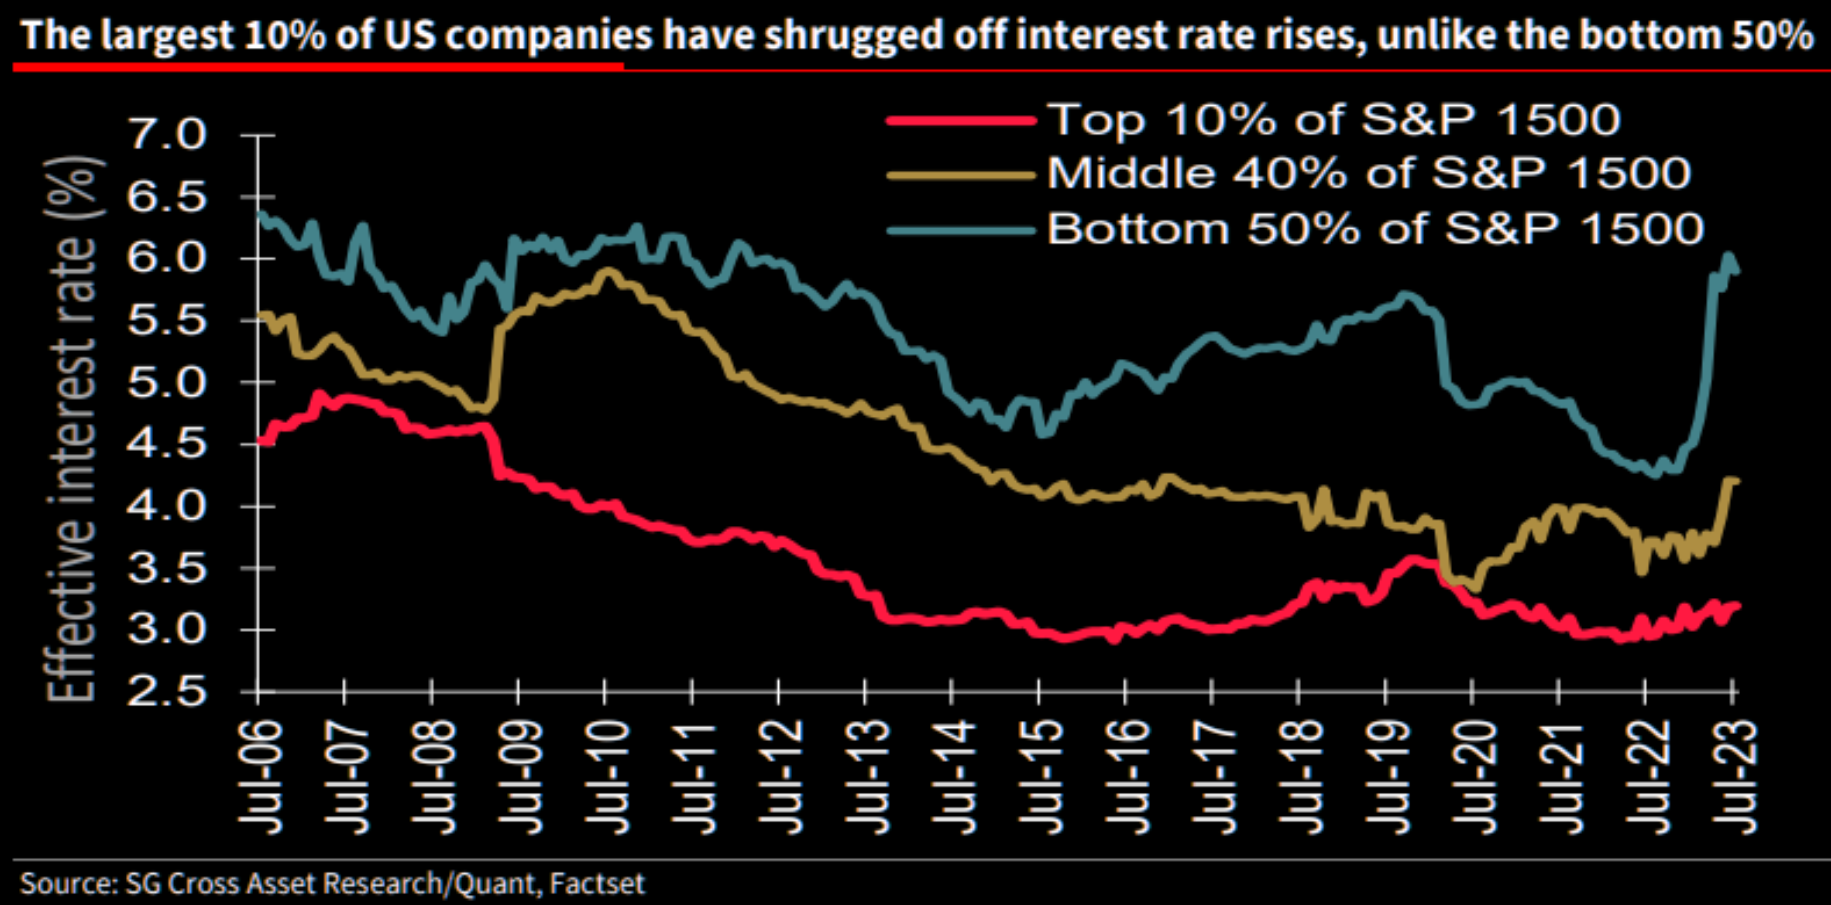
Despite the rising interest rates traditionally squeezing profit margins, large corporations have maneuvered astutely…they’ve not only evaded the negative impacts but even turned higher rates into profit boosters.

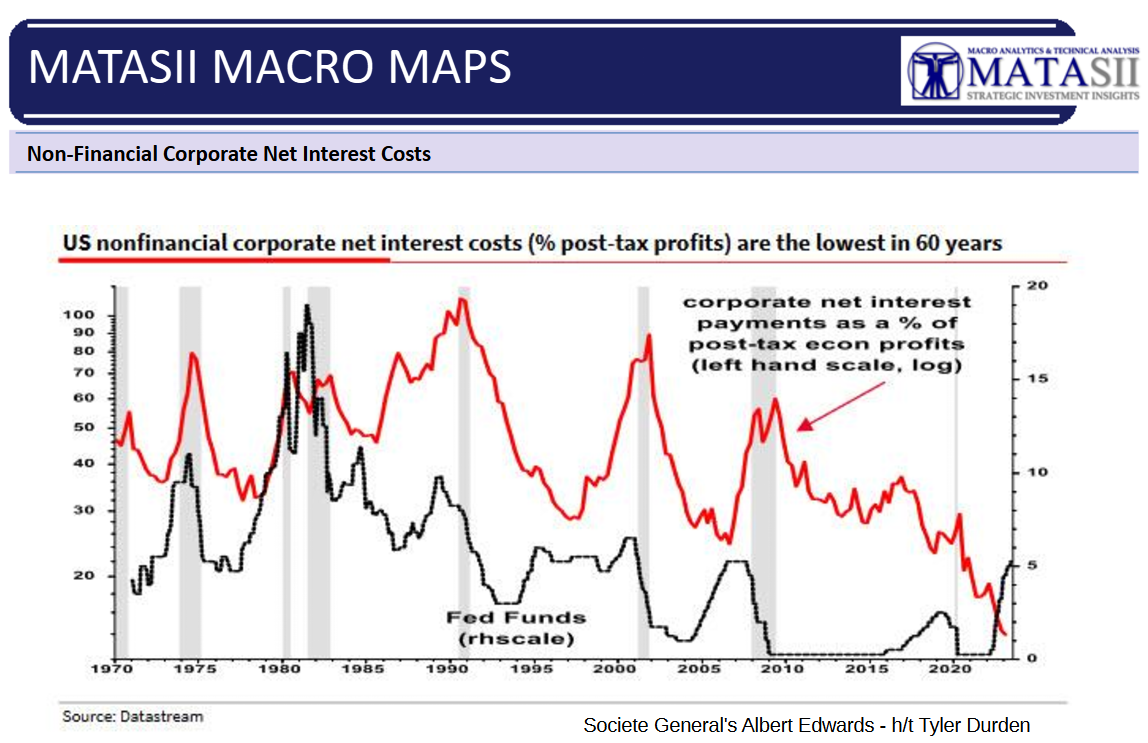
US corporate sector is a massive net borrower. Normally when interest rates rise, so too do net debt payments, squeezing profit margins and slowing the economy. BUT NOT THIS TIME! Corporate net interest payments have instead collapsed, SHOWING EXACTLY WHAT WE SUSPECTED WAS GOING ON. Until now we couldn’t find the data (h/t to Societe General and Albert Edwards).
BIDENOMICS IS FAILING MISERABLY: Food Stamps Tell the Real Story About The American Consumer
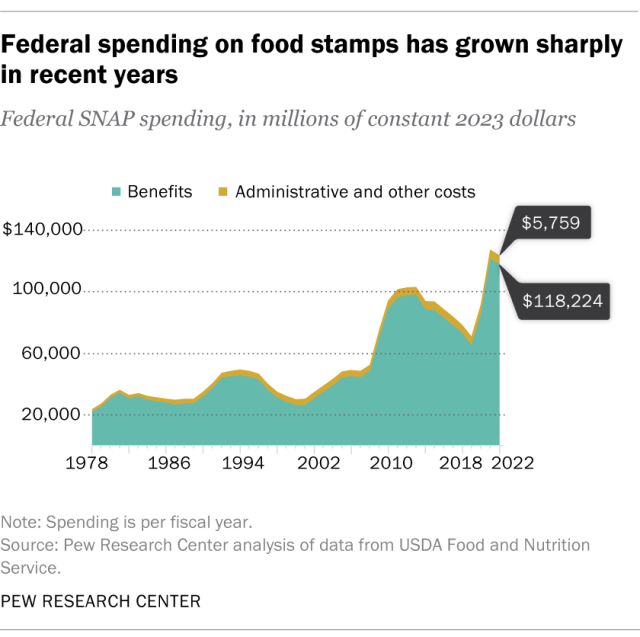 While the number of people on food stamps has risen 3% since Biden took office, costs have exploded, with benefits rising a whopping 54% in just two years.
Administrative costs for food stamps have also ballooned, rising over $500 million since Biden took office, bringing the program’s total cost to the taxpayer to $120 billion a year.
That’s twice what the program cost in 2019 under Trump.
If Biden had managed to achieve the same downward trend in welfare reliance that his predecessor had, food-stamp rolls wouldn’t have increased the last two years, but declined.
And the number of people on food stamps would be 5 million less today, nearly back to their 2019 level.
Indeed, the increased dependency on government for millions of Americans flies in the face of the Bidenomics narrative, that this administration rescued an economy on the brink and transformed it into a powerhouse with tens of millions more jobs.
If so many more people are working, after all, why are they all going on food stamps?
One reason is the 40-year-high inflation caused by the government spending, borrowing and printing trillions of dollars over the last several years.
Consider:
- The average American worker pays markedly less than $4 an hour in federal income tax, but on top of that, inflation has reduced what that worker’s pay can actually purchase by more than $4 an hour.
- In other words, by increasing the money supply to spend more, the government created more “wealth” for itself, but it also imposed a hidden tax (inflation) on American workers that decreased their wealth.
 HERE ARE THE HARD REALITIES THAT I PERSONALLY WITNESS – The graphic to the right depicts bagged groceries distributed at the American Red Cross Food Pantry, close to me in the greater Boston area. (US.Photographer: Kayana Szymczak/Bloomberg)
An increasing share of low-income Americans are behind on rent and struggling to afford food, adding to signs of growing financial distress in the economy.
Among households using the Supplemental Nutrition Assistance Program’s boosted pandemic benefits, 42% skipped meals in August and 55% ate less because they couldn’t afford food, more than double last year’s share, according to a Wednesday report from Propel Inc., a benefits software developer.
Those on SNAP are typically households with income at or below the poverty line.
The data also highlight that households were worse off in August from just a month ago. Since July, an increasing share of low-income households had utilities shut off, couldn’t afford the prior month’s utility bill or couldn’t afford rent. More than two-thirds of those surveyed who were receiving boosted SNAP payments said they had some form of debt.
The US economy “is fairing really well, but there’s a lot of hardship being experienced by people with lower incomes right now,” said Justin King, policy director of Propel. “We’ve seen a lot of cutbacks in safety net benefits this year and we’re seeing the impact” of those cutbacks now, he said.
The report adds to other recent data indicating an erosion in consumer finances and sentiment, particularly among the lowest-income households, as labor market demand cools, savings wind down and pandemic social supports expire.
The US Census Bureau’s Household Pulse survey showed that more than one-third of respondents in August found it very or somewhat difficult to afford the basics, an increase from the July reading. Overall consumer sentiment declined to a three-month low in August and those making under $25,000 reported among the biggest drops, according to Conference Board consumer sentiment data published Tuesday.
Food insecurity worsened after SNAP emergency allotments expired at the start of this year, and households received lower payments this summer after the federal government lifted the public health emergency in May, King at Propel said.
The Propel data is based on a survey of 2,846 users in its network of more than 5 million users, taken in the first two weeks of August.
GLOBAL ECONOMIC REPORTING: What This Week’s Key Global Economic Reports Tell Us
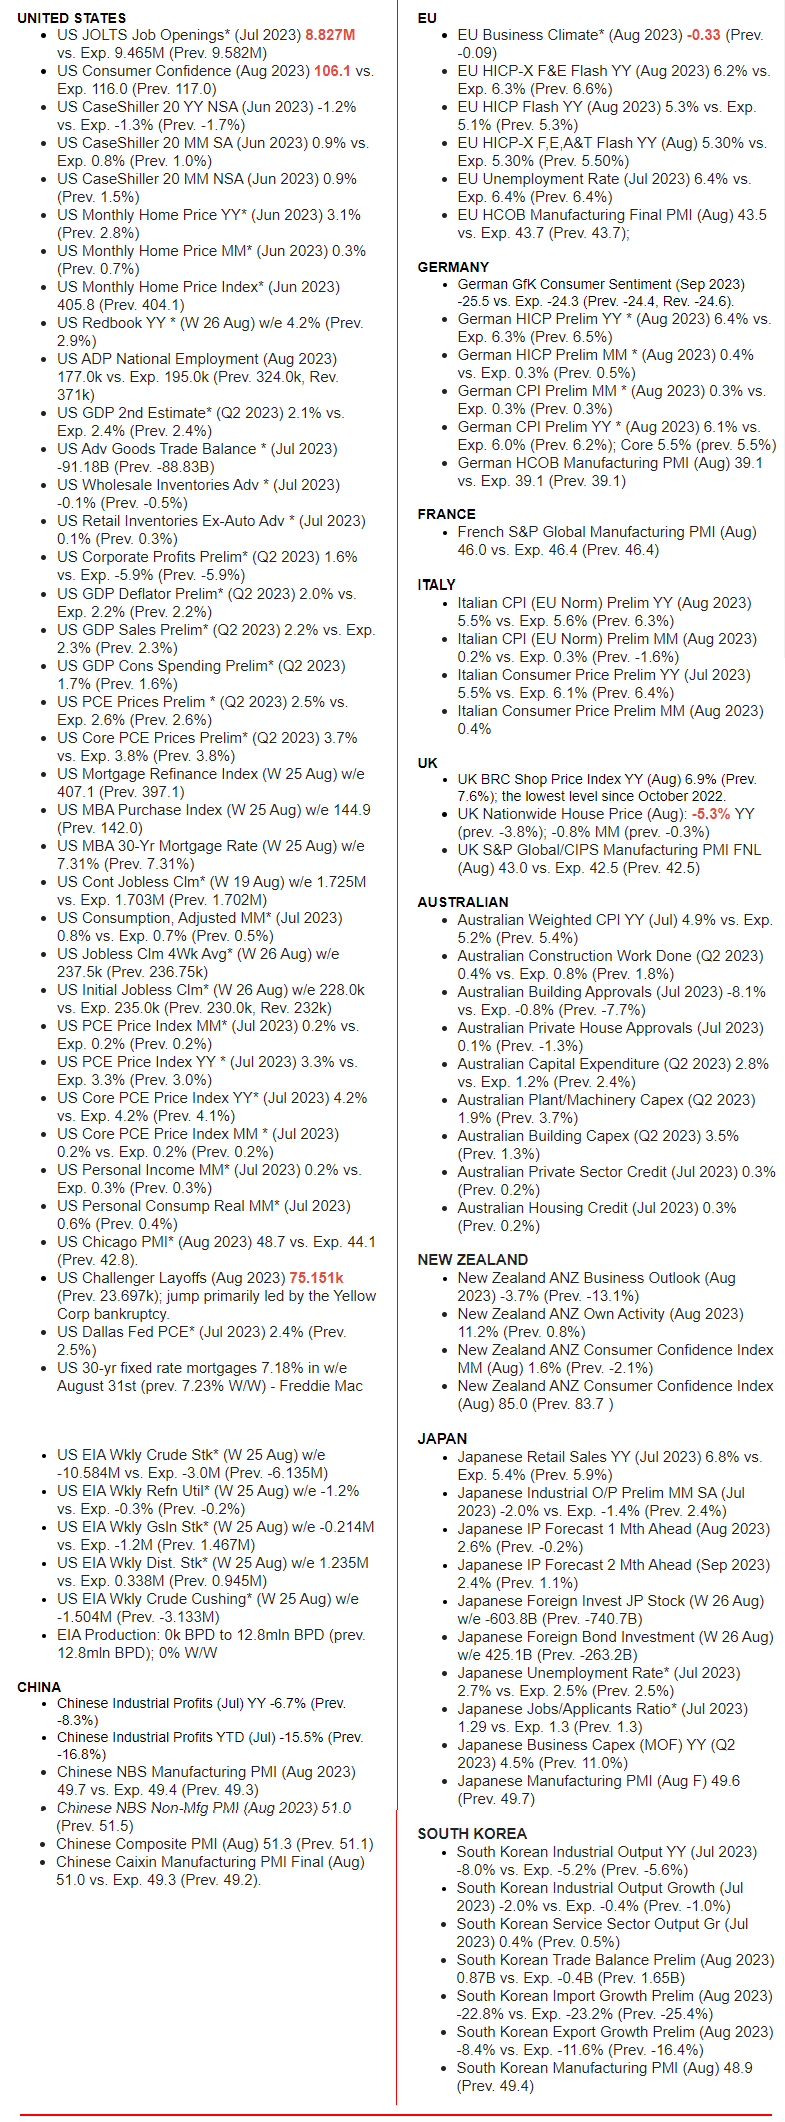
 Recapping this week:
-
- The ‘Core Services’ inflation printed at the second highest since 1985.
- PCE is all in line with Core Y/Y underneath Powell’s expectations.
- Durable goods prices dropped most since 2017 MoM.
- The Chicago PMI was much hotter than expected, which helped support the Dollar to see DXY hit a high of 103.74.
- GDP growth was revised lower (and is negative based on GDI).
- Meanwhile the labor market is clueless as JOLTS, ADP, Challenger-Gray and Continuing Claims all worsened significantly (layoffs soared, although largely due to Yellow layoffs), yet initial jobless claims fell to 2023 lows.
 OFFICIAL AUGUST NON FARM PAYROLLS (BLS)
-
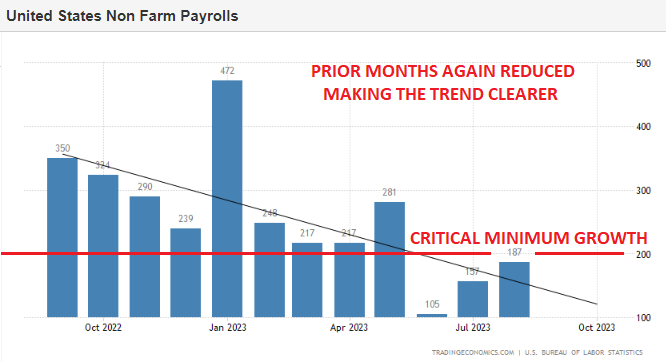
- Officially, as reported by the BLS’ release, the US economy added 187,000 jobs in August 2023, compared to the downwardly revised 157,000 in July and more than market expectations of 170,000.
- It was the third consecutive month with job gains falling below the 200,000 threshold, indicating a gradual easing of labor market conditions, largely attributed to the Federal Reserve’s significant interest rate hikes aimed at cooling down inflation.
- Employment continued to trend up in health care (+71,000), leisure and hospitality (+40,000), social assistance (+26,000), and construction (+22,000).
- On the other hand, transportation and warehousing lost 34,000 jobs, as the bankruptcy of Yellow, a major trucking company, left about 30,000 workers without jobs. Information employment changed little (-15,000), with employment in motion picture and sound recording industries decreasing by 17,000, reflecting the absence of striking Hollywood actors, who are not counted as employed.
“UNADJUSTED” LABOR NUMBERS
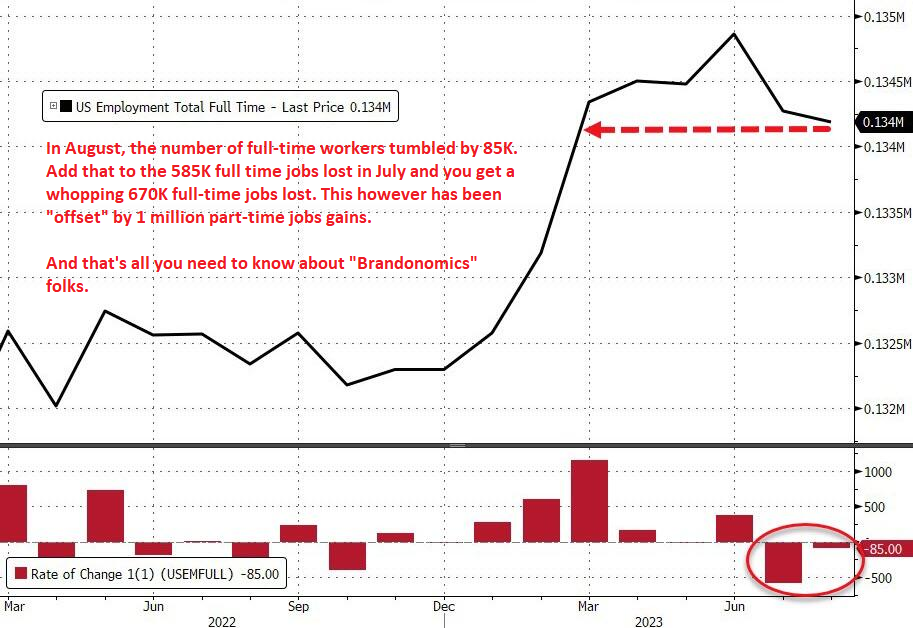
 However, taking a closer look at the BLS’ adjustments applied to the actual data and its composition, we find not only that the unadjusted increase was just 20K jobs, or the worst August since the global financial crisis, but that in August, the number of well-paid, full-time workers actually dropped by 85K, offset by a 32K rise in part-time workers.
Adding to the striking July moves, we get a 670K drop in full-time workers in the past months, offset by a 1,004K jump in part-time workers.
The White House had the audacity to state “Bidenomics So Successful The Average American Has Twice As Many Jobs As They Had Two Years Ago” https://buff.ly/3OFUjqD What do they mean by that ….
“Thanks to the President’s wonderful economic policies, most Americans have at least two jobs,” said gay, black Press Secretary Karine Jean-Pierre to the raucous applause of hand-picked journalists in the room. “Our economists ran the numbers and found that’s twice as many jobs as people used to have just a few years ago. So many jobs! Success!”
As Tyler Durden postulates: “No wonder then that multiple-jobholders are just shy of all time highs, who have discovered that to keep up with the economic miracle that is “Brandonomics” they need to work (far) more than just one job.”
GLOBAL MACRO
WHAT DOES YOUR SCAN OF THE DATA BELOW TELL YOU? – THE MEDIA AVOIDS BAD NEWS!
We present the data in a way you can quickly see what is happening.
THIS WEEK WE SAW
Exp=Expectations, Rev=Revision, Prev=Previous
CONCLUSION
THE GLOBAL PICTURE IS WEAKENING FASTER THAN INVESTORS FULLY APPRECIATE
 It is becoming increasingly evident that the global economic situation continues to worsen with little clear indications on what might change this.
I read the following highlight clips last week as a block and it indicated all you really need to know:
-
- The Japanese government cut its assessment of industrial production and noted industrial output is seesawing, according to Reuters.
- Japanese government official on industrial output said demand fell both domestically and abroad in July, and noted that output fell in many areas including production machinery. The official said the decrease in chip manufacturing machinery is due to weak demand abroad, the outlook appears to be severe; chip shortage is easing in autos, which is on a steady recovery, according to Reuters.
-
 Japanese government official said the electronics device market in China is in a severe state; Domestic material industries are partially affected by China’s real estate concerns, according to Reuters.
 - BoJ Board Member Nakamura said the BoJ must patiently maintain easy policy for the time being, and need more time to shift to monetary tightening; Japan’s economy is no longer in deflation; tweaks to policy must be cautious.
Meanwhile other major country news like China only signals problems continue to mount:
-
- PBoC said it will continue to step up loans to private firms and will use stocks and bonds to deal with risks of private property developers in a prudent way, according to Reuters. PBoC added it will encourage and guide institutional investors to buy bonds of private firms and will support IPO and refinancing of private firms.
- PBoC injected CNY 209bln via 7-day reverse repos with the rate at 1.80% for a CNY.
When major countries have the a key component of their industrial economy in trouble (Japan = Autos, China = Electronics), it normally doesn’t bode well for your investments!
-
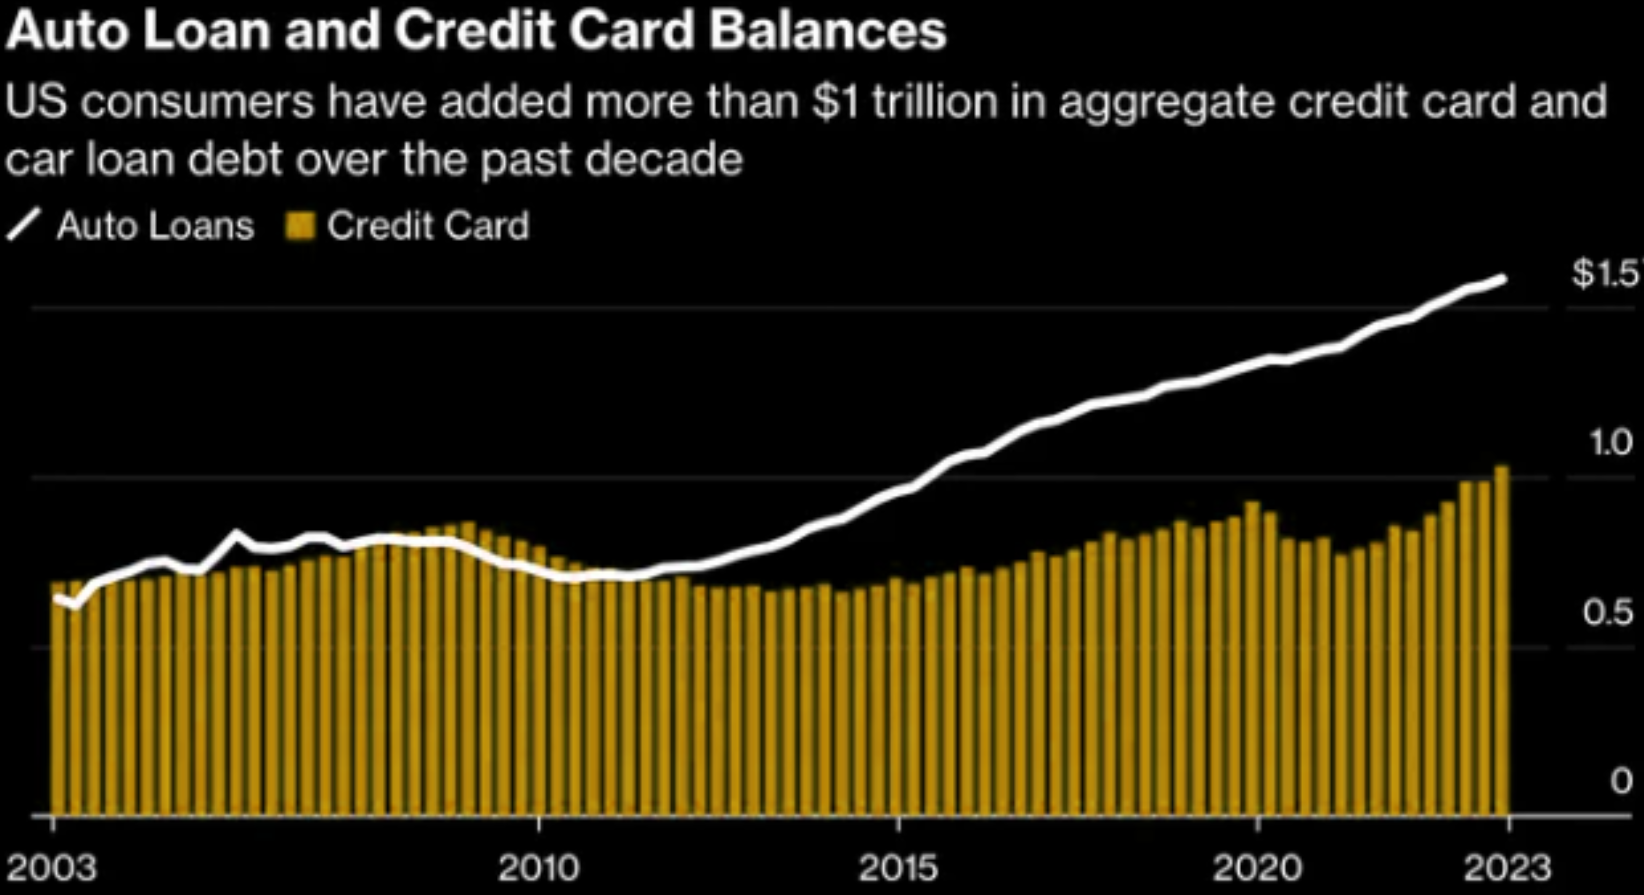
- Auto loan balances surpassed student loan debt for the first time since 2009, reaching $1.58 trillion.
- Total US household debt stands at $17.06 trillion.
CHART RIGHT
-
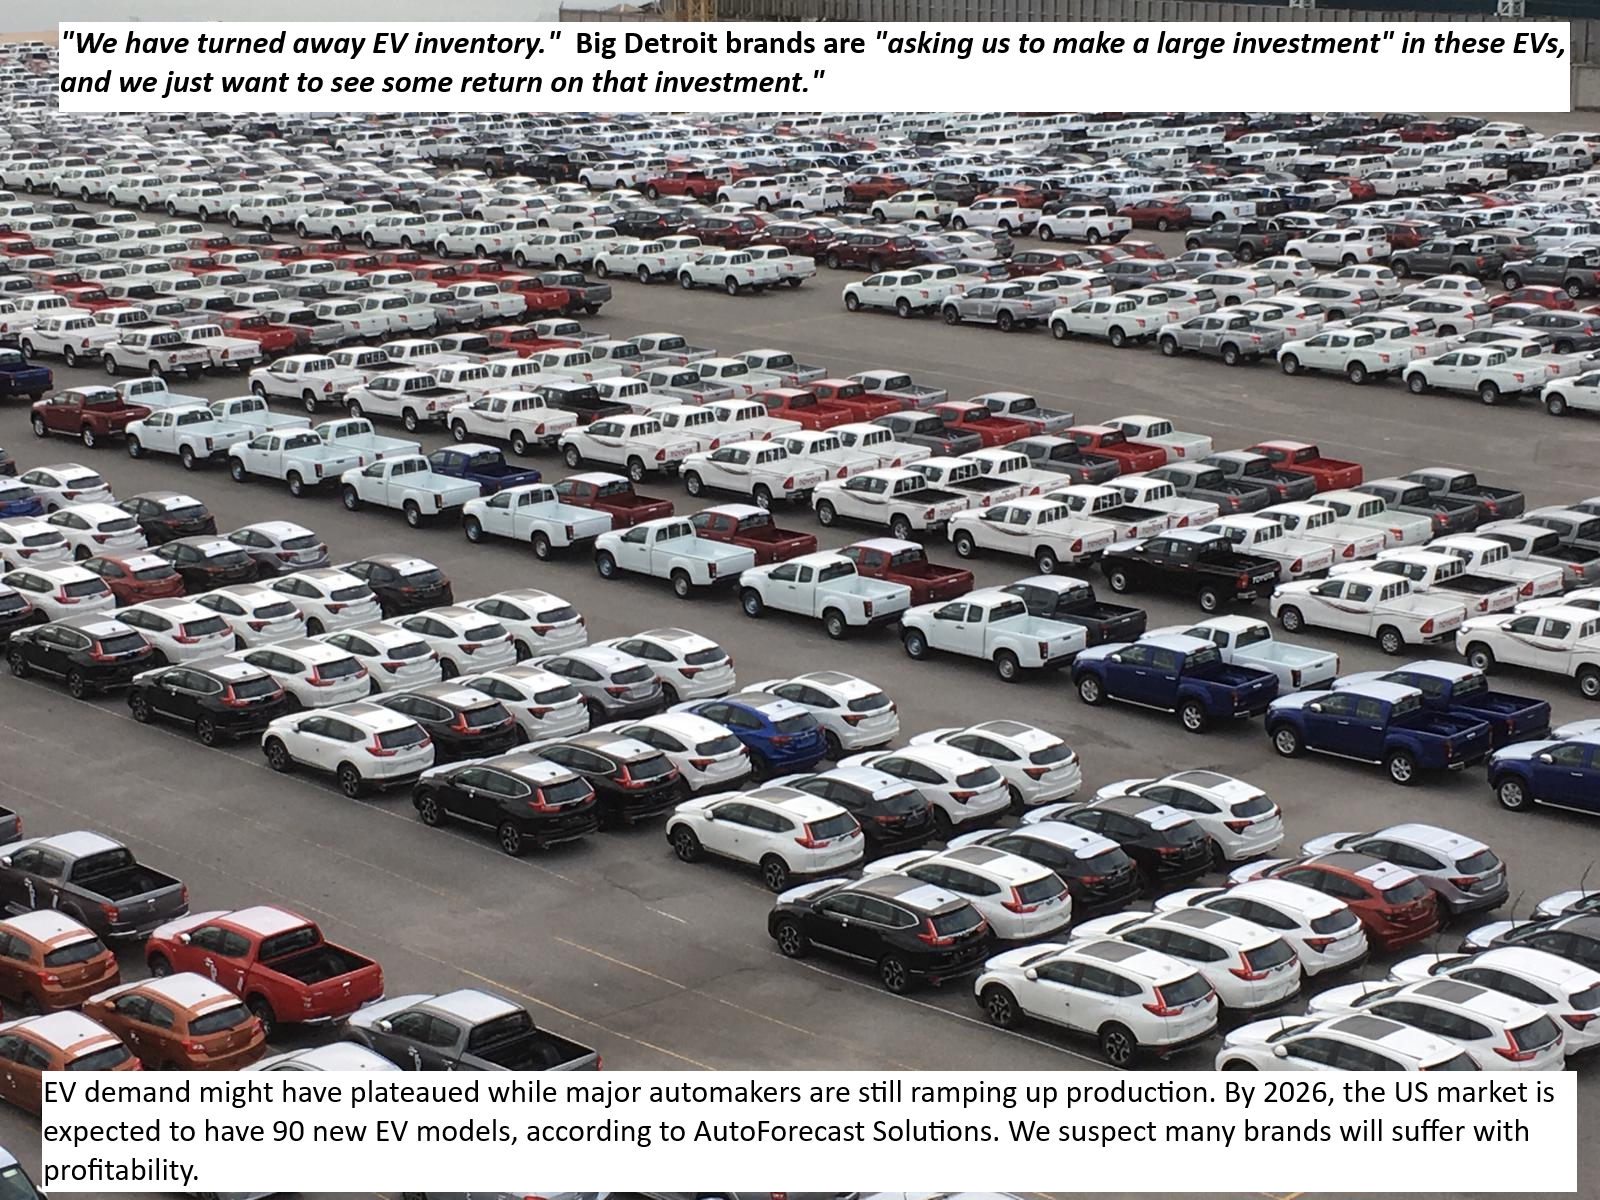
- We have turned away EV inventory.”
- Big Detroit brands are “asking us to make a large investment” in these EVs, and we just want to see some return on that investment.”
- EV demand might have plateaued while major automakers are still ramping up production. By 2026, the US market is expected to have 90 new EV models, according to AutoForecast Solutions. We suspect many brands will suffer with profitability.
IS GOLD ON THE LAUNCH PAD?
GOLD NORMALLY SHINES WHEN EQUITIES STRUGGLE!
Click All Charts to Enlarge
1 – SITUATIONAL ANALYSIS
Remember that old trick in calling a coin flip? You call it with: “Heads I Win, Tails You Lose”. Maybe the Fed is caught by the same sort of double speak?
THE FED CAN’T WIN – GOLD CAN’T LOSE
-
- If price inflation does come back down and there is a recession. The Fed will cut rates. The budget deficits will keep getting larger. The central bank will go back to QE. That’s bullish for gold.
- If inflation comes down with a weak economy that’s bullish for gold.
- If inflation goes up, that’s bullish for gold, as long as the Fed stops fighting it, which eventually they have to do, because if inflation keeps going up, the economy is going to collapse. The Fed can’t keep raising rates. It’s like a game of chicken. At some point, the rate hikes are too much for this overly indebted economy to bear. We are all levered to the max. It can’t happen.
The Fed is in a no-win position and when the Fed can’t win, Gold can’t lose!
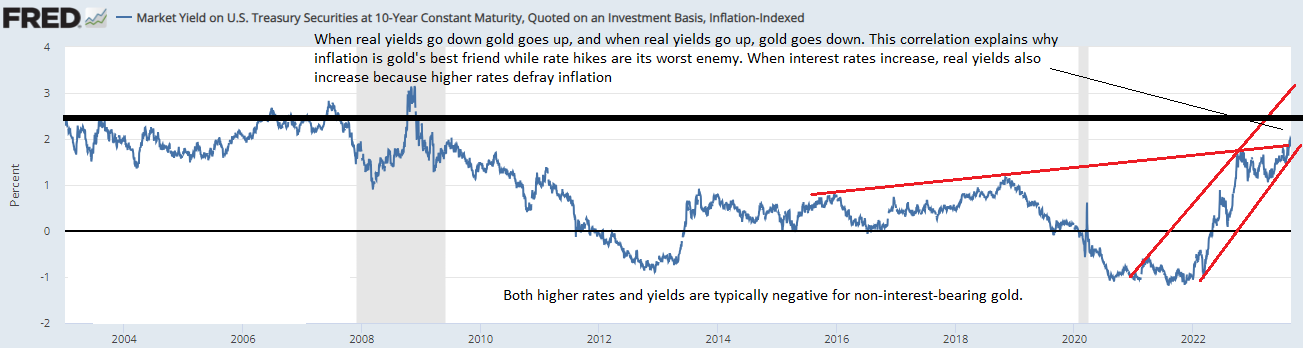
GOLD FALLS WHEN REAL RATES RISE
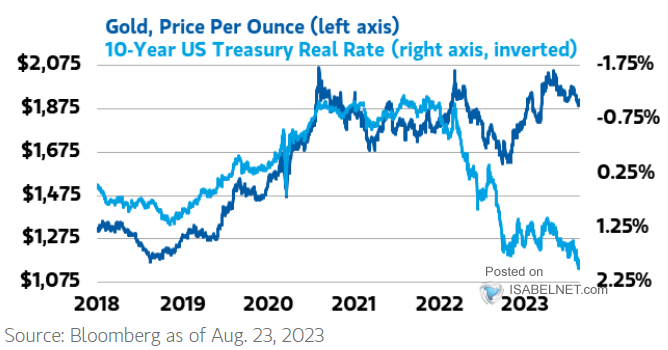 Gold predictably rises when real rates fall and falls when real rates rise. The chart to the right shows ho, since the beginning of the initial market weakness in January 2022, Gold has separated from that relationship. (Note:The 10Y real rate is plotted inversely).
Gold has actually held up quite well for other reasons. Two of those reasons are strong Central Bank Buying along with its perceived value by increasingly wealthier eastern emerging nation populations. Recently, both of these buying groups have shown some relative weakness.
Below we show the Federal Reserve FRED plot for the 10Y Real Rate going back to 2003. The upward trend channel (shown in red) has not yet been violated. Additionally the 10Y Real Rate has broken a longer term red trend line. There is a strong possibility that Real Rates will continue higher than possibly as high as 2.5%.
The question is whether Gold will fall towards a rising real rate or whether real rates will begin to trend lower as the view of a “Soft Landing” begins to possibly erode?
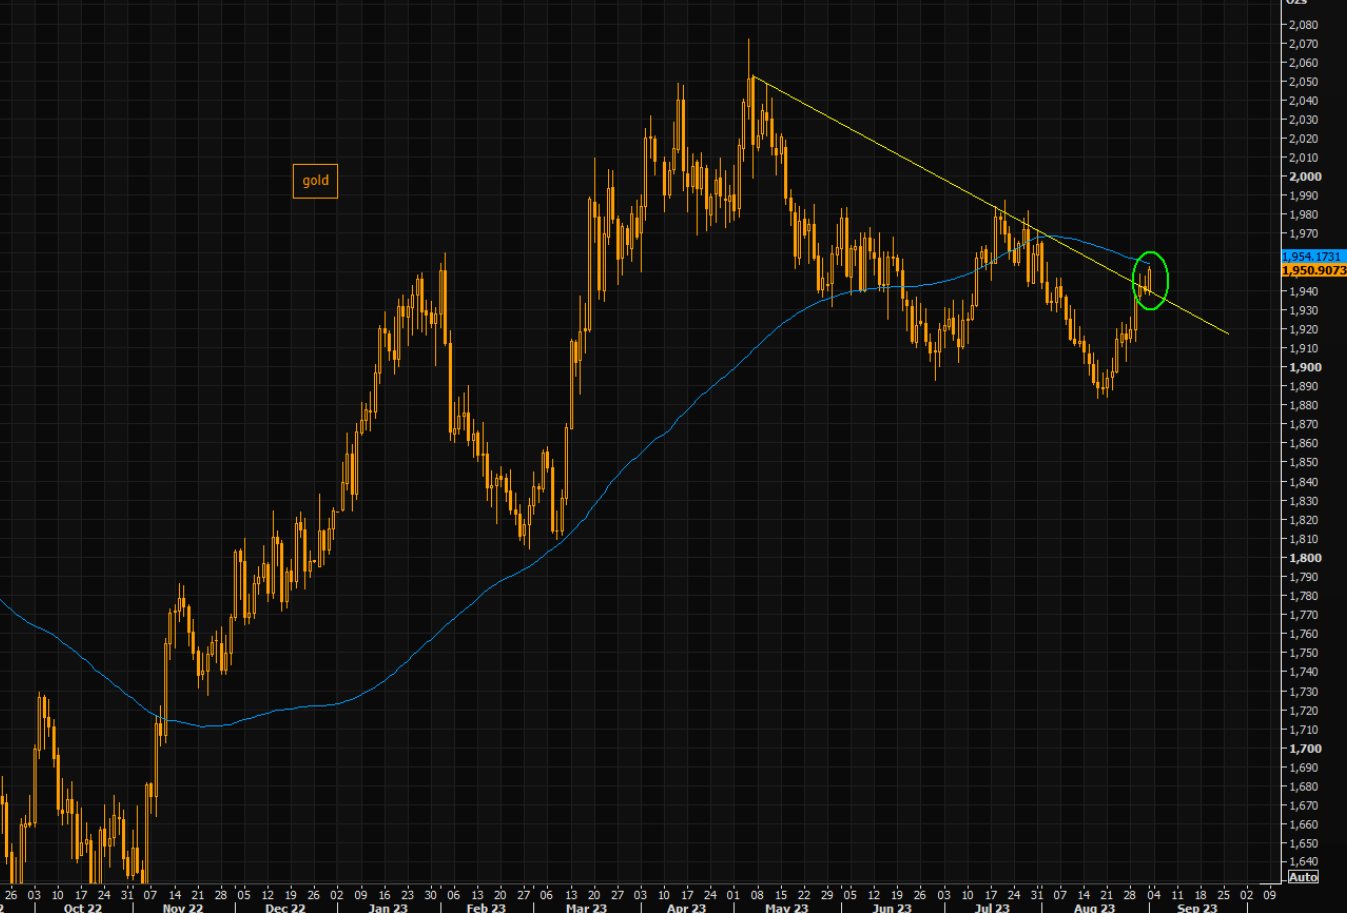
GOLD IS AT A CRITICAL INFLATION POINT
Currently we find that Gold is trying to break above its short term negative trend line and is up against its 100 day moving average, which comes in right around these levels. A close here or higher and prices will squeeze further, however these are relatively big resistance levels that need to be considered.
Gold is clearly at an important inflection point on multiple fronts.
2 – FUNDAMENTAL ANALYSIS
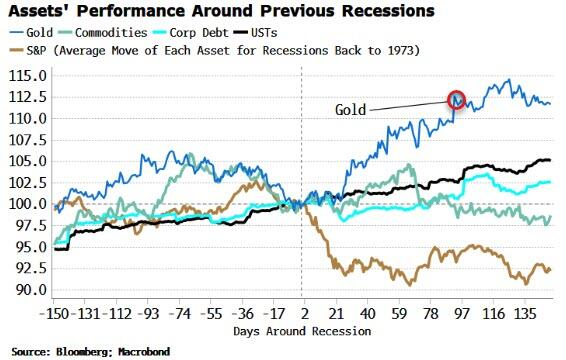 GOLD PERFORMS BEST WHEN EQUITIES STRUGGLE!
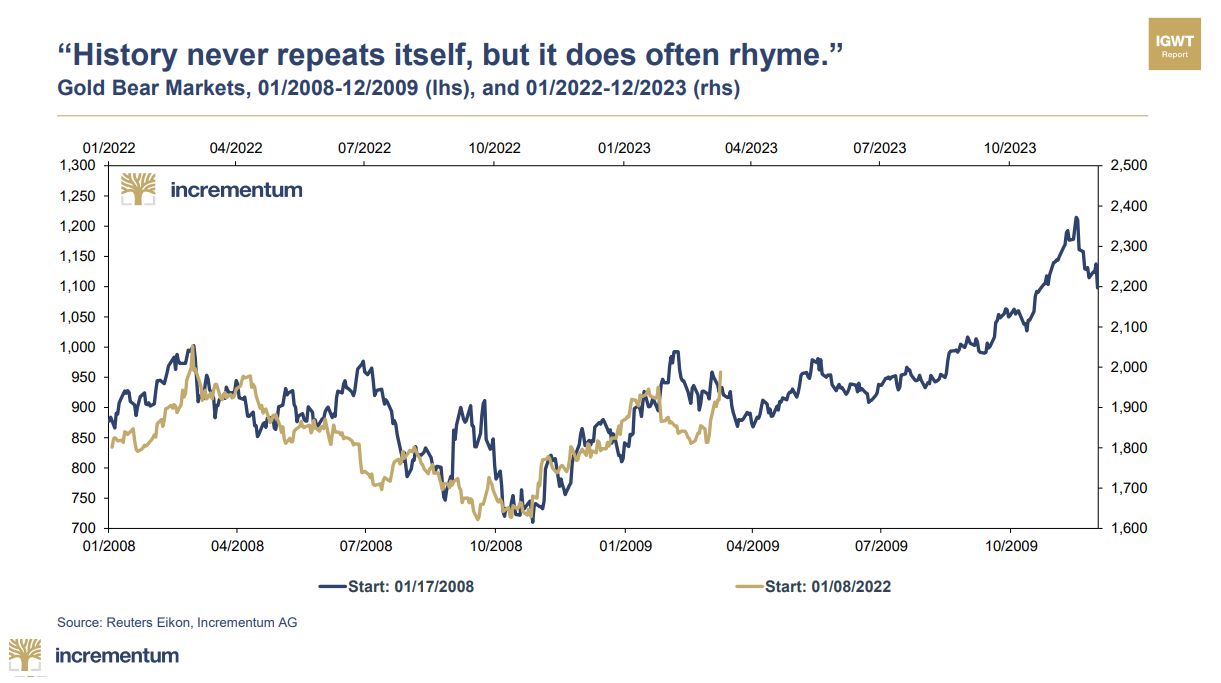
From a bigger picture, history shows us that Gold performs best when equities are struggling. The chart below compares Gold’s performance between the difficult market period between January 2008 and December 2009 against Gold’s performance since the markets topped in January 2022.
If in fact the US enters into a recession, it is highly likely that over-priced equities will weaken. This suggests Gold will continue to follow the pattern to new highs.
3 – TECHNICAL ANALYSIS
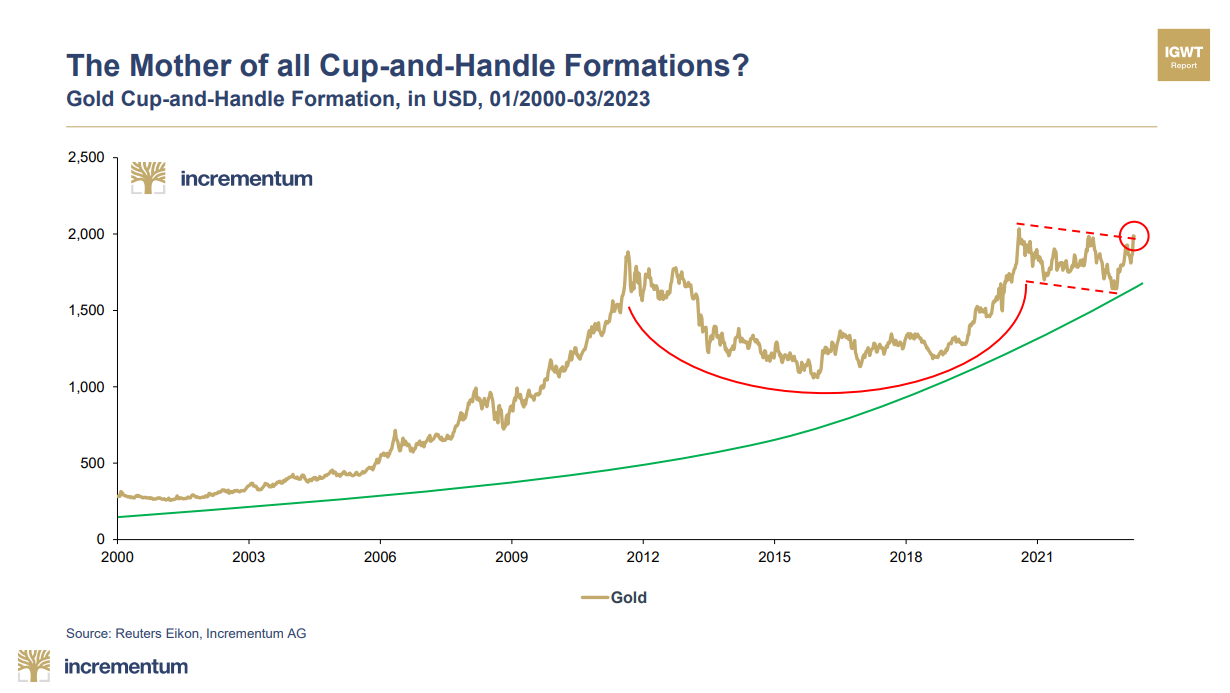
A MAJOR CUP & HANDLE PATTERN FORMATION
From a longer-term technical perspective gold has traced out a classic major Cup-and-Handle formation. At some point gold might be expected to head higher in quite a violent fashion.
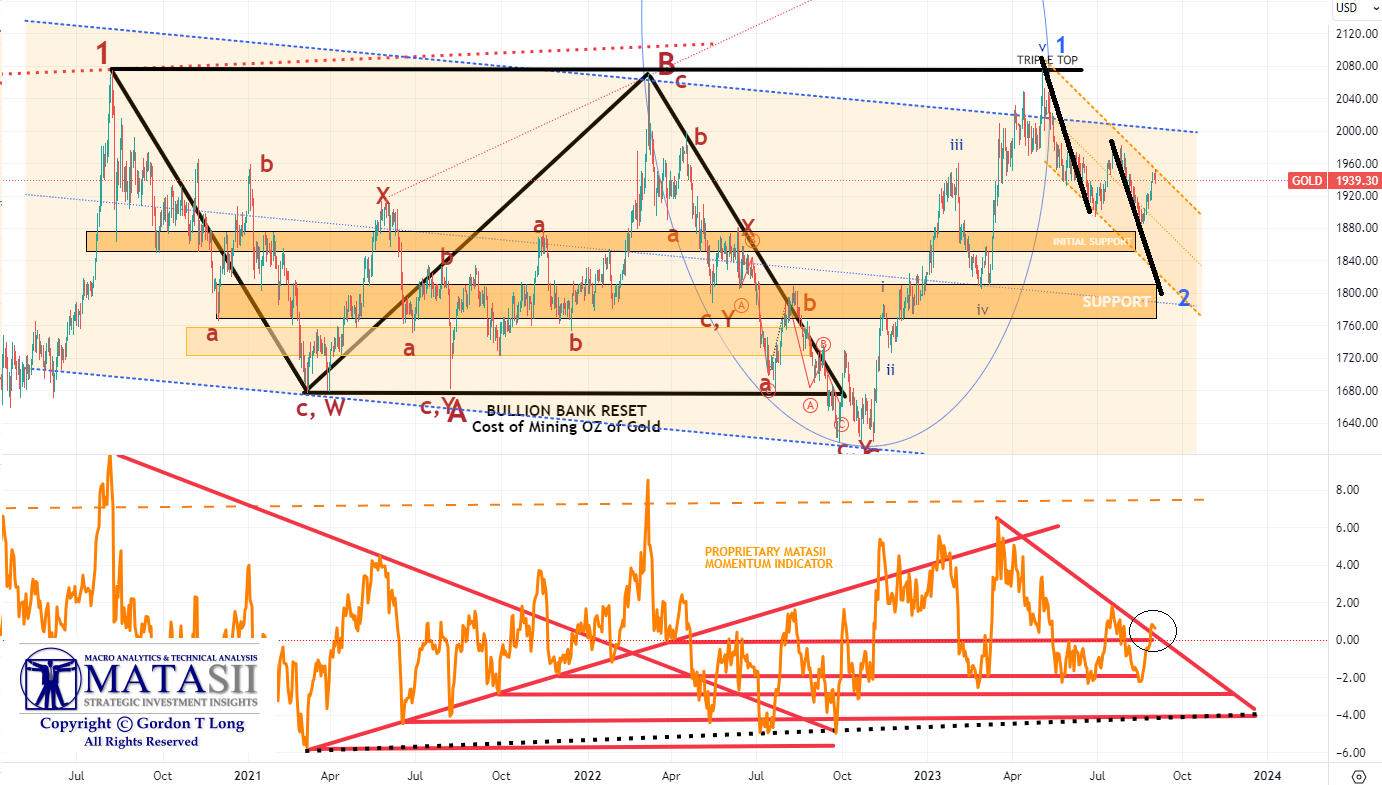
SHORT TERM TECHNICAL CHARTS
As we drill down into the short-term charts for Gold, we see a pretty clear Elliott Wave count set-up of Initial 1-2 Waves, suggesting gold is setting up for a major lift. HOWEVER, before that occurs, there is likely one more leg down to complete a smaller Wave 2 (in black).
YOUR DESK TOP / TABLET / PHONE ANNOTATED CHART
Macro Analytics Chart Above: SUBSCRIBER LINK
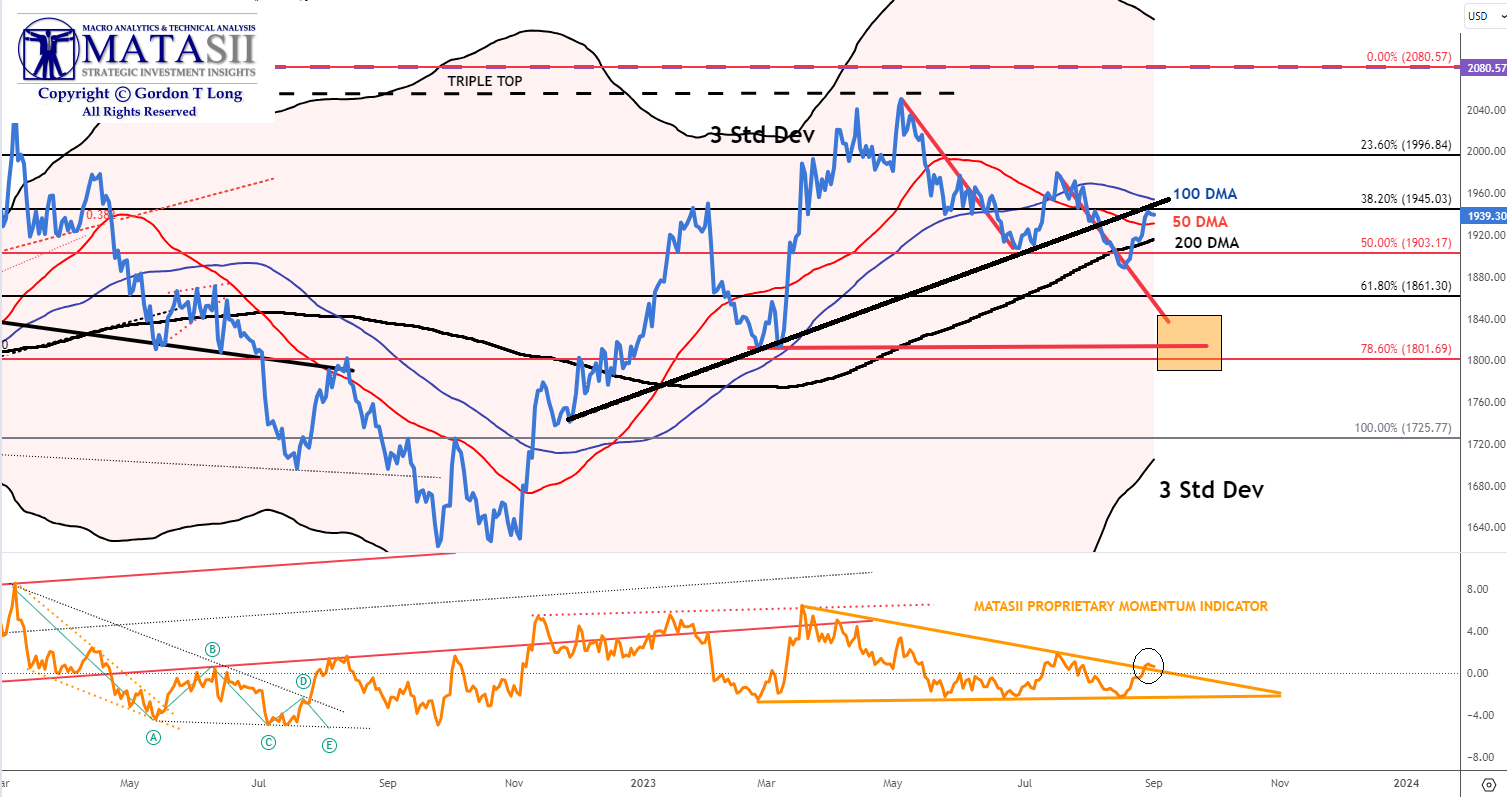
The next chart requiring consideration is the Daily chart with 50/100/200 Daily Moving Averages and the Bomar 3 Standard Deviation Bands.
-
- The 50 DMA (in red) has crossed below the 100 DMA (blue line) in a downward trend. The 100 DMA is currently in a downward trend towards a potential cross of the 200 DMA.
- The 50/100/200 DMAs are tightening their pattern in a typical “Banding” manner. This usually proceeds a major move – up or down.
- A possible corrective ABC (in red) where “A” = “C” projects a logical support area (gold box).
- The 3 Standard Deviation Bomar bands, which gold has been operating with (which are unusual), suggests a likely classic Bollinger Band Cross, which means a potential touch of the rising lower 3 Std Dev Bomar (lower rising black line).
YOUR DESK TOP / TABLET / PHONE ANNOTATED CHART
Macro Analytics Chart Above: SUBSCRIBER LINK
FAIR USE NOTICE This site contains copyrighted material the use of which has not always been specifically authorized by the copyright owner. We are making such material available in our efforts to advance understanding of environmental, political, human rights, economic, democracy, scientific, and social justice issues, etc. We believe this constitutes a ‘fair use’ of any such copyrighted material as provided for in section 107 of the US Copyright Law. In accordance with Title 17 U.S.C. Section 107, the material on this site is distributed without profit to those who have expressed a prior interest in receiving the included information for research and educational purposes. If you wish to use copyrighted material from this site for purposes of your own that go beyond ‘fair use’, you must obtain permission from the copyright owner.
NOTICE Information on these pages contains forward-looking statements that involve risks and uncertainties. Markets and instruments profiled on this page are for informational purposes only and should not in any way come across as a recommendation to buy or sell in these assets. You should do your own thorough research before making any investment decisions. MATASII.com does not in any way guarantee that this information is free from mistakes, errors, or material misstatements. It also does not guarantee that this information is of a timely nature. Investing in Open Markets involves a great deal of risk, including the loss of all or a portion of your investment, as well as emotional distress. All risks, losses and costs associated with investing, including total loss of principal, are your responsibility.