TIPPING POINTS
CONSUMER CONFIDENCE
WHAT WE LEARNED FROM EARNINGS CALLS & LAYOFF ANNOUNCEMENTS
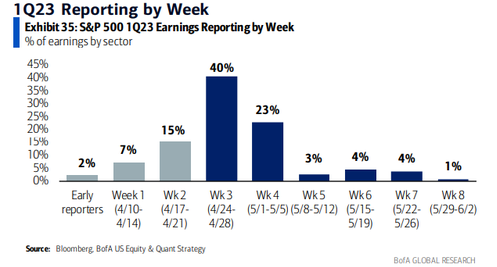
The past week was the third week of “Earnings Season” when 40% of the S&P500 reports with ~64% having reported their Q1 earnings. This is sufficent to draw some conclusions.
The earnings and conference calls have highlighted a number of key messages centered around:
i- Foreward Earnings Outlooks,
ii- Employment Pressures and
iii- Layoff Expectations which we highlight in this newsletter.
Our observations are:
-
- Companies are predominately losing the fight to Inflation, since they are finding they can’t pass along costs to their financially strapped customers who are increasingly substituting for less expensive alternatives and away from established brands. Customers behaviour is reacting to inflation.
- Forced Corporate layoffs are cutting into structural “bone” versus removing “fat” in order to maintain cashflows in an increasingly tightening credit environment.
- Higher earners are now dramatically & shockingly altering traditional initial jobless claims.
- There is a clear sense in conferrence calls of lost confidence in the US economy and economic leadership.
- Many sectors are now being forced to rely on next gen AI to be the primary answer for falling productivity, rising labor costs, shortage of skilled labor and critical overall cost reductions for their survival.
- Years of stocks buybacks and high diividend payouts that sacrificed CAPEX have left a “shallow well” of new revenue products.
- Earnings outlooks, Employment pressures and potential Layoffs generally dominated conference calls.
=========
WHAT YOU NEED TO KNOW
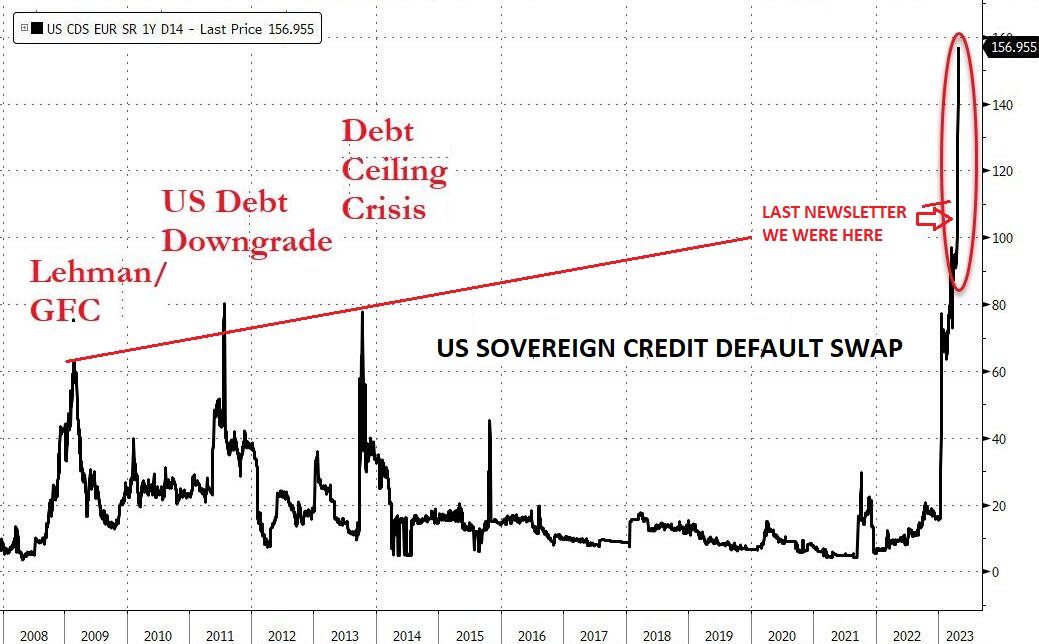 US SOVEREIGN CREDIT DEFAULT SWAPS: Exploding to Unprecedented Levels!
In the last newsletter I pointed out the level of US Sovereign Credit Default Swap prices (see red arrow – right). Since then they have exploded even further. There is a huge problem somewhere and it is so serious that no one is talking. What could it be? Our speculation is that a major global corporate player is in serious trouble and the powers to be have no idea how to handle it. As full disclosure, we are personally digging into the global leading provider of Investment, Advisory & Risk Management Solutions – BlackRock Inc! We sense that ESG has blown up in their face as well as their Risk Management solutions. We don’t know, but we are digging!
WHAT WE ARE LEARNING ABOUT EARNING OUTLOOKS: “The Bar Was Very Low Coming Into Earnings Season!”
-
- BANKS: Major US Banks Overall Had a Solid Quarter – Small Banks “Not so lucky”!!
- LENDERS: Expecting Material Worsening of Labor Market (Capital One planning for 5% Unemployment).
- CRE: Major Player Vorando Delays Dividends and Shocks A Fragile Market.
- ZOMBIES: Out of Time & Options As “Distress Exchanges” Proving Insufficient!
- BIG EIGHT MARKET CAPS: Looking To Nex Gen Artifical Intelligence (X.AI, GPT-4, TruthGPT)I For Growth.
- SMALL BUSINESS: Fed Regional Surveys Receiving Brunt of the Feedback – “Inflation Is Killing My Business!”
- SHIPPING & PACKAGING: Economy Has Stalled On All Fronts – Trucking, Rail, Shipping and Short Delivery!
EMPLOYMENT NEWS: White Collar Workers Over $200K feeling the Heat!
-
- When we look at the Census’ Household Pulse Survey from March 29 to April 10 and compare it to a week around the same time in 2022, the number of UI claims by Americans making more than $200,000 moved up by some 500%. During roughly the same period last year, 18,100 Americans at this salary level had applied for initial UI. Now that number has climbed to 113,800.
- However, it isn’t just employees over $200K, but all segements with higher than average earnings are seeing .noticeable and hsitoric growth in Unemployment Claims compared to this same period a year ago.
- As we have previously noted in prior newsletters, this time around corporations are now cutting the “bone”, not the “fat”!
LAYOFFS: A Steady Increasing Stream
-
- Even non-Industrial and Financial Corporations are announcing major layoffs due to Inflation pressures, which they can not pass on to financially strapped consumers.
- EXAMPLE: Tyson Foods announced the company will cut 15% of its senior leadership — mostly senior vice president and vice president roles — and 10% of its corporate jobs. The company claims it is struggling with increased costs related to fuel, labor and feed, along with lower profits as consumers shift their buying due to inflation.
CONCLUSION
THE BIG WEEK FOR EARNINGS – RECAP
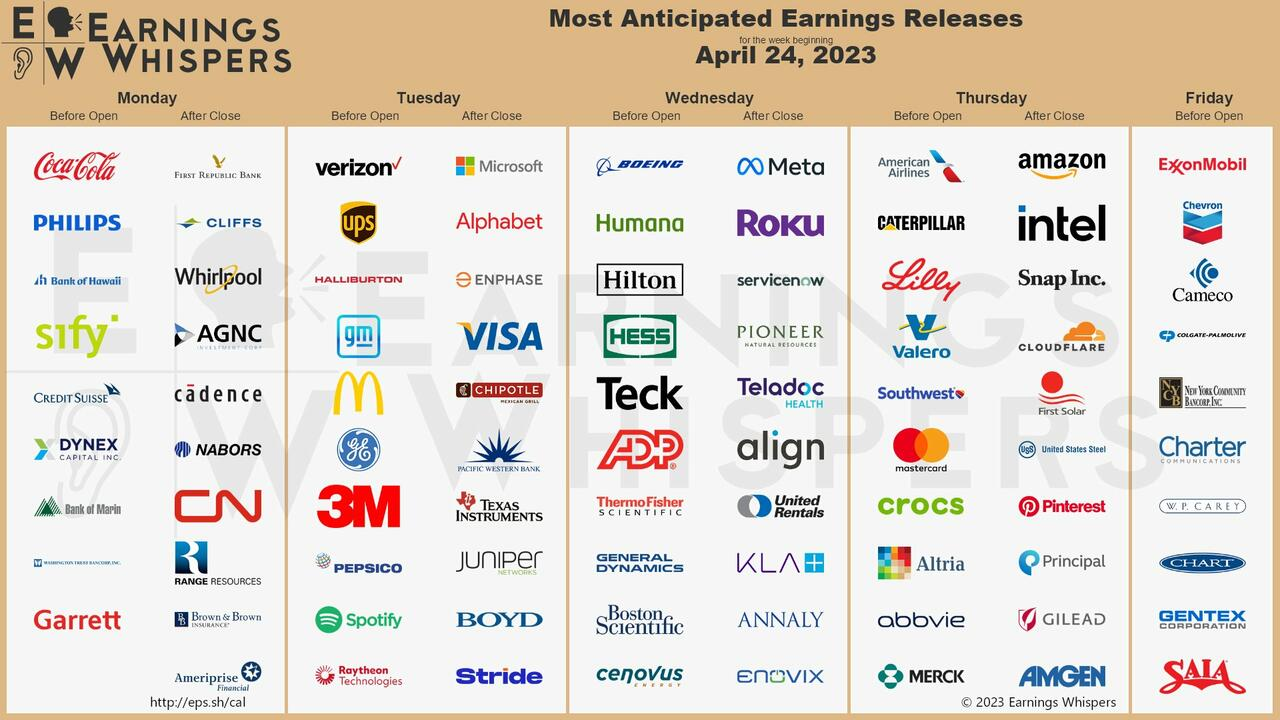 Earnings:
-
- If -3.7% is the actual decline for the quarter, it will mark the second straight quarter in which the index has reported a decrease in earnings.
Revenue:
-
- If 2.9% is the actual growth rate for the quarter, it will mark the lowest revenue growth rate reported by the index since Q3 2020 (-1.1%).
- For Q2 2023, analysts are projecting an earnings decline of -5.0%.
- For Q3 2023 and Q4 2023, analysts are projecting earnings growth of 1.7% and 8.8%, respectively.
- For all of CY 2023, analysts predict earnings growth of 1.2%.
Valuations:
-
- The forward 12-month P/E ratio is 18.1, which is below the 5-year average (18.5), but above the 10-year average (17.3). It is also equal to the forward P/E ratio of 18.1 recorded at the end of the first quarter (March 31).
Actual Earnings & Growth on Both a Sequential Monthly & Annual Basis Continues to Decline
Expect these Declines to Accelerate As The Recession Arrives
In this week’s expanded “Current Market Perspectives”, we focus on the structural reasons for an increase in Gold portfolios for the Longer Term investors. The Near to Intermediate Term is likely to see a consolidation to lower support levels.
=========
WHAT WE ARE LEARNING ABOUT EARNING OUTLOOKS – The Bar Was Very Low
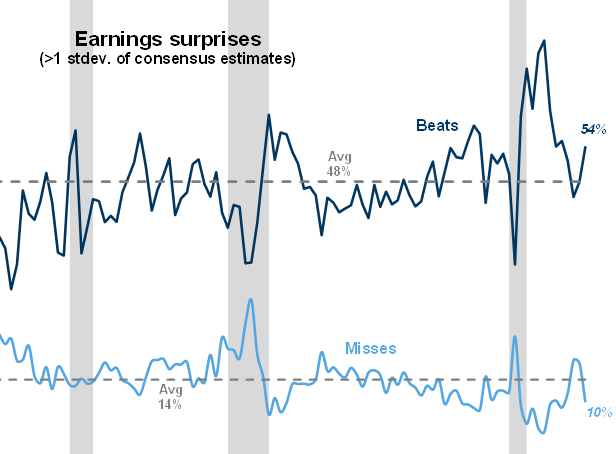 Consensus expectations were for EPS to fall by 7% year/year, the largest decline since 3Q 2020 and a significant deterioration from the -1% year/year growth posted in 4Q 2022.
This is not playing out and as a result the market is hanging tough.
So far earnings have been much better than feared with 54% of companies beating consensus estimates by at least 1SD (vs historical avg of 48%). Only 10% of companies have missed consensus estimates by at least 1SD (vs historical avg of 14%).
As Goldman notes – “The bar was very low coming into this earnings period”.
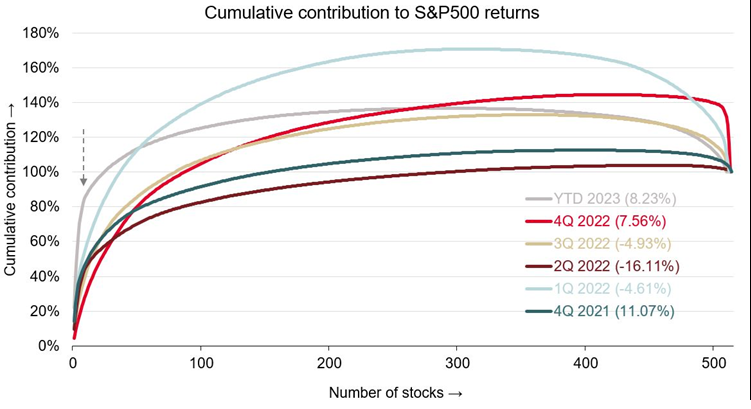
CHART BELOW:
The top 10 stocks are responsible for 86% of the overall index return YTD.
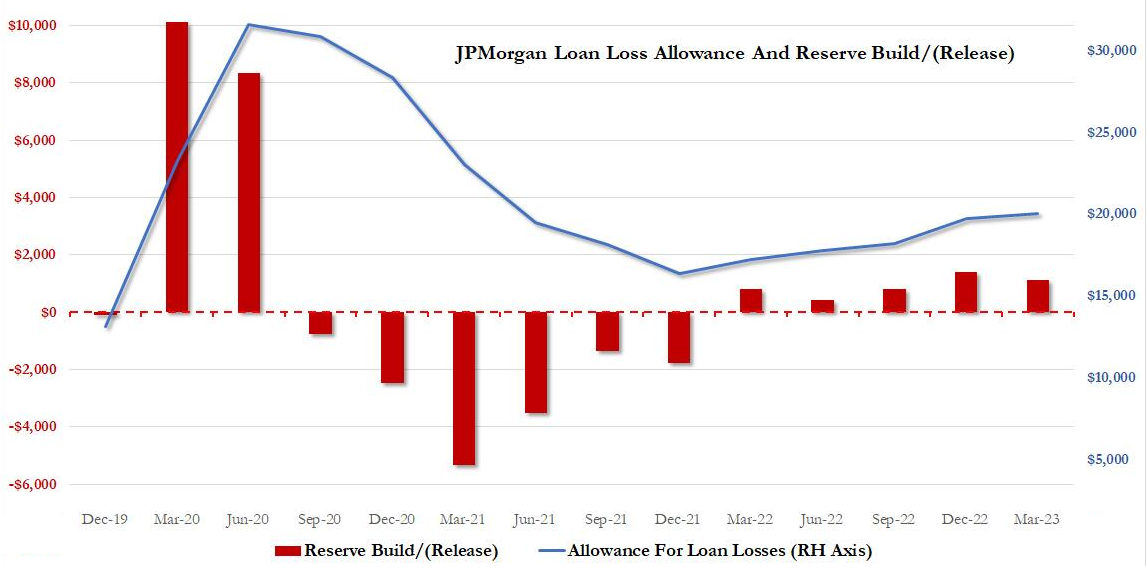 BANKS: Major US Banks Overall Had a Solid Quarter!
JP MORGAN: JPM’s credit loss provisions were $2.28BN, up 56% Y/Y, deposits dropped 8% Y/Y while loans were $1.13BN, up 6.6% Y/Y and flat Q/Q.
BANK OF AMERICA: BoA reserved a $931 million provision for credit losses vs. $30 million y/y. In total, net reserve build of $360 million, driven primarily by higher-than-expected credit card balances.
GOLDMAN SACHS: Net revenue $12.22 billion, missing estimate $12.8 billion, and down 5% Y/Y. Goldman also offloaded a chunk of its $4 billion Marcus loan book, which led to a $440 million reserve release. Earnings were down 19% from a year earlier.
MORGAN STANLEY: Took a provision for credit losses of $234 million, more than double the estimated $99.1 million, and more than quadrupling the $57 in Q1 ’22. Increases in provisions for credit losses were primarily related to commercial real estate and deterioration in the macroeconomic outlook from a year ago.
EUROPEAN BANKS
BARCLAYS: Barclays shares rise as much as 5.1% in early trading after the UK lender’s investment banking arm drove a first-quarter profit beat, which however was partially offset by a miss for costs. Barclays beat estimates as its trading helped offset a drop in dealmaking. Fixed income sales unexpectedly rose 9%, outweighing a slump in equities.
DEUTCHE BANK: The German firm posted its strongest top line since 2016, as a 35% jump in revenue as the corporate bank more than offset a 17% slide in fixed income trading. It laid out plans to cut about 800 senior back-office staff. DWS signaled recovery, with net inflows of €5.7 billion.
UNICREDIT: Will exercise the option to redeem an AT1 bond early in the first major test for such calls since the wipeout of $17.3 billion of Credit Suisse notes. It’ll repay the €1.25 billion note at face value June 3. Its price jumped 1.8 cents to around 100.2 cents on the euro, based on data compiled by Bloomberg. There’s been doubt over whether banks would follow convention and exercise AT1 calls, as the cost of issuing replacement bonds jumped after the writedown.
CREDIT SUISSE: Experienced net asset outflows of CHF 61.2bln during Q1, but reported 12.43bln profit thanks to the write-off of 15bln of AT1 bonds. UBS’ acquisition of Credit Suisse is expected to be finalized by the end of the year.
BANKS IN TROUBLE
FIRST REPUBLIC: Hit record lows; earnings missed on revenue and deposits, with the latter plunging 40% Y/Y and 1.7% Q/Q. Moreover, it is cutting its workforce by 20-25% in Q2 and withdrew all previous financial guidance. Later in the session, Bloomberg reported the bank is mulling up to USD 100bln in asset sales, after noting in its earnings it is pursuing strategic options. However, Financial Times (FT) later reported the bank is struggling to come up with a viable solution, such as a sale of all or part of the bank, after announcing it is pursuing strategic operations. The lender was reportedly in touch with the US government, while leading options are for some of the large US banks that recently deposited USD 30bln into it to rescue FRC. The White House, Fed, and US Treasury reportedly held talks with the bank in recent days, but the Government is apparently not concerned about contagion beyond FRC. FT added that First Republic has been hunting for buyers for parts of its business for weeks but is struggling to garner attraction, with potential acquirers citing concerns on taking on too much risk, the sources added. PE firms reportedly expressed an interest in acquiring some assets, but the government is wary about the optics of buyout firms benefiting from recent banking turmoil. FBN’s Gasparino later added that bankers working with FRC say they expect an eventual government receivership of the bank, as other solutions are appearing difficult. Officials at the banks also told him they believed regulators were poised to take over FRC last week ahead of earnings.
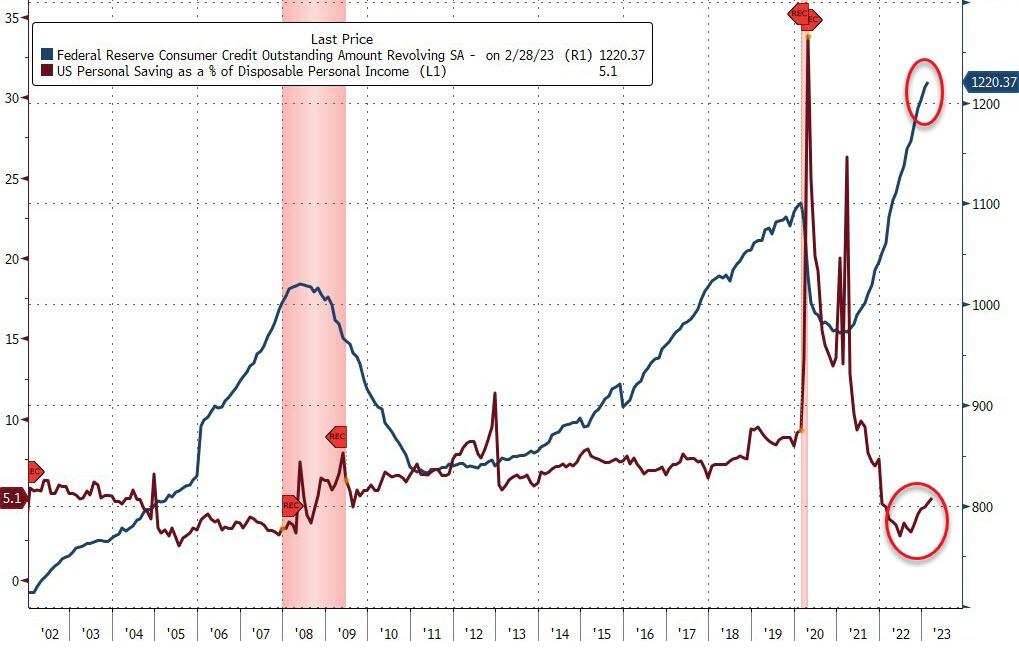 LENDERS: Expecting Material Worsening of Labour Market (5% Unemployment)
MASTERCARD: Beat on EPS, revenue, and purchase volumes, but cut FY revenue growth view. In other news, MA said DoJ is probing debt practices, according to Bloomberg.
VISA: Topped on EPS and revenue, with payment volumes also impressing.
CAPITAL ONE: Missed on EPS and revenue. Executuves noted it built additional balance sheet strength, as it grew retail deposits and maintained or increased strong levels of capital and liquidity.
Capital One also gave some pretty dire macro commentary on the call, saying they are assuming a material worsening of the labor market with the U rate rising to above 5% by year-end, citing a big spike in its delinquency rate, and warning that its credit metrics tend to move a quarter or two ahead of the industry. Capital One CEO Richard Fairbank pulled the plug on the narrative that America’s aggregate spending strength is anything but a mirage of extreme wealth thriving, while a vast majority of Americans are struggling through amid core inflation pain. The delinquency rate for customers at least 30 days late on payment rose 134 basis points from one year earlier to 3.66% – reaching the highest level since March 2019.
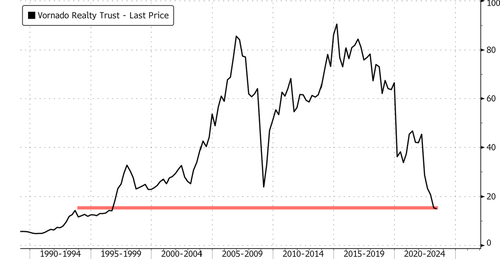 OFFICE CRE: Major Player Vorando Delays Dividends
VORANDO: Vornado Realty Trust, is a major office, retail, and residential building owner, which just hit a 27-year low in price. It is a harbinger of what is now underway in the Office CRE space.
Vornado Realty shares dropped as much as 13% after the owner of offices delayed its dividend and authorized up to $200 million in buybacks, a move which surprised analysts and prompted a downgrade from Piper Sandler.
“We are now approaching the eye of the economic storm, and I expect it will get even worse.”
Vornado Chairman and Chief Executive Officer Steven Roth
Kyle Bass, founder of Dallas-based Hayman Capital Management, explained office buildings in big cities need to be demolished because pre-pandemic demand is never returning. He insisted towers must be converted into apartments.
“It’s one asset class that just has to get redone, and redone meaning demolished”.
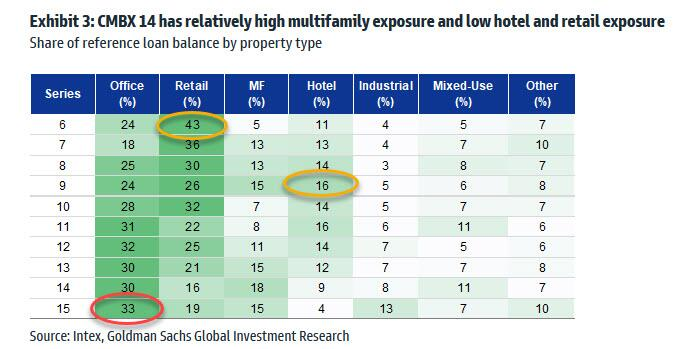
Table of Commercial Real Estate Investment Series types. The BBB- tranche has the heaviest exposure to Office Real Estate
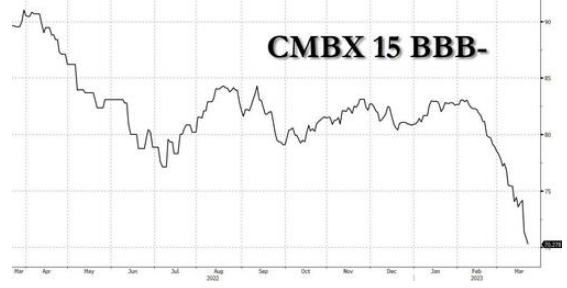
Performance of the BBB- Series 15 Tranche.
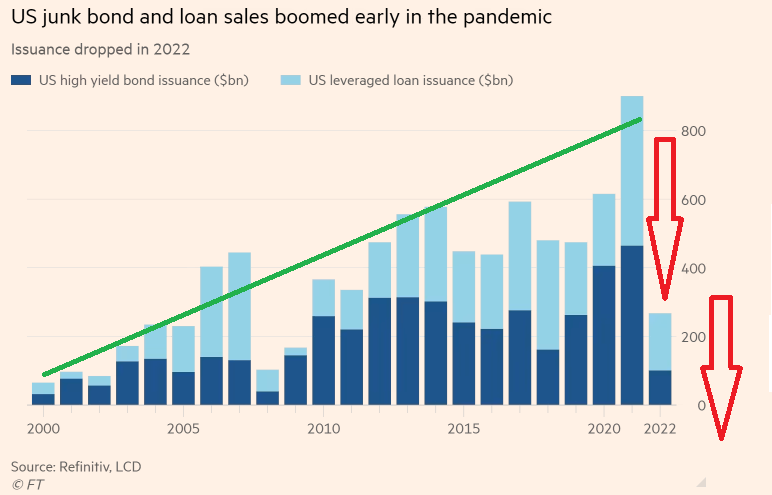 ZOMBIE CORPORATIONS: Out of Time & Options!
Rating agency S&P sees the US junk-grade default rate reaching 4 per cent by December, from a rate of 2.5 per cent in the 12 months to March. Moody’s anticipates a US rate of 5.6 per cent by next March, up sharply from its own figure of 2.7 per cent as of March 31.
In recent years, much of this debt has comprised leveraged loans, instruments sold by “junk” grade businesses, whose coupons move with prevailing interest rates. These were considered attractive when monetary policy was ultra-loose — with issuance roughly doubling to $615bn between 2019 and 2021, as interest rates plunged early in the Covid pandemic — but have lost their appeal as the Federal Reserve embarked on its most aggressive campaign of interest rate rises in decades to tame inflation.
Distressed companies face a combination of rising borrowing costs and a slowing economy. These difficulties, and investor scrutiny of such businesses, are likely to intensify this year against a backdrop of rising recession fears. Distressed corporations have bought time by turning to “Distressed Excahnges”. However, according to Moody’s, almost three-quarters of US corporate debt defaults last year were ‘distressed exchanges’.
THEY ARE NOW OUT OF TIME AND OPTIONS!
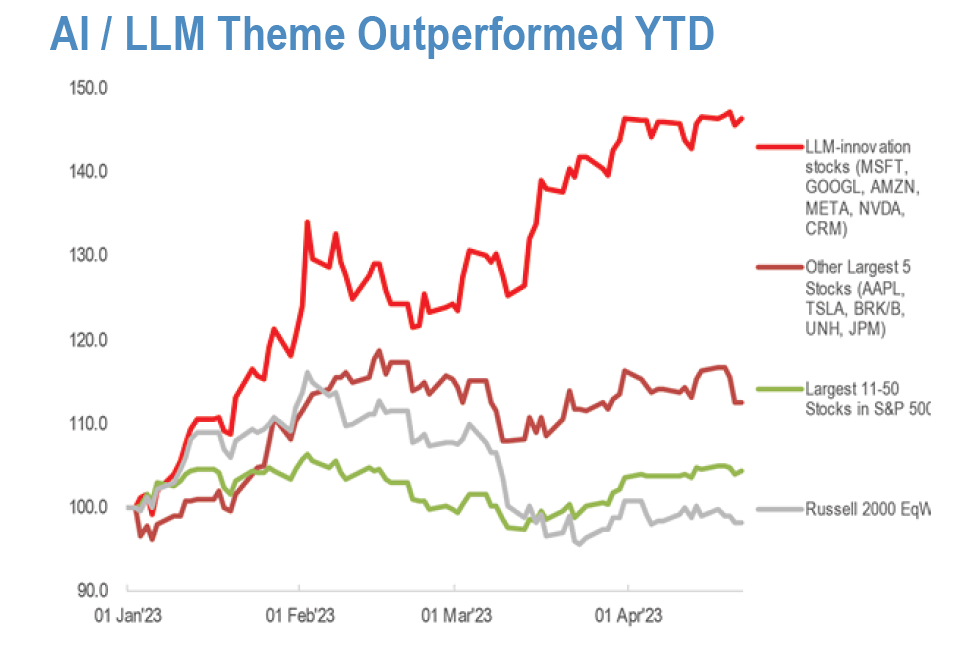 BIG EIGHT MARKET CAPS: Looking To AI For Future Growth
NETFLIX: cut top- and bottom-line guidance for Q2…*NETFLIX SEES 2Q REV. $8.24B, EST. $8.47B, *NETFLIX SEES 2Q EPS $2.84, EST. $3.08, *NETFLIX SEES 2Q PAID NET ADDS `ROUGHLY SIMILAR’ TO 1Q. This has sent the stock plummeting 12% lower after hours…
“Widespread account sharing undermines our ability to invest in and improve Netflix for our paying members, as well as build our business,”
the company said in a statement to investors.
TESLA: Inventory reaches new high, pointing to price cuts not working, according to Electrek. Tesla is readying exports of Model Y from Shanghai to Canada and will be the first time it will ship China-made cars to North America; sees a target of producing 9k Model Y vehicles in Shanghai for export to NA in Q2. Musk also announced Tesla will be raising its 2023 spending forecast to USD 7-9bln from 6-8bln.
GOOGLE: Alphabet’s capital expenditures, came in at $6.3 billion this quarter — 36% lower compared with the same period a year ago. The company reported a $2.6BN charge relating to workforce cuts and office space reductions; specifically, charges of $564 million were related to reductions in office space; the company added that it may see additional charges as it continues to assess its real estate portfolio. The Board of Directors of Alphabet authorized the company to repurchase up to an additional $70.0 billion of its Class A and Class C shares.
MICROSOFT Revenue was $52.9 billion and increased 7%. Diluted earnings per share was $2.45 and increased 10%.
“The world’s most advanced AI models are coming together with the world’s most universal user interface – natural language – to create a new era of computing,” said Satya Nadella, chairman and chief executive officer of Microsoft.
META / FACEBOOK: Costs are undoubtedly in focus for Meta, and they’re narrowing their expected expense range for 2023 to $86-$90 billion. That’s significantly lower than the $96-$101 billion initial projection the company gave in October.
Surprisingly, given the significant layoffs that have been announced, headcount was 77,114 as of March 31, 2023, a decrease of 1% year-over-year. Meta Platforms rose as much as ~12% on Thursday. META noted AI recommendations have increased time spent on Instagram by 24%, and as such helping boost traffic to Facebook and Instagram, and earn more in ad sales, as it forecast next quarterly revenue well above consensus.
AMAZON: Beat on EPS, revenue and AWS, but saw downside on cautious comments in its earnings call where it said AWS April revenue growth slowed from Q1 levels by about 500bps.
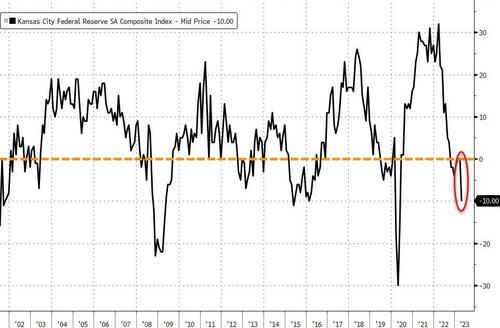 SMALL BUSINESS: Inflation Is Killing My Business!
The cry from small business gets little to no coverge in the media. They are in trouble and scared! The notes from the Fed Regional Surveys speak for themselves!
-
- “Inflation is killing my business – everything is up and hard to get my price increases passed along to customers. Employees are very hard to find.”
-
- “We need an incentive for people to work. We have 10% increases or more in the cost of materials. We have 7% increases in cost of labor when available. We have raised prices 5% – can’t do more. Hard to make money this way.”
-
- “Inflation still a big problem in our little corner of the world. Some commodities are better and some are still a problem. We likely are looking at another round of significant price increases in the short to medium term.”
-
- “We are seeing a little slow down of sales on certain types of consumer products, so have become a little conservative in our production plans for 2023 and the first quarter of 2024.”
-
- “Labor availability is the biggest challenge we are facing.”
-
- “We are seeing some softening in our industry. The size and frequency of new orders from current customers seems lower and new business orders are definitely smaller based on the scale of the new customers’ operations and typical requirements.”
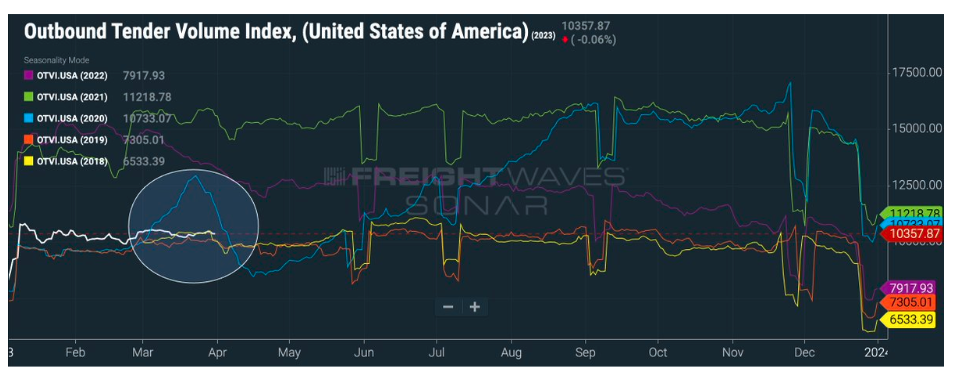 SHIPPING & PACKAGING: Economy Has Stalled!
UPS: Was lower; missed on both profit and revenue.
3M: Surpassed expectations on EPS and revenue, but it is to lower its headcount by 6k. Looking ahead, it affirmed FY guidance, but next quarter outlook was light.
PACKAGING CORP OF AMERICA: Closed lower; missed on top and bottom line, while next quarter profit view was way short of expected, which was accompanied by downbeat commentary from executives.
ANALYSIS: FreightWaves – Overall Sector Assessment
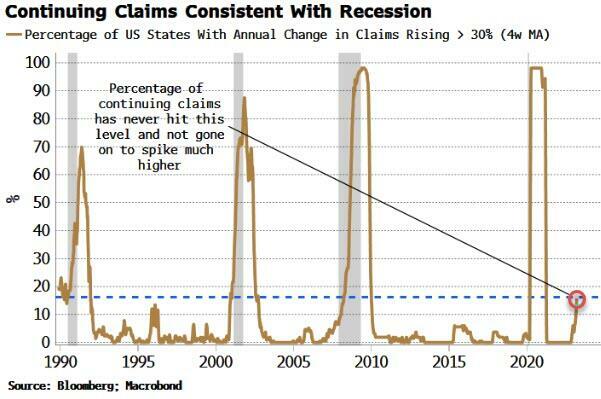 EMPLOYMENT NEWS: White Collar Workers Over $200K feeling the Heat!
JOBLESS CLAIMS:
-
-
- Initial jobless claims in the latest week rose 230k, not as much as the expected 248k and a move back lower from the prior week’s 246k increase.
- Continued claims fell to 1.858mln from 1.861mln, a surprise fall against the consensus rise to 1.878mln.
- The pullback lower in claims shows that the job market is by no means on the cusp of collapse, despite the recent rises off unsustainably low levels.
- Many economists expect claims to continue to rise further from here through the year, but for now, we are still at historically low levels that are consistent with a tight labour market.
-
SURGE IN HIGH INCOME UNEMPLOYMENT CLAIMS
When we look at the Census’ Household Pulse Survey from March 29 to April 10 and compare it to a week around the same time in 2022, the number of UI claims by Americans making more than $200,000 moved up by some 500%. During roughly the same period last year, 18,100 Americans at this salary level had applied for initial UI. Now that number has climbed to 113,800.
The research firm Fundstrat is reporting that the Fed will have more breathing room to allow for easing financial conditions, due to a surge in unemployment claims from high-income workers.
-
- Americans who make more than $200,000 per year have filed for unemployment benefits at a record pace in recent weeks. That could ultimately give employers more leverage over employees and lead to slower wage growth.
- “An estimate of 113,793 unemployment claims were filed by Americans earning over $200,000. This is the highest level since the pandemic and the trend shows this is accelerating higher, with this week likely to be the crossover point where the unemployment claims of over $200,000 earners exceeds unemployment claims of under $25,000 earners,” – Fundstrat
- The surge in unemployment claims for high-income earners comes after a slew of layoffs at mega-cap tech companies in recent months, including Meta, Amazon, and Alphabet, among others.
- “Wage income might be deteriorating faster than is implied by jobless claims alone. That is a big deal in our view. Hence, the composition of jobless claims argues strongly for the Fed to do a ‘dovish’ hike. A +25 basis point [hike] in May and then a ‘let’s look around’ and acknowledge that upside risk/downside risks are far more balanced. And this means Fed would tolerate an easing of financial conditions”. – Fundstrat
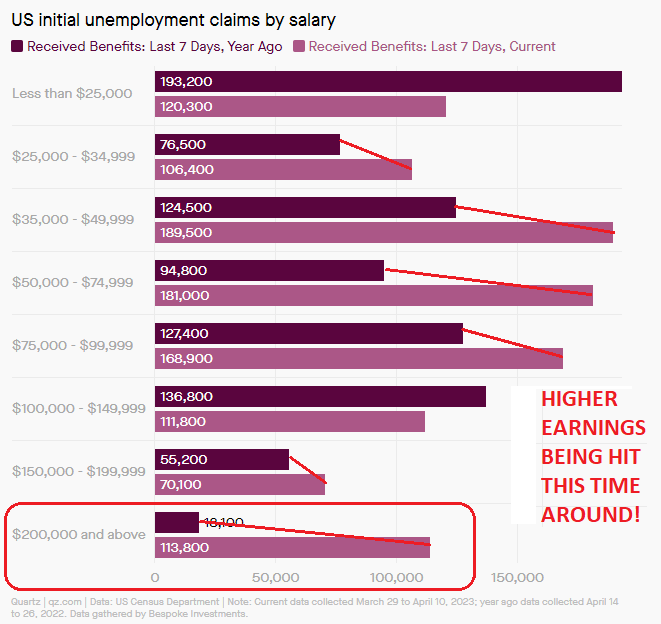
Higher Earners being Laid Off This Time Around!!
LAYOFFS: A Steady, Increasing Stream
The above trend as expected has shown up in earnings announcements, too.
After eliminating about 500 corporate positions last September, the retail chain Gap plans to make even more job cuts on that side of the business, according to a report from the Wall Street Journal.
3M, which has been hit by the decline in electronics sales, plans to lay off 6,000 workers globally, but with a focus on reducing the size of its corporate center.
Amazon’s Whole Foods Market laid off a few hundred corporate employees who made up 0.5% of its entire workforce, according to an executive memo sent to staff this month. The memo noted that the layoffs wouldn’t close any stores or affect any distribution center workers.
Earlier this year, General Motors planned to cut the jobs of salaried workers and executives. After 5,000 buyouts from white-collar workers leaving, however, the company was able to avoid layoffs altogether.
The noticeable weakening at the higher end of the salary scale also reflects the need for companies, like carmakers, to keep meeting consumer demand even as they cut back on expenses.
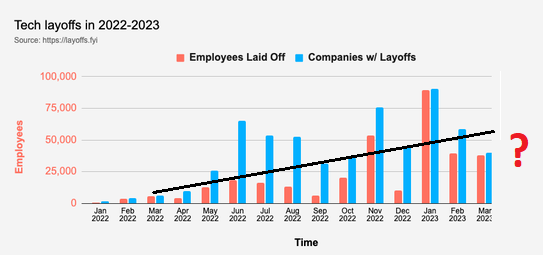
“First Mover” Tech Layoffs may have temporarily slowed, but is likely to resume as the recession unfolds. Other areas are now being hit, but not shown in the chart above which is for Tech Only!
Beginning in October of last year, the tech sector across the Bay Area announced mass layoffs in the tens of thousands. These have included Twitter, Peloton, Lyft, Opendoor, Chime, Stripe, Intel, Microsoft and numerous others. In January, Salesforce cut 10% of its staff, or around 7,000 jobs, in only their latest round after several other cuts last year. Seattle-based Amazon slashed 18,000 jobs, with many coming in Silicon Valley city Sunnyvale, and Google cut 12,000 employees. Then in February, thousands more lost their jobs due to layoffs at former Silicon Valley stars PayPal, NetApp, Yahoo, and Twilio. Last month, another round of job cuts at Meta led to further 10,000 people losing their jobs, while earlier this month Salesforce announced that so many people had been let go that they would be leaving an entire office building. Even usually strong tech sector companies such as Apple, Lyft, and Amazon also made small cuts this month.
ANNOUNCEMENTS
-
- LYFT confirmed it is to cut 26% of employees and estimates it will incur a cost of roughly USD 41-47mln in Q2 2023.
- Bed Bath & Beyond (BBBY) is mulling the sale of assets and IP as part of an expected bankruptcy filing. It is looking to secure funding from Sixth Street Partners to support its operations through Chapter 11 proceedings, but plans could still change.
- Disney: Latest round of job cuts will bring its total reductions to 4k, according to Reuters citing Disney sources – will affect all parts of the co.
- Gap will reportedly c1800 corporate workers in a new round of layoffs, larger than the round of cuts done in September, according to WSJ sources.
- Dropbox announced that 16% of all employees, or around 500 people, will be let go.
- Tyson Foods announced the company will cut 15% of its senior leadership — mostly senior vice president and vice president roles — and 10% of its corporate jobs. The company claims it is struggled with increased costs related to fuel, labor and feed, along with lower profits as consumers shift their buying due to inflation.
- Lazard Ltd announced plans to shrink its workforce by 10% this year, following a decline in dealmaking activity in the first quarter. The first quarter of 2023 was the slowest start to global dealmaking since 2013, as rising interest rates and elevated inflation soured the mood in capital markets. CEO Jacobs expects other investment banks will reduce headcount this year as the dealmaking environment remains muted. Bankers have also been slashing bonuses.
CONCLUSIONS
2023 consensus EPS has been cut 13% since June, tracking weaker than the historical revision trend. Many, like BofA, expect earnings to decelerate further and forecast $200 in EPS (-8% YoY vs. -20% on average in historical recessions). During the prior four recessions (1990, 2001, 2007 and 2020), forward EPS estimates were revised down ~19% on average during recessions vs. just -2% heading into a recession. In other words, the bulk of the EPS forecast pain has already been experienced, since not even the permabears can deny that the US is in a profit recession; the only debate is how deep it will be.
Bloomberg is warning that future earnings are still steadily deteriorating. The S&P 500 is now projected to post four straight quarters of negative earnings growth. The 3Q EPS estimate decayed to a 0.2% contraction as of April 21, compared to 0.2% growth a week before and +4.6% at the start of the year. Estimates for 2Q23, 4Q23 and 1Q24 continue to be revised down — despite the 1Q beats. This implies the market is still cautious about the broader market backdrop.
RESULTS
At the mid-point of the Q1 2023 earnings season, S&P 500 companies are recording their best performance relative to analyst expectations since Q4 2021.
EARNINGS
-
- Both the number of companies reporting positive EPS surprises and the magnitude of these earnings surprises are above their 10-year averages.
- The index is reporting higher earnings for the first quarter relative to the end of last week and relative to the end of the quarter.
- The index is still reporting a year-over-year decline in earnings for the second straight quarter.
- Overall, 53% of the companies in the S&P 500 have reported actual results for Q1 2023 to date. Of these companies, 79% have reported actual EPS above estimates, which is above the 5-year average of 77% and above the 10-year average of 73%.
- In aggregate, companies are reporting earnings that are 6.9% above estimates, which is below the 5-year average of 8.4% but above the 10-year average of 6.4%.
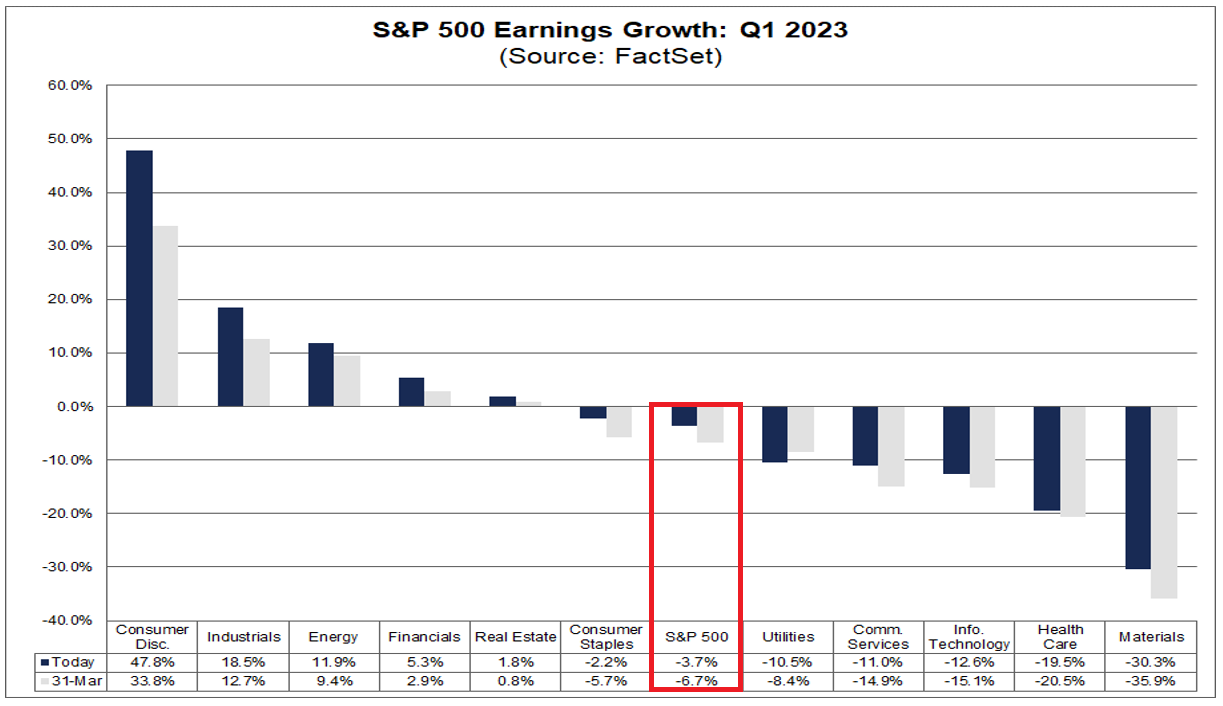
- The blended earnings (combines actual results for companies that have reported and estimated results for companies that have yet to report) decline for the first quarter is -3.7%, compared to an earnings decline of -6.3% last week and an earnings decline of -6.7% at the end of the first quarter (March 31).
- Positive earnings surprises reported by companies in the multiple sectors (led by the Information Technology, Consumer Discretionary, Energy, Industrials, and Communication Services sectors) were the largest contributors to the decrease in the overall earnings decline for the index over the past week.
- Positive earnings surprises reported by companies in multiple sectors (led by the Consumer Discretionary, Information Technology, Financials, Communication Services, and Industrials sectors) have been the largest contributors to the decrease in the overall earnings decline for the index since March 31.
- If -3.7% is the actual decline for the quarter, it will mark the second straight quarter in which the index has reported a decrease in earnings.
- Five of the eleven sectors are reporting year-over-year earnings growth, led by the Consumer Discretionary and Industrials sectors. On the other hand, six sectors are reporting a year-over-year decline in earnings, led by the Materials and Health Care sectors.
REVENUES
-
- In terms of revenues, 74% of S&P 500 companies have reported actual revenues above estimates, which is above the 5-year average of 69% and above the 10-year average of 63%. In aggregate, companies are reporting revenues that are 2.1% above the estimates, which is above the 5-year average of 2.0% and above the 10-year average of 1.3%.
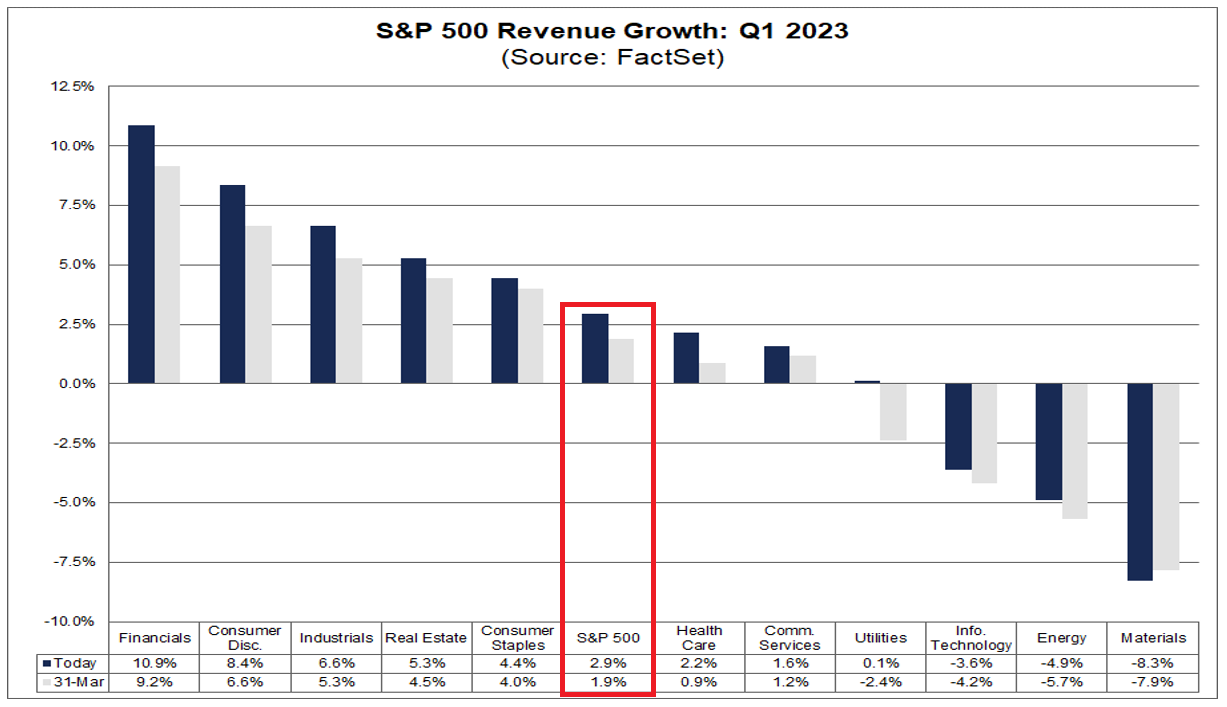
- The index is also reporting higher revenues for the first quarter today relative to the end of last week and relative to the end of the quarter. The blended revenue growth rate for the first quarter is 2.9% today, compared to a revenue growth rate of 2.1% last week and a revenue growth rate of 1.9% at the end of the first quarter (March 31).
- Positive revenue surprises reported by companies in the multiple sectors (led by the Consumer Discretionary, Industrials, Energy, and Health Care sectors) were the largest contributors to the increase in the overall revenue growth rate for the index over the past week. Positive revenue surprises reported by companies in multiple sectors (led by the Health Care, Financials, and Consumer Discretionary sectors) have been the largest contributors to the increase in the overall revenue growth rate for the index since March 31.
- If 2.9% is the actual growth rate for the quarter, it will mark the lowest revenue growth rate reported by the index since Q3 2020 (-1.1%).
- Eight sectors are reporting year-over-year growth in revenues, led by the Financials and Consumer Discretionary sectors. On the other hand, three sectors are reporting a year-over-year decline in revenues, led by the Materials sector.
- Looking ahead, analysts still expect earnings growth for the second half of 2023. For Q2 2023, analysts are projecting an earnings decline of -5.0%.
- For Q3 2023 and Q4 2023, analysts are projecting earnings growth of 1.7% and 8.8%, respectively.
- For all of CY 2023, analysts predict earnings growth of 1.2%.
- The forward 12-month P/E ratio is 18.1, which is below the 5-year average (18.5) but above the 10-year average (17.3). It is also equal to the forward P/E ratio of 18.1 recorded at the end of the first quarter (March 31).
- During the upcoming week, 162 S&P 500 companies (including one Dow 30 component) are scheduled to report results for the first quarter.
THE CASE FOR NOW INCREASING YOUR GOLD ALLOCATION
THREE CHARTS
I have attached three charts to the right that illustrate two points:
1-That the Gobal Central Banks see & know something fundamental and longer term has changed.
2- What the approaching Recession & Dollar concerns mean relative to gold.
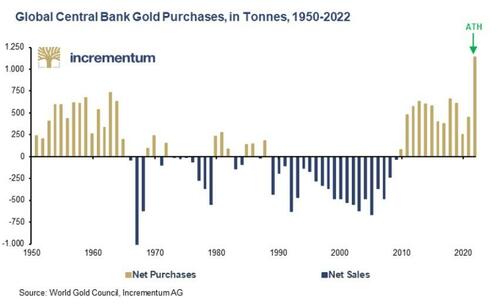
1- GLOBAL CENTRAL BANK GOLD PURCHASES
Global Central Banks have been aggressively accummulationg Gold Bullion, since Covid-19 prompted massive expansion of the global money supply by them (all currencies).
Authored by Ronni Stoeferle via GoldSwitzerland.com,
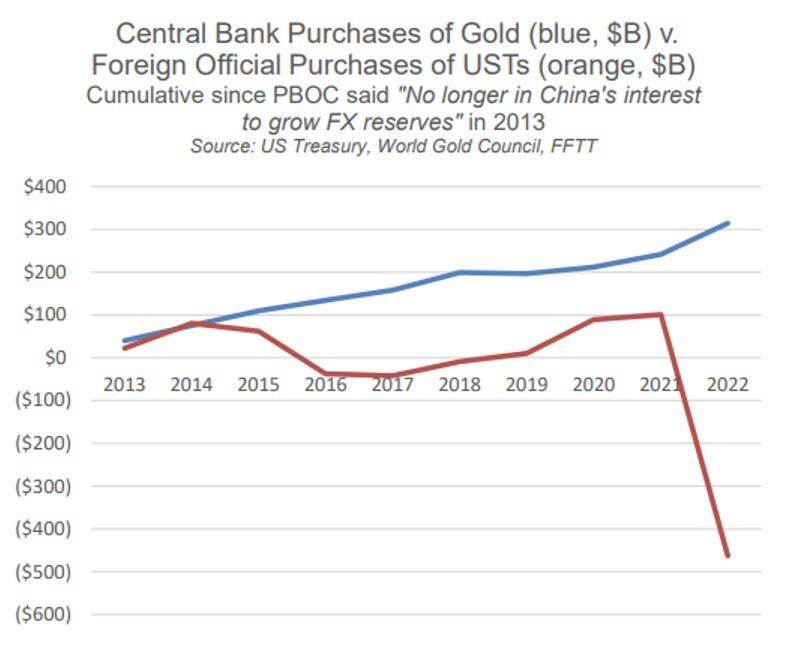
2- OFFICIAL GOLD v US TREASURY PURCHASES
Overall foreign official purchases of US Treasury bonds to hold their FX Reserves has been plummetting, while global central bank purchases of gold (in blue) has been significantly rising.
Authored by Matthew Piepenburg via GoldSwitzerland.com,
3- GOLD v US DOLLAR PRICES
As a positive investment theme, we can see that the US Deficit is about to widen significantly.
The last time the deficit reversed from a narrowing trend and began a major widening trend, back in the early-2000’s, it coincided with a major top in the dollar index, which evolved into a major bear market for the greenback (inverted in the chart I am showing here), lasting roughly a decade.
This was one of the primary catalysts for a major bull market in the price of gold which rose from a low of $250 in 2001 to a high of nearly $2,000 a decade later.

Authored by Jesse Felder via TheFelderReport.com,
DOUBLE CHARTS BELOW
DOLLAR PRESSURES LONGER TERM
The preponderance of economic analytic work that we have examined suggests further US Weakness going forward. However, if the unfolding global slowdown causes major financial disruptions, a dollar flight to safety can be expected, despite the current media onslaught of negative US dollar news!
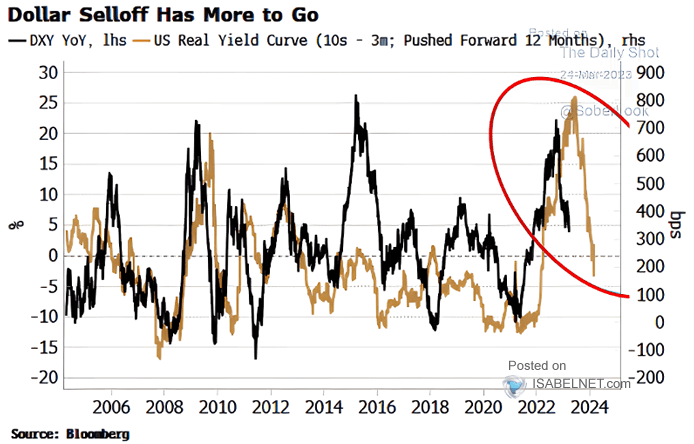
DXY v US REAL YIELD CURVE (10Y-3M):
The US Real Yield Curve as represented by the 10Y-3Mo is suggesting further dollar weakness still ahead!
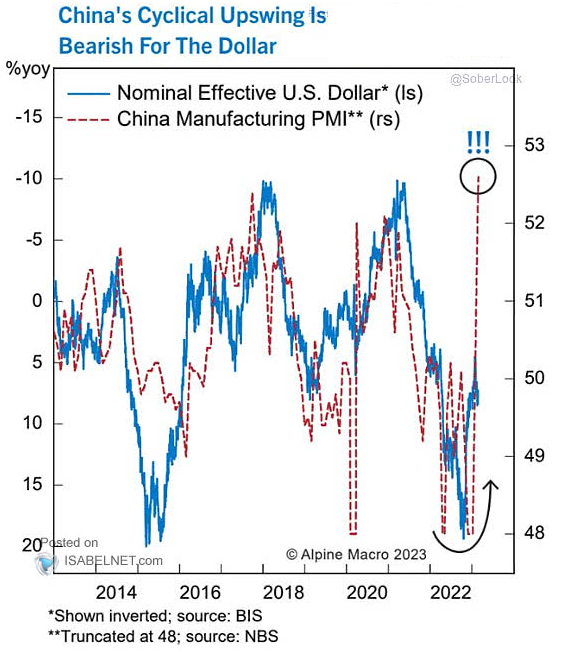
Nominal Effective US Dollar v China’s Manufacturing PMI:
A Bearish Signal
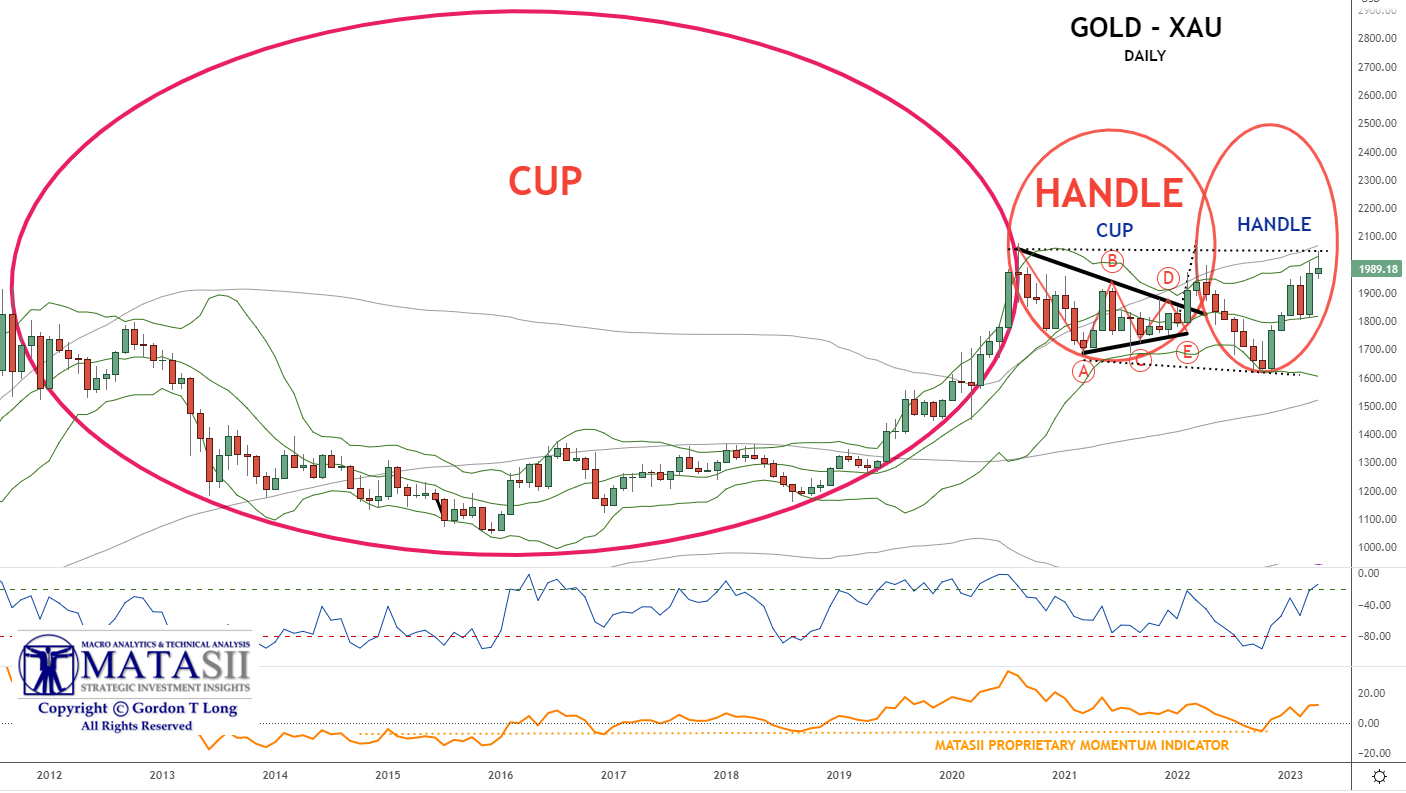
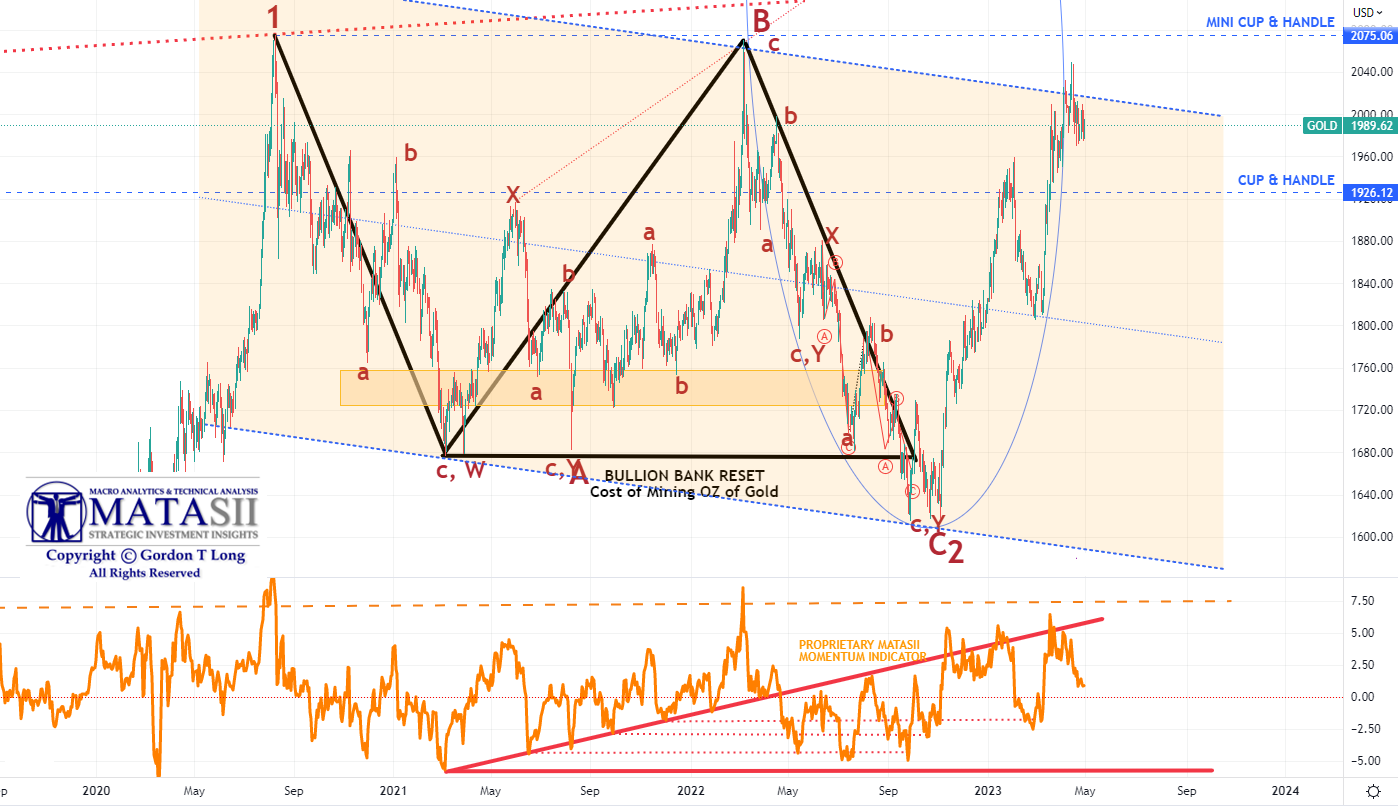
GOLD – CUP & HANDLES – INTERMEDIATE TO LONGER TERM
We been using this chart quite effectively since the initial completion of the large “CUP” completed during Covid-19. Since then we have had the completion of a quite unusual “sub” Cup & Handle. The smaller handle appears very near completion. This pattern is very “Bullish” techncially for gold.
YOUR DESK TOP / TABLET / PHONE ANNOTATED CHART
Macro Analytics Chart Above: SUBSCRIBER LINK
GOLD – ELLIPSE – INTERMEDIATE TERM
We were very pleased with the completion of our Ellipse pattern at the descending trend channel for Gold shown below. This, coupled with a touch of our MATASII Proprietary Momentum Indicator (bottom indicator), suggests that we should now experience a period of consolidation before moving higher. Global events can change this, but gold normally requires testing support before making further aggressive advances.
YOUR DESK TOP / TABLET / PHONE ANNOTATED CHART
Macro Analytics Chart Above: SUBSCRIBER LINK
PROPRIETARY MATASII CROSS
The proprietary MATASII Cross is signalling a near to Intermediate consolidation. Experience suggests this is a strong likelihood!

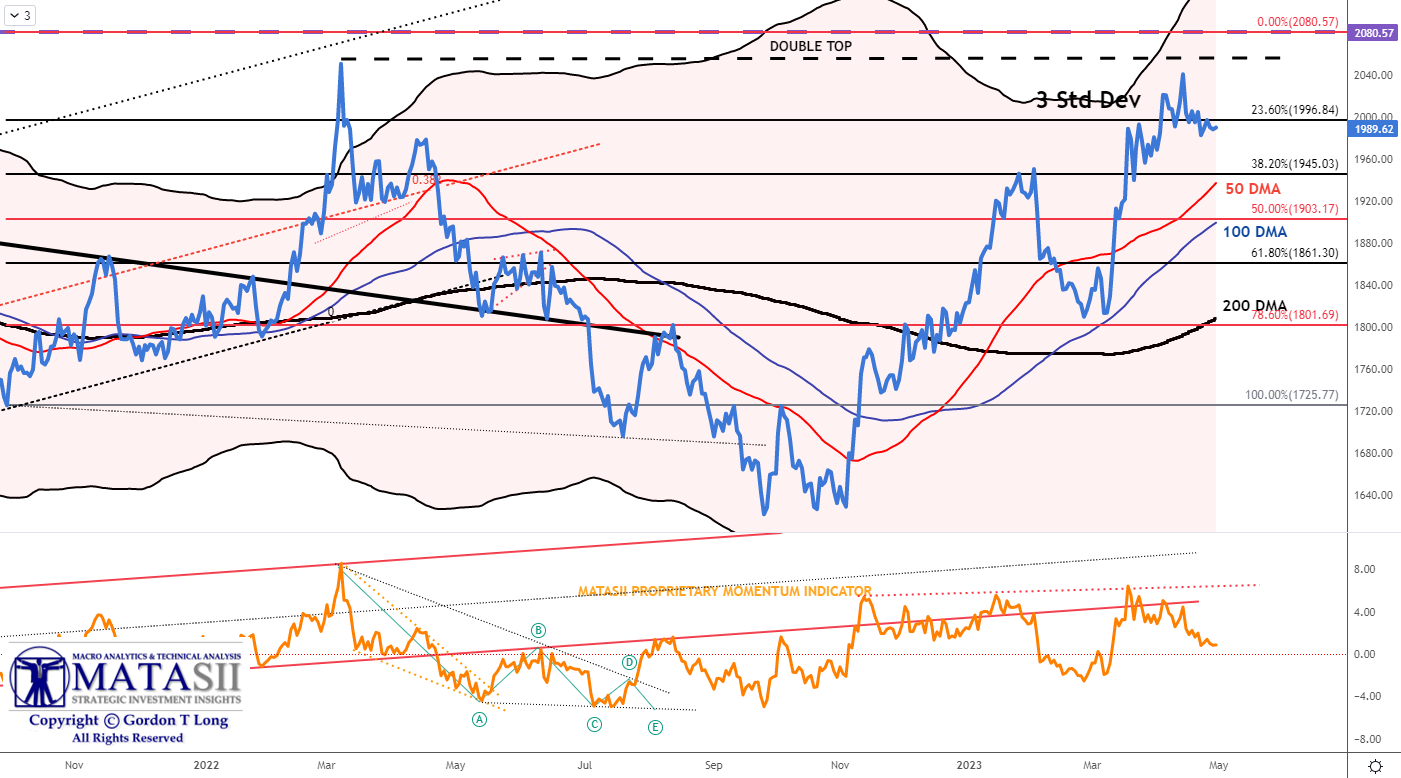
THREE STANDARD DEVIATIONS
The Three Standard Deviation Bomar Channel for Gold has proven to be a somewhat reliable metric as a signal that a “consolidation” is both approaching and required.
YOUR DESK TOP / TABLET / PHONE ANNOTATED CHART
Macro Analytics Chart Above: SUBSCRIBER LINK
FAIR USE NOTICE This site contains copyrighted material the use of which has not always been specifically authorized by the copyright owner. We are making such material available in our efforts to advance understanding of environmental, political, human rights, economic, democracy, scientific, and social justice issues, etc. We believe this constitutes a ‘fair use’ of any such copyrighted material as provided for in section 107 of the US Copyright Law. In accordance with Title 17 U.S.C. Section 107, the material on this site is distributed without profit to those who have expressed a prior interest in receiving the included information for research and educational purposes. If you wish to use copyrighted material from this site for purposes of your own that go beyond ‘fair use’, you must obtain permission from the copyright owner.
NOTICE Information on these pages contains forward-looking statements that involve risks and uncertainties. Markets and instruments profiled on this page are for informational purposes only and should not in any way come across as a recommendation to buy or sell in these assets. You should do your own thorough research before making any investment decisions. MATASII.com does not in any way guarantee that this information is free from mistakes, errors, or material misstatements. It also does not guarantee that this information is of a timely nature. Investing in Open Markets involves a great deal of risk, including the loss of all or a portion of your investment, as well as emotional distress. All risks, losses and costs associated with investing, including total loss of principal, are your responsibility.
