Gordon T Long

Gordon T Long

Global Macro Research | Macro-Technical Analysis 

TIPPING POINTS

US DOLLAR STRENGTH


TIME TO TALK THE US DOLLAR!

The US Dollar’s rise is benefiting both from concerns that the latest wave of Covid-19 and China’s problems will dent global growth, and additionally from the perception that the Federal Reserve will need to grow more hawkish from here.
 
A persistently Stagflationary dynamic with lower growth but a hawkish Fed is likely to leave little room for a dollar downtrend, at least in the immediate near term.
 
MATASII HAS CALLED THE US DOLLAR DIRECTION QUITE WELL … SO FAR!
 
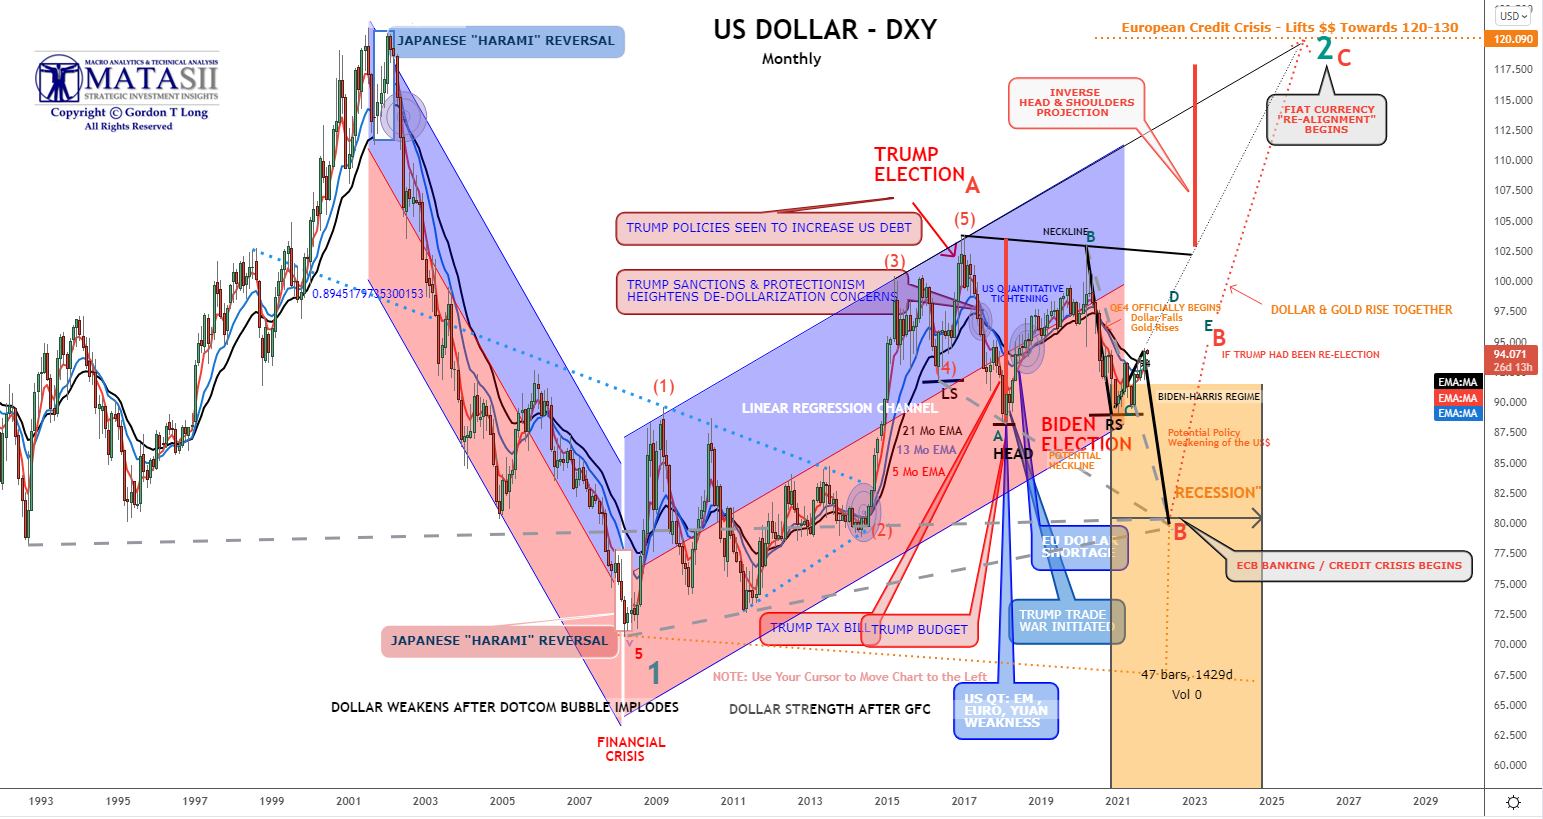
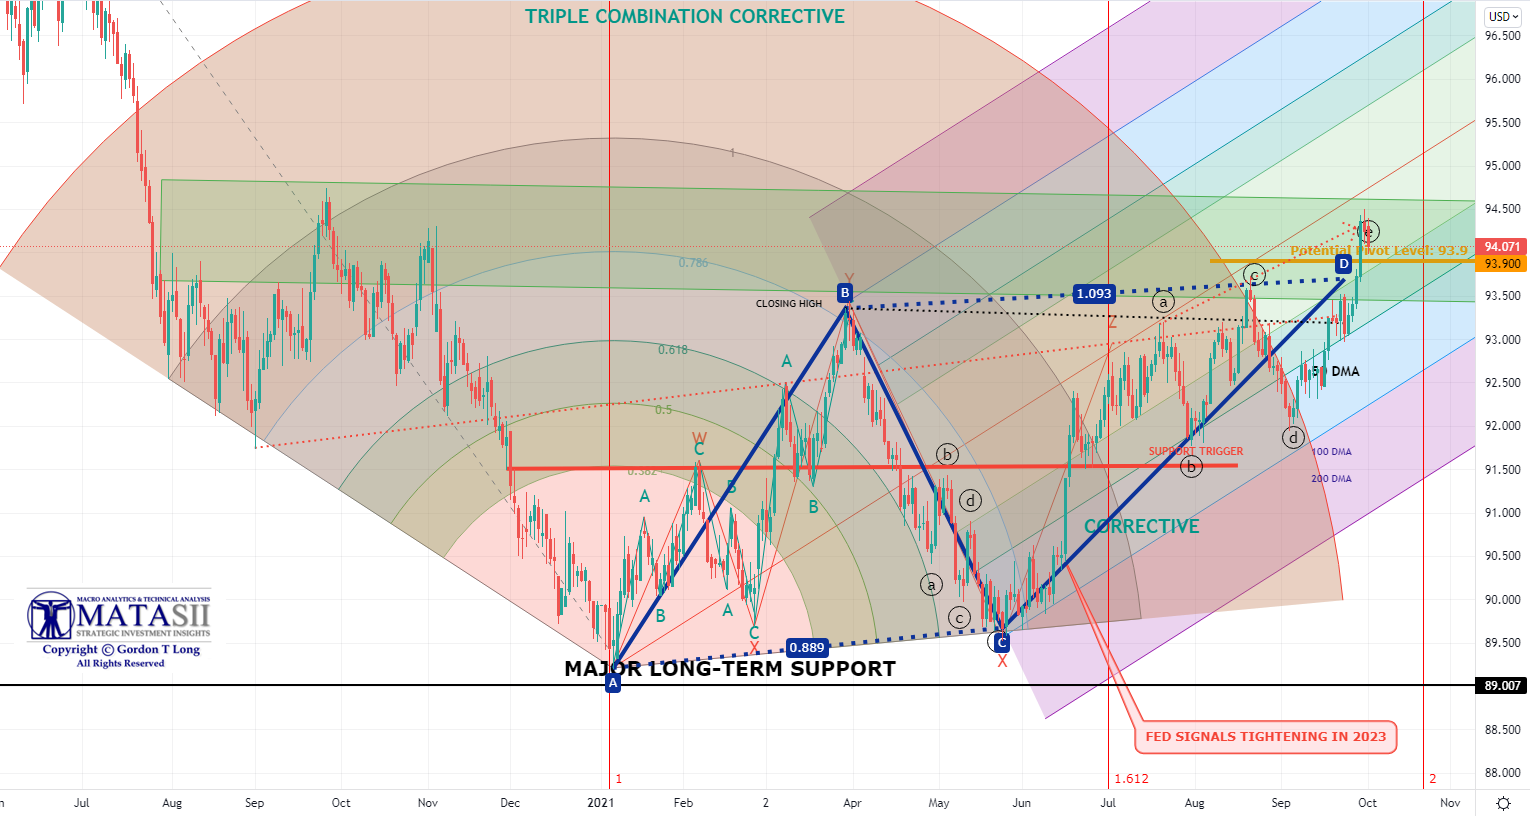
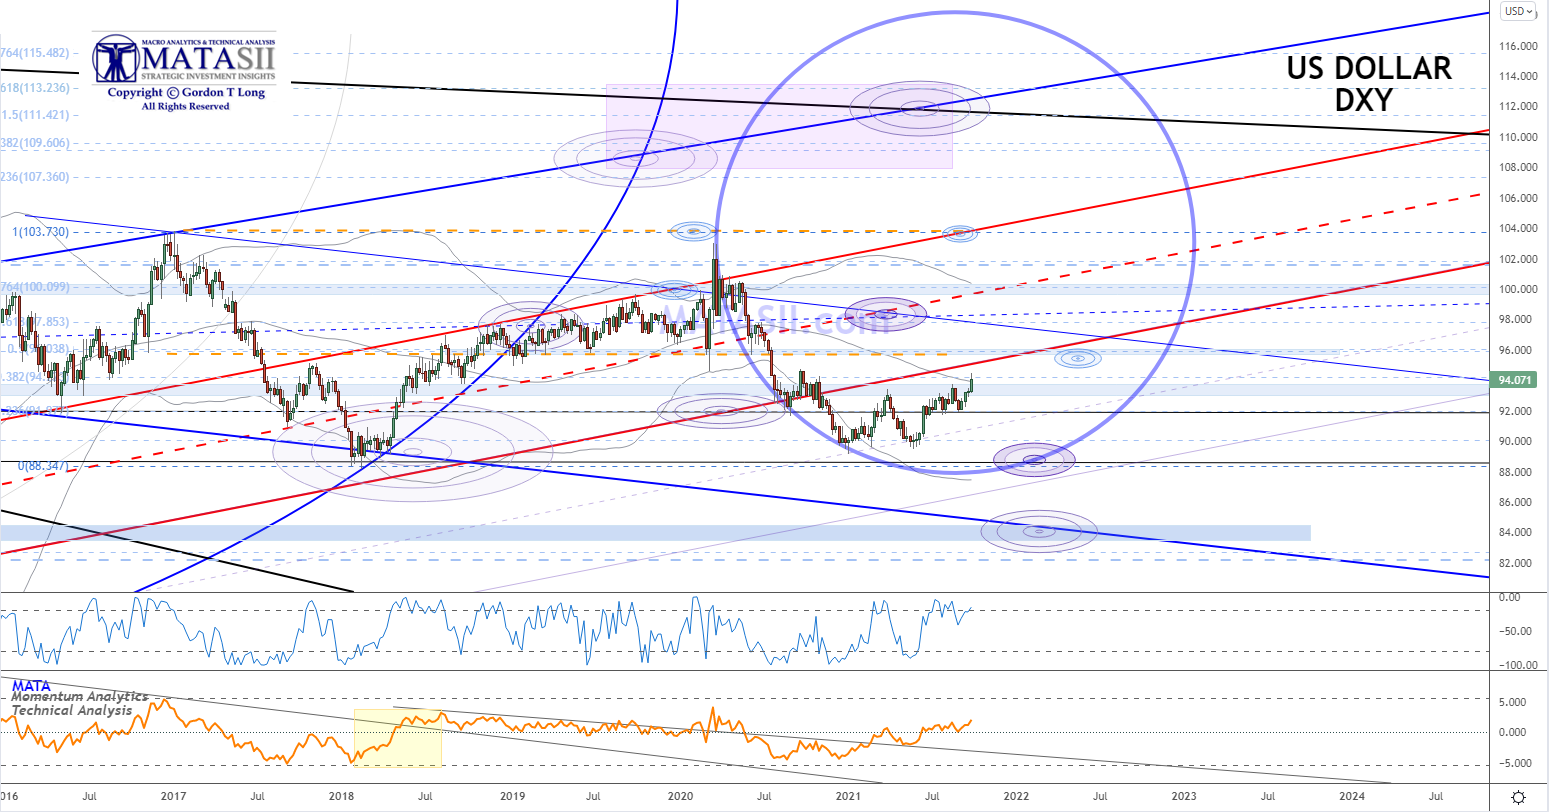
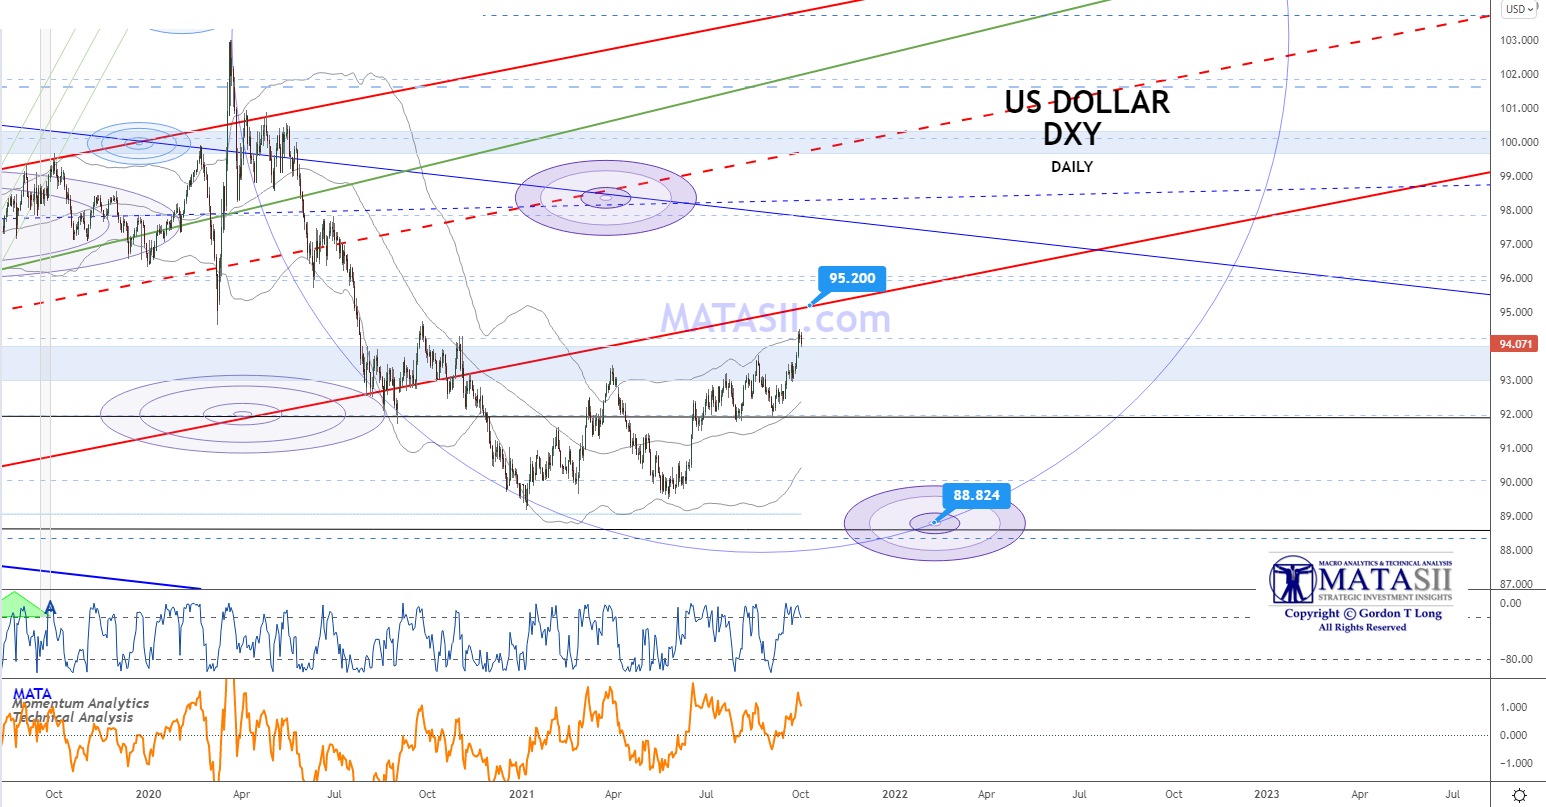
Regular readers are quite familiar with the two US Dollar (DXY) charts to the right. So far they have been quite prescient in determining both price targets and the timing of them.
 
LONGER TERM
 
The longer term chart that we have been showing for a few years now has most recently guided us from a 2020 Pre-Covid high of ~103 in the DXY to a late October 2020 low of 89 to the most recent bounce to 94. This bounce to ~94 is part of a “B” retracement in a downward “ABC” drop in the US Dollar.
 
INTERMEDIATE TERM
 
The bottom chart has detailed the corrective leg of the “ABC”.
 
Technically it appears that we are near the end of this correction. But are we? A lot has changed since we identified 94 as a Q3 2021 DXY target. So, where to from here? Let’s consider three developments:
 
 
1- CONSEQUENCES OF RISING TREASURY YIELDS
 
The yields offer on US Treasuries can soon be expected to attract funds to the dollar. As an example,Treasury yields are rising compared to equivalent Bund yields, just as they tanked with the onset of the pandemic last year — in both cases, shifts in yield differentials have eventually moved the dollar with them. 
 
Here is a Bloomberg chart that suggests this might be soon expected to accelerate.  Remember, normally when times are bad for the global economy, the dollar generally prospers as people normally become more risk-averse.
 
2- CONSEQUENCES OF A WEAKENING EURUSD
 
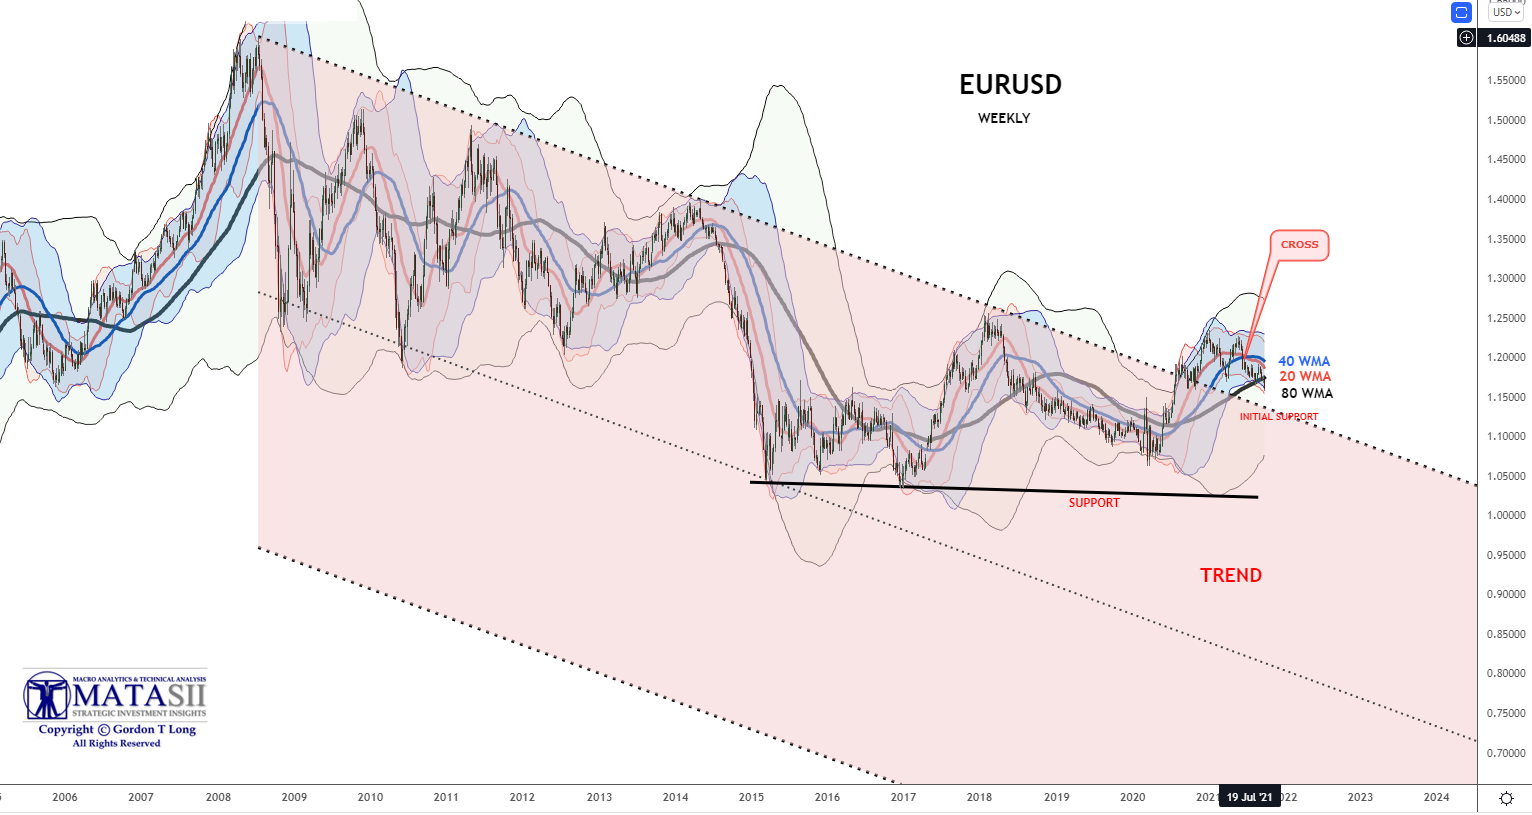
With the EURUSD now through a notable 1.1664 support, a break of 1.16 could draw in momentum players and open up a new higher trading range for the USD between 94-96 on the DXY. The bias remains to the downside on the EURUSD where 1.16 marks very critical support from a technical point of view. A break of this level is likely to be pivotal for momentum players.  
 
Below is our current EURUSD Weekly chart which suggests a lower test is ahead for the EURUSD and therefore a push to 94-96 for the DXY.
 
3- CONSEQUENCES OF PRESSURES ON THE CHINESE YUAN
 
We are witnessing through the Evergrande debacle, the beginnings of an implosion in China’s property market with property sales growth falling to recessionary levels, driving many property developers to the brink of bankruptcy. The overwhelming consensus is that this isn’t an issue since China can ramp up its money supply and force its banks to reflate the bubble.
 
This could have been true if the yuan was the reserve currency of the world, but it isn’t. China has significant demand for U.S. dollars to facilitate trade and maintain the stability of the yuan. To the extent that dollar inflows into China weaken, this makes it very difficult to ease monetary policy while simultaneously keeping the yuan stable.
 
Dollar inflows into China are already weakening and this will be made worse when a risk-off sentiment driven by Fed tightening takes hold. When liquidity is abundant, investing in emerging markets is attractive, as an opportunity to take advantage of higher growth rates and lower valuations. The opposite is true when monetary conditions tighten, particularly when an emerging market is on the brink of a structural downturn in growth, like China.
 
China will be forced into monetary easing just as the Federal Reserve heads in the opposite direction.
 
CONSIDERING THE MULTI-DECADE VIEW OF THE US DOLLAR
 
To answer what these consequences might mean, it is important to place them in some sort of long term perspective.
 
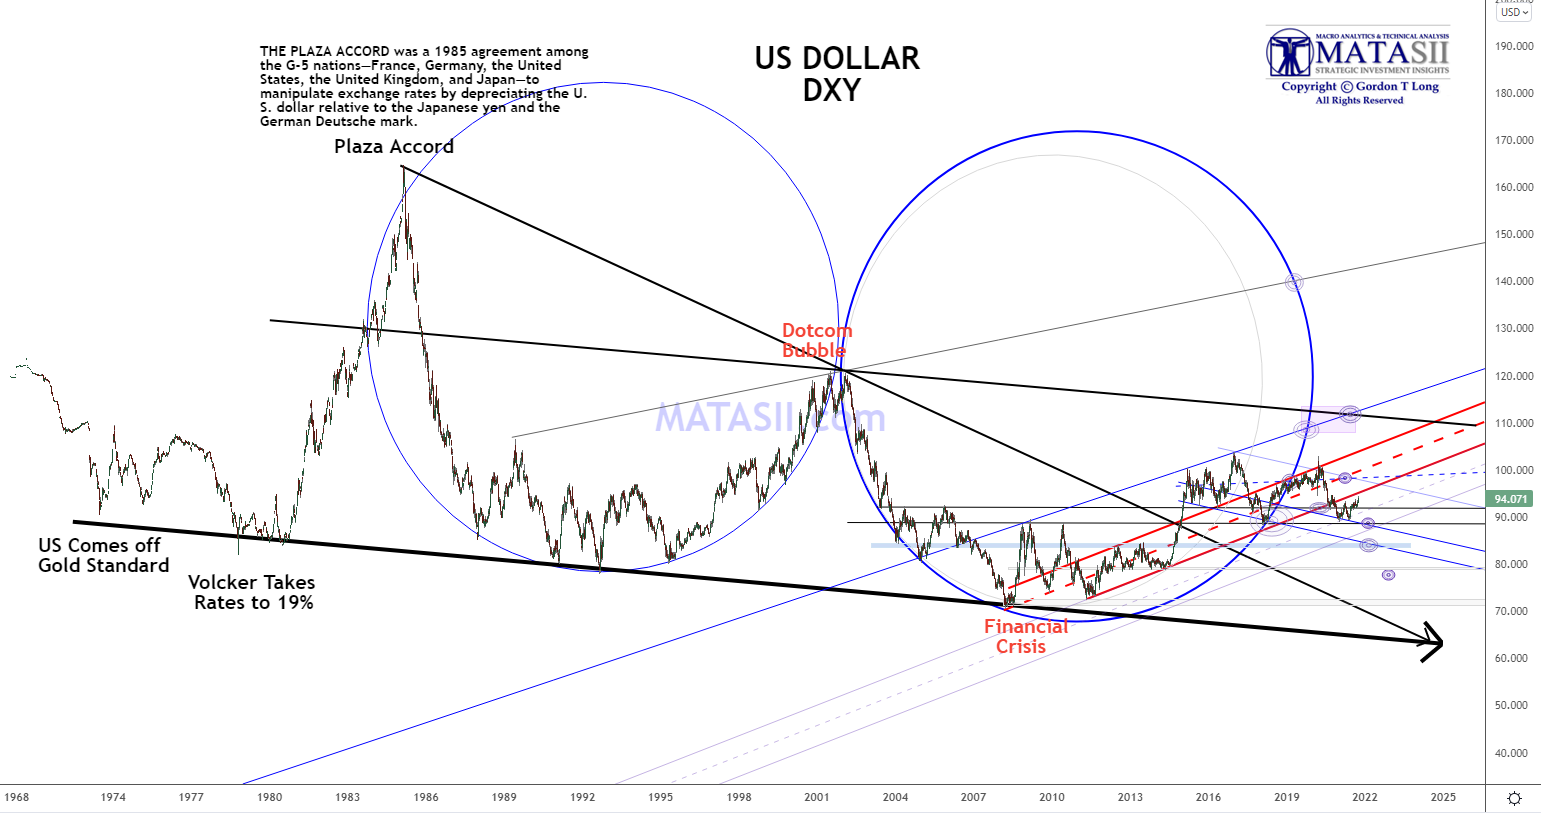
We drew this MATASII Dollar chart (directly below) not long after the 2000 Dotcom Bubble Implosion as part of our MATASII Trigger’s Service. Our DXY charts (above) have always traced within it and adhered to its boundary conditions and trend lines.
 
You can see that since 2019 it has exited the two grand cycle circles and basically followed the trend channel drawn in red.
 
NEAR TERM LIFT
 
The red trend channel was broken in early November 2020 as a result of the US Presidential election.
 
You will notice we now have a smaller fractal Circle with a lot of similarities to the larger grand cycle circles.
 
It appears that the DXY wants to test the underside of the red channel before heading lower.
 
Exploding this circle further, we get a couple of potential price points and their timing.
 
The chart above suggests the possibility of a very sudden drop in the US Dollar. What could cause this? The seriousness of the Global Supply Chain disruptions is causing serious problems in many nations but particularly in Emerging Markets where their debt is often denominated in US Dollars. With the value of the dollar rising and their exports falling it is placing many nations in an increasingly perilous situations with their debt reparations. The last thing the world can least afford presently is a strong US Dollar. Especially since the US Dollar is probably over-valued by ~40% based on US Productivity. Additionally and very importantly, the US debt growth increasingly needs to be financed by foreigners. A cheaper dollar would dramatically assist with this. A reduced credit rating or a 1985 Style Plaza Accord agreement may soon become a forced outcome.
 
1985 PLAZA ACCORD
The historic 1985 Plaza Accord, signed at the Plaza Hotel in New York City, was a pro-growth agreement signed by what was then known as the G-5 nations: West Germany, France, the United States, Japan, and the United Kingdom. The purpose was to force the United States to devalue its currency due to a current account deficit, approaching an estimated 3% of GDP (today it is 11.8% and widen significantly again in the latest quarter). The agreement enacted the manipulation of the exchange rates by depreciating the U.S. dollar relative to the Japanese yen and the German Deutsche mark. Substitute Emerging Markets for Japan and Germany and you have the same problem … but worse!
 
CONCLUSION
 
What might the above charts suggest to us?
 
TWO STAGES AHEAD FOR US DOLLAR
 
  • SHORT TERM UPWARD PRESSURES
    • EURUSD Weakness Place Upward Pressures on US$,
    • Rising Real US Bond Yields due to Inflation and Duration Hedging will Place Upward Pressures on US$,
    • China’s demand for US Dollars will increase due to Yuan pressures and capital flight.
  • INTERMEDIATE TERM DOWNWARD PRESSURES
    • We can expect something approaching a 1985 Plaza Accord type agreement to take the US down in value (whether formal or stealth).
 
The Global Economy Will Require a Cheaper US Dollar to Maintain Stability and
Avert Global Stagflation.
 
It is not out of the Realm of possibilities that another 1985 Style “Plaza Accord” Will Soon Be Required!
 
Remember, a cheaper dollar has historically always meant higher stock prices. Heaven knows the world could not handle falling stock and assets values for very long!
 
“Once the Fed begins to hike rates or yield curves start to invert, the time to become much more defensive will become evident. However, such could all change quickly with the introduction of an exogenous event. In the meantime, remain invested but don’t be lulled into complacency. Changes in markets always happen slowly, then all at once.”


FOLLOWING DETAILED ANALYSIS IS SUBSCRIBER CONTENT ONLY

Subscribe to view full post content with supporting live charts
 

FAIR USE NOTICE  This site contains copyrighted material the use of which has not always been specifically authorized by the copyright owner. We are making such material available in our efforts to advance understanding of environmental, political, human rights, economic, democracy, scientific, and social justice issues, etc. We believe this constitutes a ‘fair use’ of any such copyrighted material as provided for in section 107 of the US Copyright Law. In accordance with Title 17 U.S.C. Section 107, the material on this site is distributed without profit to those who have expressed a prior interest in receiving the included information for research and educational purposes.  If you wish to use copyrighted material from this site for purposes of your own that go beyond ‘fair use’, you must obtain permission from the copyright owner.


NOTICE  Information on these pages contains forward-looking statements that involve risks and uncertainties. Markets and instruments profiled on this page are for informational purposes only and should not in any way come across as a recommendation to buy or sell in these assets. You should do your own thorough research before making any investment decisions. MATASII.com does not in any way guarantee that this information is free from mistakes, errors, or material misstatements. It also does not guarantee that this information is of a timely nature. Investing in Open Markets involves a great deal of risk, including the loss of all or a portion of your investment, as well as emotional distress. All risks, losses and costs associated with investing, including total loss of principal, are your responsibility.