MACRO
US MONETARY POLICY
A NERVOUS MARKET AWAITS THE NEW YEAR
OBSERVATIONS: I WORRY ABOUT SO FEW INDICTMENTS & MSM REPORTING ON INCREASINGLY BLATANT CORRUPTION!
The year 2023 will go down in U.S. banking history as the year in which the fastest bank runs in U.S. history occurred, producing the second, third and fourth largest banking failures in U.S. history in the span of seven weeks.
Losses of more than $32 billion from these failed banks hit the Federal Deposit Insurance Commission (FDIC). Adding to the regulatory hubris, the largest and riskiest bank in the U.S., JPMorgan Chase, was allowed by its compromised regulators to become even riskier by gobbling up the failed First Republic Bank while JPMorgan Chase got an unexplained $50 billion 5-year loan from the FDIC at an undisclosed interest rate to sweeten its purchase of the failed bank.
And, what good is a banking crisis if the Fed can’t pony up yet another bank bailout fund, this time with loans of up to an unprecedented one-year term. (Under Federal Reserve statutory legislation, the Federal Reserve Act, the Fed is supposed to make short-term loans. Ignoring statutory legislation has never been a problem at the Fed, however.)
Less than two months after this unprecedented banking chaos occurred, Fed Chair Jerome Powell was back to delivering his Alice in Wonderland narrative to Congress that the “U.S. banking system is sound and resilient.” (If it is so sound and resilient, why does it need so many emergency bailout programs from the Fed?)
Attesting to the systemic nature of the banking crisis, the share prices of the four largest banks in the U.S. began to sell off, with both Bank of America and Wells Fargo losing over 20 percent in the span of three weeks.
And, of course, one can’t have a real banking crisis without a Global Systemically Important Bank (G-SIB) blowing up. This time it was a Swiss bank, Credit Suisse, with heavy ties to Wall Street mega banks.
The overarching reality is that corruption has reached unparalleled levels in the U.S. banking system, fueled by its incestuous relationship with Wall Street trading houses and Big Law. Meanwhile the Criminal Division of the U.S. Department of Justice and Big Media focus on keeping the American people in the dark.
WHAT YOU NEED TO KNOW!
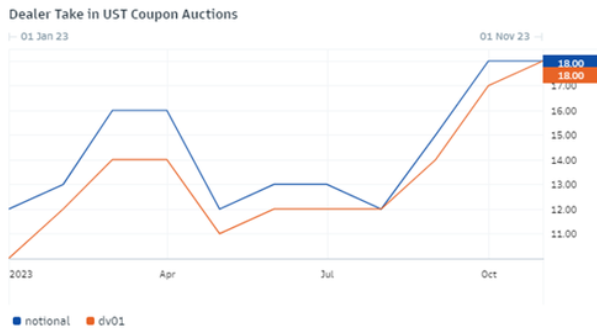 US TREASURY BOND AUCTIONS: The Suspense Only Grows
The US Treasury Auction Dealer community has been forced to take on an increasingly higher share of even larger Treasury auctions. This surely can’t continue much longer before Treasury Yields will be forced much higher!
RESEARCH
THE PHILLIPS CURVE: The Fed’s Holy Grail Is Presently Using Bad Data
-
- The Problem with the Phillips Curve today is that it is being used with both faulty Unemployment Data and Statistically “Massaged” Inflation measures.
- UNEMPLOYMENT: Unable to make ends meet, a record number of Americans have been forced to resort to getting a second or even third job. That’s also making the employment statistics look better than they are by increasing the number of payrolls without increasing the number of people employed.
- INFLATION: The statistical games of Hedonics, Imputation, Substitution and many more make the CPI almost a meaningless number, other than to possibly suggest a trend. The work of John Robert’s at Shadowstats best reflects this by taking out the statistical games and reporting inflation as 1980-based for a comparison = 12-13%.
- GOVERNMENT FUNDING: The Federal Reserve has a third mandate which is causing the biggest problem. The Fed must ensure that the government is able to fund itself through available and sufficient bank reserves to sell its Bonds at auction.This forces the Fed to create lending facilities and programs that can best be described with the current massive spending deficits as simply “Monetary Malpractice”.
IS THE AUTO INDUSTRY ABOUT TO CRASH? – New Car Prices, Underwater Loans and Poor EV Sales Say So!
-
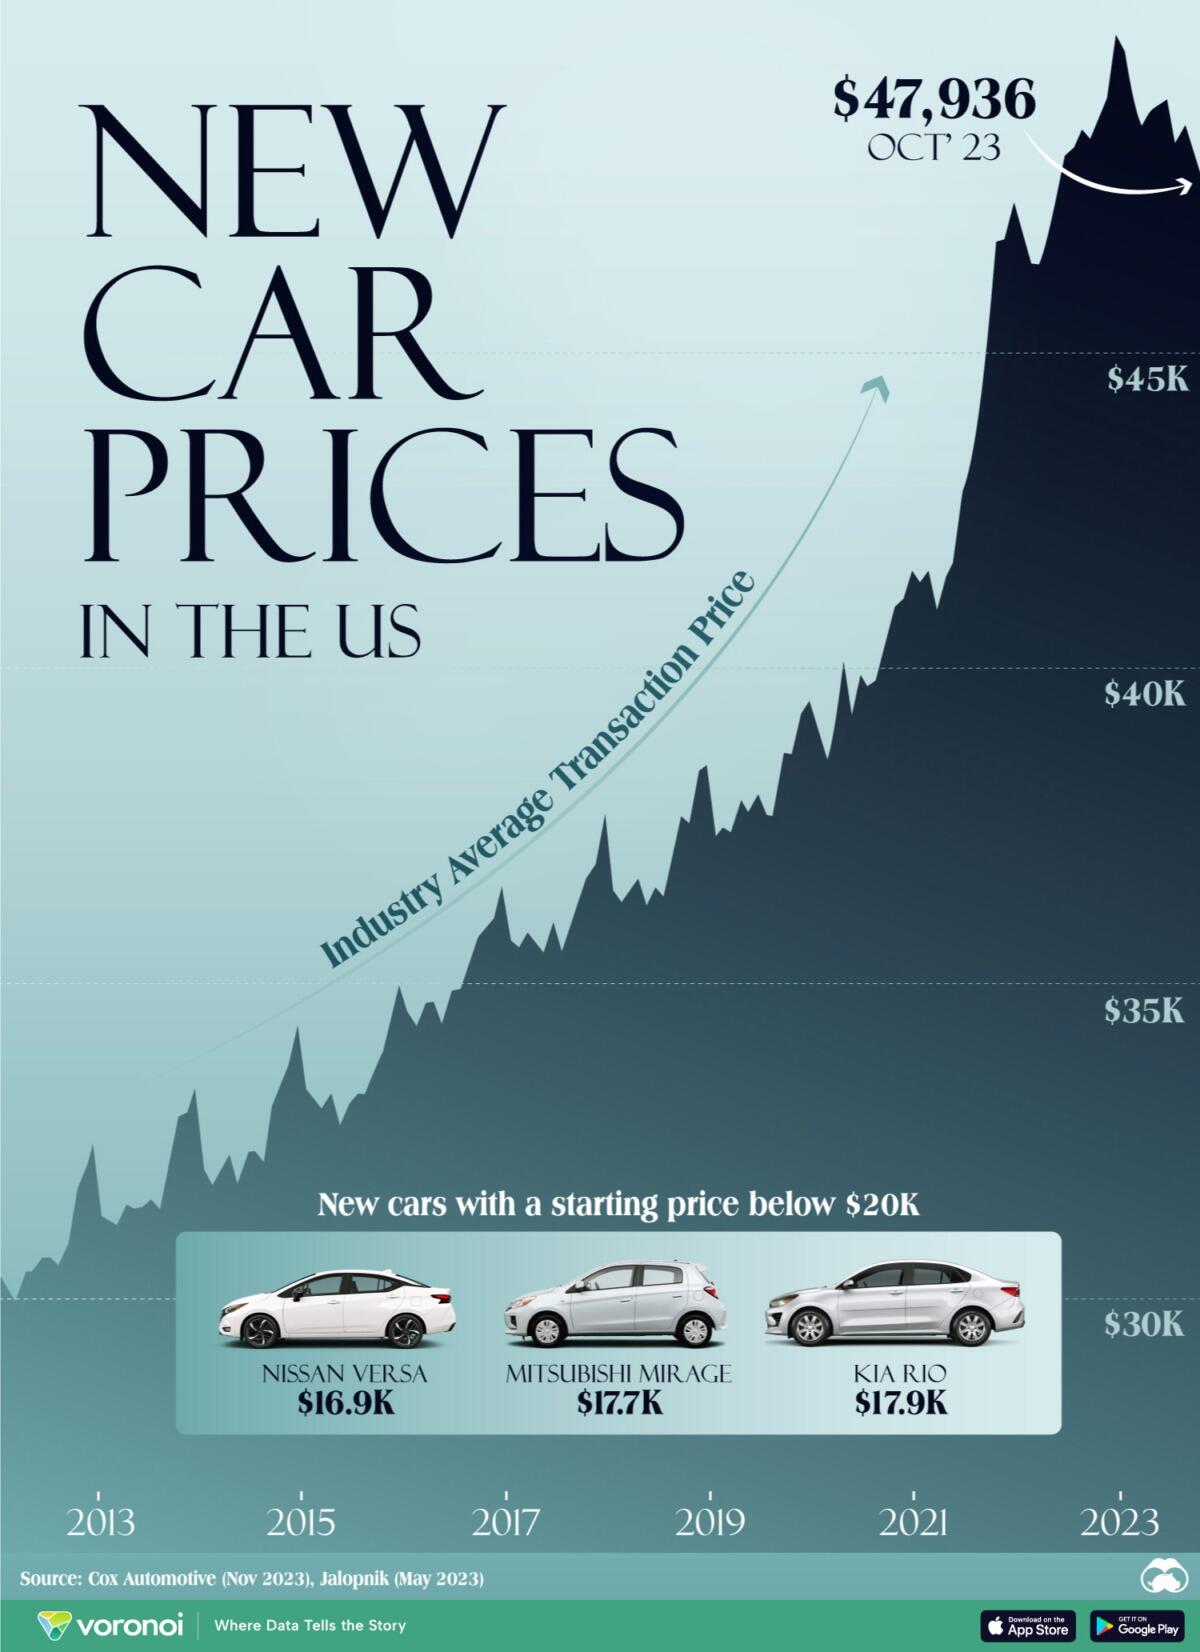
- The Average New Car Loan being Financed is now ~ $40,000.
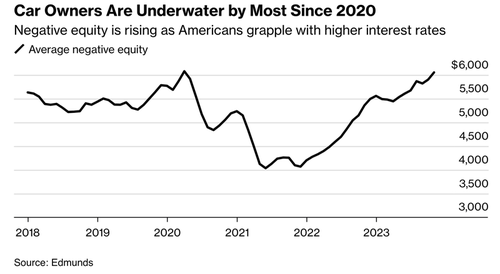
- The Average Negative Equity is ~ $6,000.
- Car Owners are the most Underwater since 2020.
- The average rate for a new car loan is 7.4% and 11.6% for a used car.
- The percentage of owners 60 days in arrears on payments is the highest ever!
- As Manufacturers shift to EV they are finding they can’t sell the volumes planned for.
- Additionally, the market for used EVs is plummeting. What will car rental companies do with the used ones with no resale value? Problems started in China but have now spread to Europe and the US. No one wants used EV even as residuals plummet.
GLOBAL ECONOMIC REPORTING: What This Week’s Key Global Economic Reports Tell Us?
-
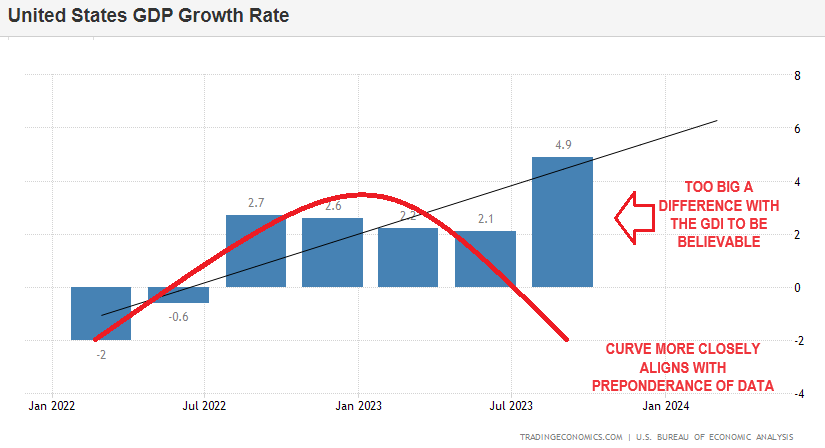
- FINAL Q3 2023 GDP: US GDP Final (Q3) 4.9% vs. Exp. 5.2% (Prev. 5.2%)
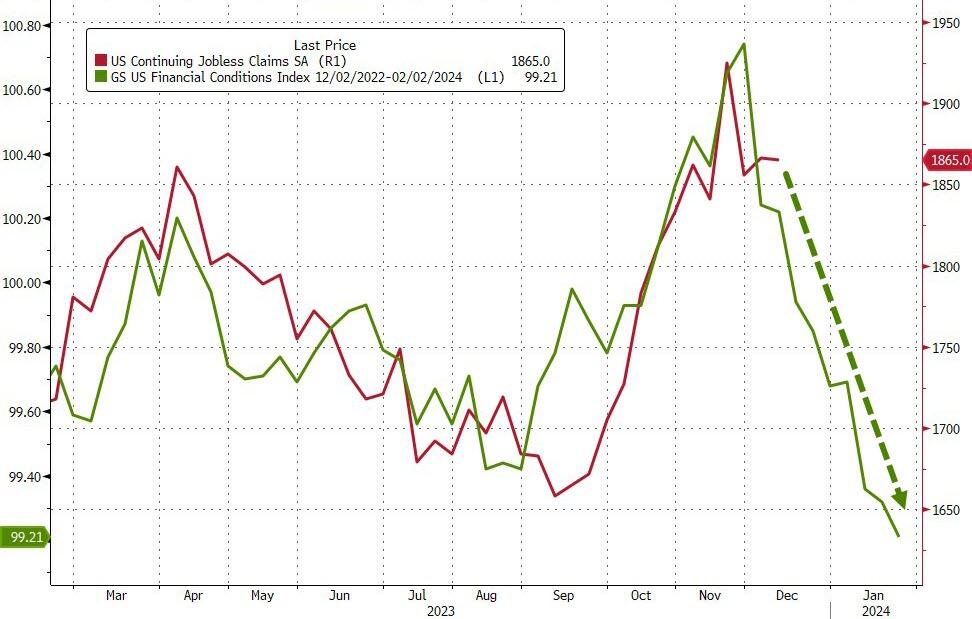
- CONTINUOUS JOBLESS CLAIMS: If the massive loosening of financial conditions is any signal, then continuing claims may be about to plunge (4 week lagged continuing claims track US FCI). The question then is what will this do to wage inflation?
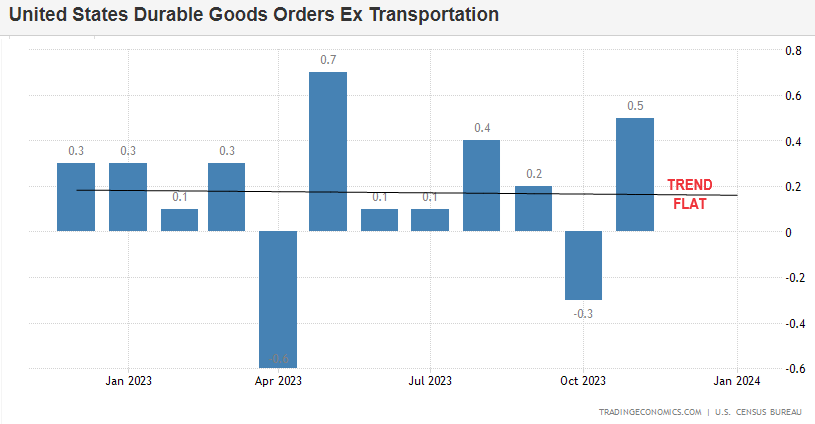
- DURABLE GOODS: Durable Goods rose 5.4% in November, above the 2.2% forecast and paring the prior 5.1% decline. Ex-transport was also strong, rising 0.5%, above the 0.1% forecast and climbing from the prior 0.3% decline.
DEVELOPMENTS TO WATCH
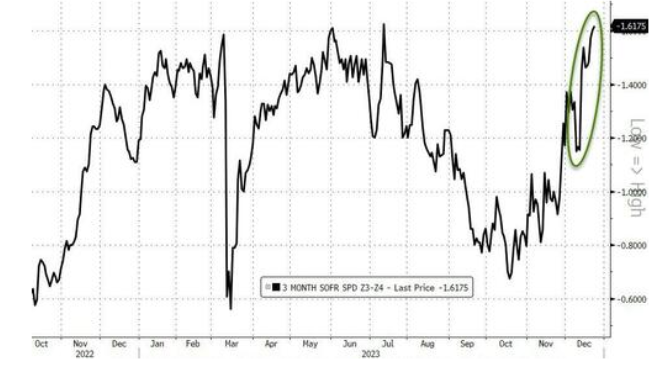 ARE RATE CUT EXPECTATIONS OVER-EXUBERANT?
Rate-cut expectations have surged to new highs. Analysts are now pricing in 163bps of cuts in 2024.
If The Fed needs to cut rates that far, that fast, it won’t be because of slowing inflation – it will be because of accelerating depression… which is NEVER good for stocks!
INFLATION EXPECTATIONS CONTINUE TO BE CUT
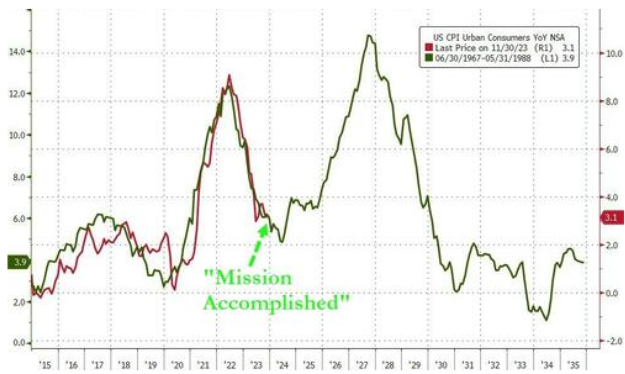
The market seems very sure that Inflation has been addressed and is now behind us. We disagree and history is on our side! (CHART)
What’s extremely weird about the Fed policy today is how much it looks almost identical to what happened in 1976. If history repeats itself (or at least rhymes), we could be looking at a massive resurgence of inflation from 2025 and onward. The truly pessimistic scenario is that it could be far worse than the 1970s, simply because Fed policy has been so irresponsible for much of this century so far. And true to form, not one person associated with the Fed has taken any responsibility for the damage that institution has done.
THE PHILLIPS CURVE: The Fed’s Holy Grail Is Presently Using Bad Data
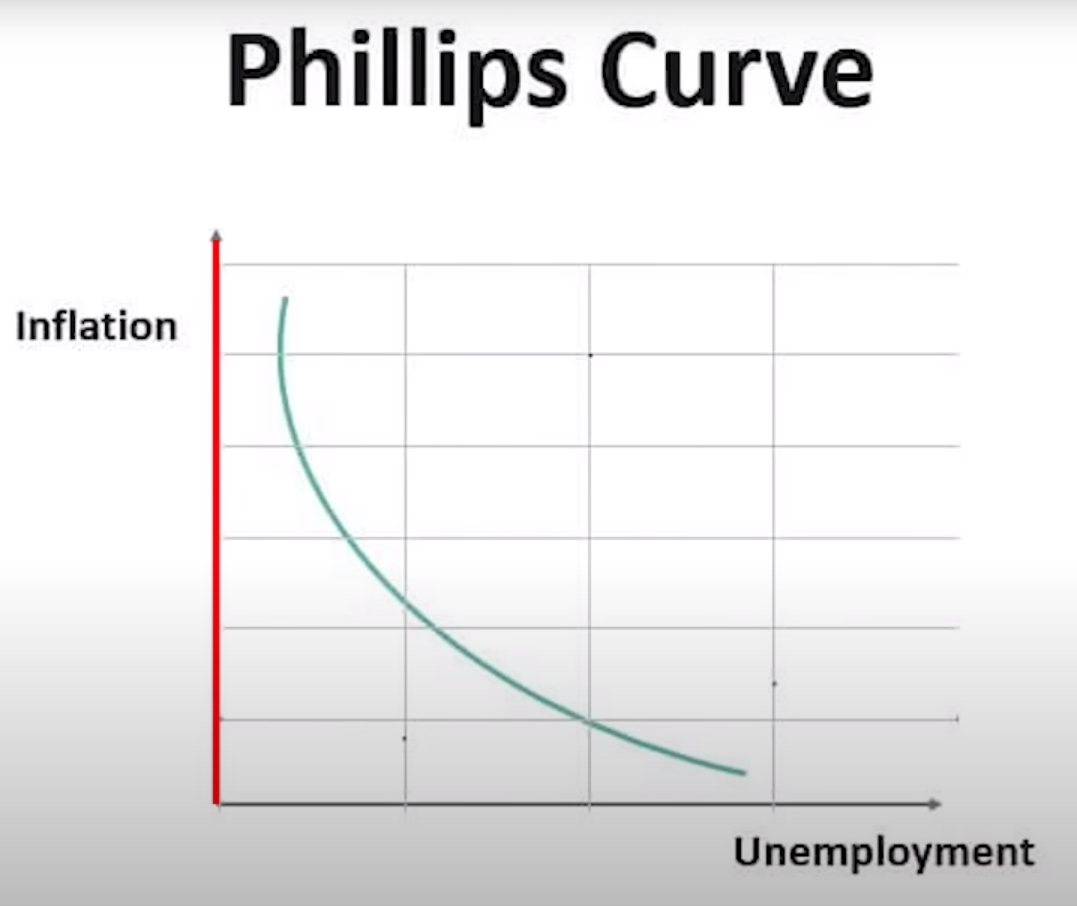 The Problem with the Phillips Curve today is that it is being used by the Federal Reserve with both faulty Unemployment Data and Statistically “Massaged” Inflation measures from the BLS (Bureau of Labor Statistics).
THE FED’S DUAL MANDATE
The Federal Reserve has a Dual Mandate. The dual mandate requires the Federal Reserve to achieve maximum employment while keeping prices stable.
It is to do this by:
-
- Controlling the money supply, and
- Raising or lowering interest rates when the economy is slowing down or growing too fast.
THE PHILLIPS CURVE
The Phillips Curve is the accepted relationship between the two:
-
- The higher Unemployment, the Lower Inflation
- The lower Unemployment, the higher Inflation
Too many people working can lead to few goods (too much money chasing too few goods creates inflation).
THE CURRENT UNEMPLOYMENT “MISPERCEPTION”
Unable to make ends meet, a record number of Americans have been forced to resort to getting a second or even third job. That’s also making the employment statistics look better than they are by increasing the number of payrolls without increasing the number of people employed. Unfortunately, even this isn’t enough for many Americans, who have depleted their savings and gone deeply into debt to keep the lights on. This is what Americans see & feel, but the accepted statistics fail to recognize.
“It’s a precarious spot for many Americans, coming after a twin surge in car buying and interest rates has strained finances and fueled an uptick in automobile repossessions. The average rate for a new car loan is 7.4% and 11.6% for a used car. The latest consumer credit report from the Fed revolving credit shows high-interest rates have bogged down student and auto loans; in other words, the consumer is stretched. Bloomberg
 INFLATION
The statistical games of Hedonics, Imputation, Substitution and many more make the CPI almost a meaningless number that other to possible suggest a trend. The work of John Robert’s at Shadowstats best reflects this by taking out the statistical games and reporting inflation as 1980-based for a comparison.
INFLATION = 12-13%
THE THIRD MANDATE – Absorbing & Funding Excess Political Deficit Spending
The Federal Reserve has a third mandate, which is causing the biggest problem. The Fed must ensure that the government is able to fund itself through available and sufficient bank reserves to sell its Bonds at auction.This forces the Fed to create lending facilities and programs that can best be described with the current massive spending deficits as simply “Monetary Malpractice”.
IS THE AUTO INDUSTRY ABOUT TO CRASH?
 NEW CAR PRICES
Consumers face increasing financial difficulties due to elevated inflation, a generational high in interest rates, maxed-out credit cards, lack of personal savings, and two years of negative real wage growth amid the mounting failures of ‘Bidenomics.’ The latest distress is that the number of Americans in upside-down auto loans has reached the highest level since 2020. According to automotive research firm Edmunds.com, the number of Americans with auto loans “underwater” or “negative equity” in November reached an average of $6,054, the highest level since April 2020.
Earlier this year according to Fitch, “More Americans Can’t Afford Their Car Payments Than During The Peak Of Financial Crisis“… The average new car loan has reached a record high of $40,000.
“We’re in this situation where combined with the cost of the vehicles being so high and the interest rates being so historically high, you have a lot of people who are in bad car loans,”
Joseph Yoon, consumer insights analyst for Edmunds, told Bloomberg.
The percentage of subprime auto borrowers at least 60 days past due in September topped 6.11%, the highest ever. The bear market in used car prices will only accelerate the number of auto loans underwater into 2024.
 USED CAR PRICES
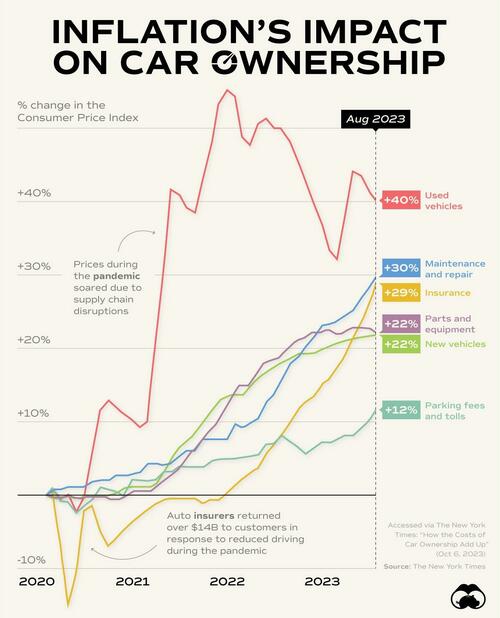
Owning a truck or car has become far more expensive than in the past, even as recently as three years ago. Inflation has impacted various aspects of vehicle ownership, based on the percentage change in the Consumer Price Index (CPI).
The biggest increases are logged in the price of new and used vehicles, up 22% and 40% respectively.
Car ownership costs only continue to increase after the vehicle is acquired. Insurance costs are now nearly 30% higher compared to 2020, along with maintenance and repair. If a part has to be replaced, that’s another 20% price increase. Even parking and tolls are up 12%.
And of course, for most vehicle owners we also have to consider the price of gas, which has grown nearly three-fold since 2020.
Financing costs, which have risen steeply in conjunction with rapid rate hikes over the last year, are weighing on America’s trillion dollar credit bill. Auto loans are the second-highest monthly payment for U.S. households after mortgages.
Put together, the AAA estimates the annual cost of owning a new car in 2023 has reached $12,182, up 14% from last year.

EV SALES IN TROUBLE
Authored by Mike Shedlock via MishTalk.com
The market for used EVs is plummeting. What will car rental companies do with the used ones? Problems started in China but have spread to Europe and the US.
China’s Abandoned, Obsolete Electric Cars Are Piling Up in Cities
Bloomberg notes China’s Abandoned, Obsolete Electric Cars Are Piling Up in Cities
A subsidy-fueled boom helped build China into an electric-car giant but left weed-infested lots across the nation brimming with unwanted battery-powered vehicles.
On the outskirts of the Chinese city of Hangzhou, a small dilapidated temple overlooks a graveyard of sorts: a series of fields where hundreds upon hundreds of electric cars have been abandoned among weeds and garbage.
Similar pools of unwanted battery-powered vehicles have sprouted up in at least half a dozen cities across China, though a few have been cleaned up. In Hangzhou, some cars have been left for so long that plants are sprouting from their trunks. Others were discarded in such a hurry that fluffy toys still sit on their dashboards.
The cars were likely deserted after the ride-hailing companies that owned them failed, or because they were about to become obsolete as automakers rolled out EV after EV with better features and longer driving ranges. They’re a striking representation of the excess and waste that can happen when capital floods into a burgeoning industry, and perhaps also an odd monument to the seismic progress in electric transportation over the last few years.
Shenzhen-based photographer Wu Guoyong was one of the first people in China to document the waste that results from frenetic development, taking striking drone shots of the piles of abandoned bicycles in 2018. In 2019, he filmed aerial footage of thousands of electric cars in empty lots around Hangzhou and Nanjing, the capital of China’s eastern Jiangsu province.
“The shared bikes and EV graveyards are a result of unconstrained capitalism,” Wu said. “The waste of resources, the damage to the environment, the vanishing wealth, it’s a natural consequence.”
The Chinese government literally forced people to buy them. Biden is attempting the same in the US.
That article is from August. Let’s flash forward to December 21 to see how things are going in Europe.
No One Wants Used EVs, Making New Ones a Tougher Sell Too
What started in China is not limited to China. A second Bloomberg article reveals No One Wants Used EVs, Making New Ones a Tougher Sell Too
Because most new vehicles in Europe are sold via leases, automakers and dealers who finance these transactions are trying to recover losses from plummeting valuations by raising borrowing costs. That’s hitting demand in some European markets that were in the vanguard of the shift away from fossil fuel-powered propulsion. Some of the biggest buyers of new cars, including rental firms, are cutting back on EV adoption because they’re losing money on resales, with Sixt SE dropping Tesla models from its fleet.
The problems are expected to intensify next year, when many of the 1.2 million EVs sold in Europe in 2021 will come off their three-year leasing contracts and enter the secondhand market. How companies tackle this problem will be key for their bottom lines, consumer confidence and ultimately decarbonization — including the European Union’s plan to phase out sales of new fuel-burning cars by 2035.
“There isn’t used-car demand for EVs,” said Matt Harrison, Toyota Motor Corp.’s chief operating officer in Europe. “That’s really hurting the cost-of-ownership story.”
“One has to slash prices significantly just to get customers to look at EVs,” said Dirk Weddigen von Knapp, who heads a group representing VW and Audi dealers.
Biden Struggles to Convince People to Buy EVs, Only 12 Percent Seriously Considering
-
- On April 18, I reported Biden Struggles to Convince People to Buy EVs, Only 12 Percent Seriously Considering
- On July 13, I noted Despite Huge Incentives, Supply of EVs on Dealer Lots Soars to 92 Days
- On August 20, I reported Clean Energy Exploitations and the Death Spiral of an Auto Industry
- On October 16, I commented Wake Up Mr. President, Consumers Want Hybrids, Not EVs
- More accurately, that should read Wake Up Mr. President, Consumers Don’t Want EVs.
GM Decreases EV Investment in Favor of Buybacks
And on December 2, I noted To Shore Up Share Price, GM Decreases EV Investment in Favor of Buybacks
Last month, GM said it would push back the opening of an electric-truck factory in suburban Detroit by a year. It also scrapped an earlier goal of producing 400,000 EVs over a roughly two-year stretch, through mid-2024.
Slam Dunk Ford Project Now Unclear. Ford’s EV plan is similarly distressed. Ford pauses and then scales back proposed Michigan facility backed by government funding.
Manchin Blasts Biden’s Definition of “Foreign Entity of Concern”
In the you can’t make this up department, Biden’s EV Subsidy Rules Leave Room for Chinese Suppliers
Depending on the definition of “foreign entity of concern”, a number of things are floating in the wind including $7,500 tax credits.
Officials worked for months to define a foreign entity of concern but failed. It is not even clear if Ford buyers are eligible for tax credits. “Licensing technology, might be permissible under the rules,” officials said.
Who wants to buy a new EV on the basis a $7,500 credit “might” be allowed?
Q&A on What’s Delaying the Definition
Q: Why the struggle on the definition of “Foreign Entity of Concern”?
A: Ford wants to use Chinese technology but GM wants to block it.
For discussion, please see An Epic Battle: Ford to Use China’s Battery Technology, GM Wants it Blocked
My comment then was “Biden is guaranteed to upset someone. That’s what happens when you interfere in the free markets, taking sides.”
Biden is avoiding a firm definition hoping the problem will go away. But it won’t.
In the real world, The Green Fantasy Ends Because Consumers Don’t Want to Pay for It
EVs are not selling, because despite massive subsidies to both the manufacturers and consumers, the latter via tax credits, consumers don’t want them.
But here we are, blaming this mess on capitalism. “It’s a natural consequence.“
GLOBAL ECONOMIC INDICATORS: What This Week’s Key Global Economic Releases Tell Us
 CONTINUOUS JOBLESS CLAIMS – Week Ending 12/27/23
If the massive loosening of financial conditions is any signal, then continuing claims may be about to plunge (4 week lagged continuing claims track US FCI – Chart Right). The question then is what will this do to wage inflation?
-
- US Initial Jobless Claims w/e 205.0k vs. Exp. 215.0k (Prev. 202.0k, Rev. 203k)
- US Continued Jobless Claims w/e 1.865M vs. Exp. 1.888M (Prev. 1.876M, Rev. 1.866M)
The number of Americans filing for jobless benefits for the first time rose from 206k to 218k in the week ending 12/23 (just off 2023 lows). Continuing claims rose modestly from 1.861 million Americans to 1.875 million, (still below the 1.9mm Maginot Line, but basically at the highest in two years).
Goldman believes that persistent seasonal distortions more than explain the 218k increase in continuing claims since early September, and expect those distortions to boost the level of continuing claims by an additional 100k by March.
 FINAL US Q3 GDP
-
- US GDP Final (Q3) 4.9% vs. Exp. 5.2% (Prev. 5.2%)
The final Q3 GDP data was revised down from the second estimate to 4.9% (prelim. 5.2%), despite expectations for it to be left unrevised.
-
- The revision primarily reflected a downward revision to consumer spending.
- Meanwhile, the deflator was revised to lower to 3.3% from 3.5% (exp. 3.6%) with the GDP sales being revised down marginally to 3.6% from 3.7%.
- Consumer spending was revised down to 3.1% from 3.6% while personal income rose by USD 196.2bln in Q3, which was downwardly revised by USD 22.1bln from the second estimate.
- Q3 personal income was supported by increased compensation, nonfarm proprietors income and personal interest income, which was partly offset by a fall in personal current transfer receipts.
- Disposable income rose USD 143.5bln, down USD 0.5bln from the prior estimate.
- On prices, Q3 Core PCE was revised down to 2.0% from 2.3%, despite the unchanged forecast.
-
- The Headline PCE was revised down to 2.6% from 2.8%. Overall, Q3 saw robust growth and easing price pressures, a welcome sign for the Fed.
- There had been some concerns that if the strong growth were to continue it would hamper the Fed’s ability to return inflation back to the 2% target. However, the strong growth seen in Q3 is unlikely to continue into Q4 with the Atlanta Fed GDPNow estimate tracking growth at 2.7% for Q4.
- With prices easing, participants will be turning their attention to the November US PCE report due on Friday for a timelier picture of the inflation environment, albeit November’s CPI was relatively in line with expectations, the PPI was much softer. Fed Chair Powell also suggested the Fed expect November Core PCE to rise 3.1% vs the Wall St consensus of 3.3%.
 DURABLE GOODS
Durable Goods rose 5.4% in November, above the 2.2% forecast and paring the prior 5.1% decline. Ex-transport was also strong, rising 0.5%, above the 0.1% forecast and climbing from the prior 0.3% decline.
-
- The super core durable goods (non-defence capital goods excluding air) also beat expectations at 0.8% (exp. 0.2%), although the prior was revised down to -0.6% from -0.3%.
- Overall, it was a strong report and Pantheon Macroeconomics pointed out the strength was supported by the UAW workers going back to work and a large Boeing (BA) order from Emirates.
- In terms of the impact to GDP, Pantheon reminds us that the only input from Durable Goods into the national accounts is nondefense capital goods shipments ex aircraft, which drives the equipment investment component of GDP declined by 0.1% matching the prior two month readings.
- The Atlanta Fed GDPNow data was released after the data, which incorporates the Durable Goods, PCE and New Home Sales data, and revised down to 2.3% from 2.7% on December 20th.
GLOBAL MACRO
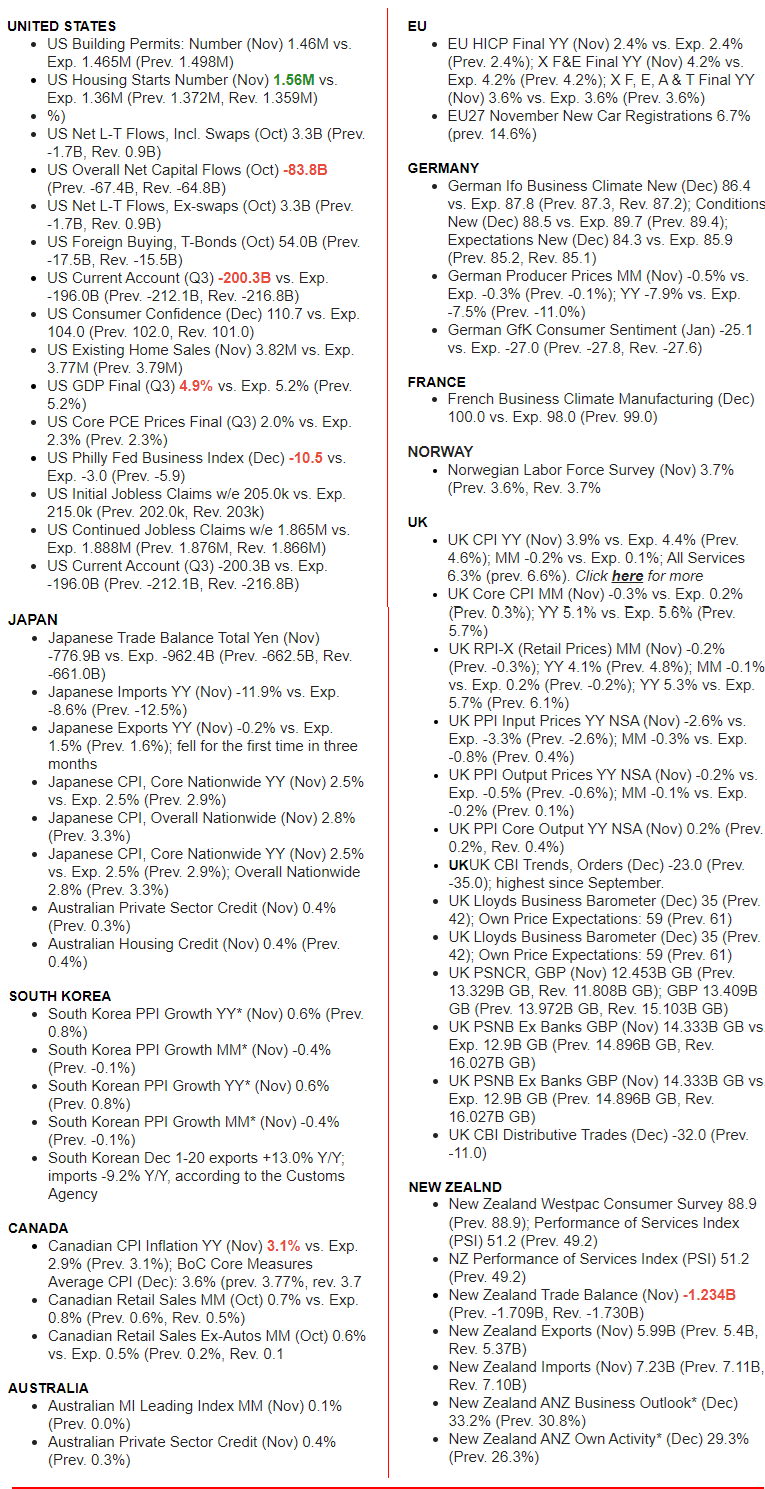
WHAT DOES YOUR SCAN OF THE DATA BELOW TELL YOU? – THE MEDIA AVOIDS BAD NEWS!
We present the data in a way you can quickly see what is happening.
THIS WEEK WE SAW
Exp=Expectations, Rev=Revision, Prev=Previous
DEVELOPMENTS TO WATCH
 ARE RATE CUT EXPECTATIONS OVER-EXUBERANT?
Rate-cut expectations have surged to new highs. Analysts are now pricing in 163bps of cuts in 2024.
If The Fed needs to cut rates that far, that fast, it won’t be because of slowing inflation – it will be because of accelerating depression… which is NEVER good for stocks!
 INFLATION EXPECTATIONS CONTINUE TO BE CUT
The market seems very sure that Inflation has been addressed and is now behind us. We disagree and history is on our side! (CHART).
What’s extremely weird about the Fed policy today is how much it looks almost identical to what happened in 1976. If history repeats itself (or at least rhymes), we could be looking at a massive resurgence of inflation from 2025 and onward. The truly pessimistic scenario is that it could be far worse than the 1970s, simply because Fed policy has been so irresponsible for much of this century so far. And true to form, not one person associated with the Fed has taken any responsibility for the damage that institution has done.
RETAIL IS ALWAYS LATE TO THE PARTY!
JANUARY IS NOTORIOUS FOR “ROTATION” & TAX GAIN SELLING
Click All Charts to Enlarge
1 – SITUATIONAL ANALYSIS
 RETAIL ALWAYS LATE TO THE PARTY!
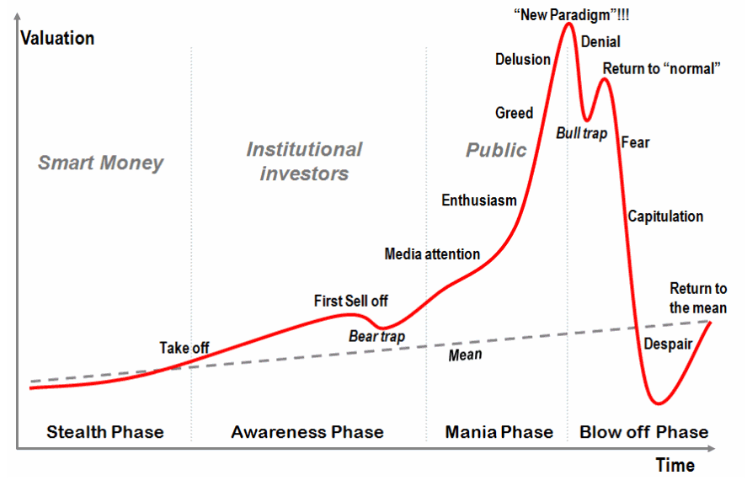
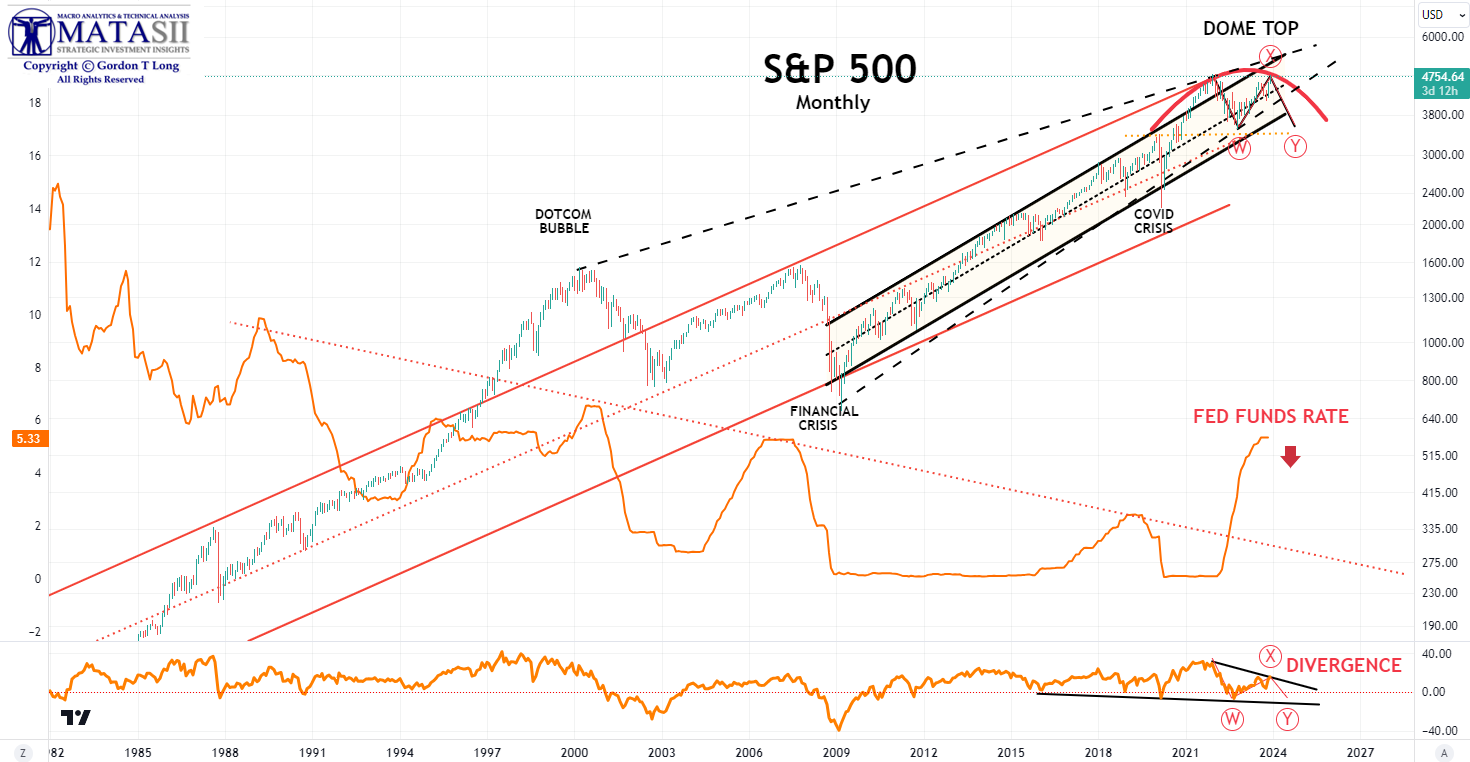
The Classic Emotional Cycle of market participants, which you are no doubt well aware of, is shown to the right. One of the key points of the chart is that Retail Investors are always the last to the party. As we will discuss below, that is exactly what is currently occurring. The question – is it the “New Paradigm” top or the “Return to Normal” top?
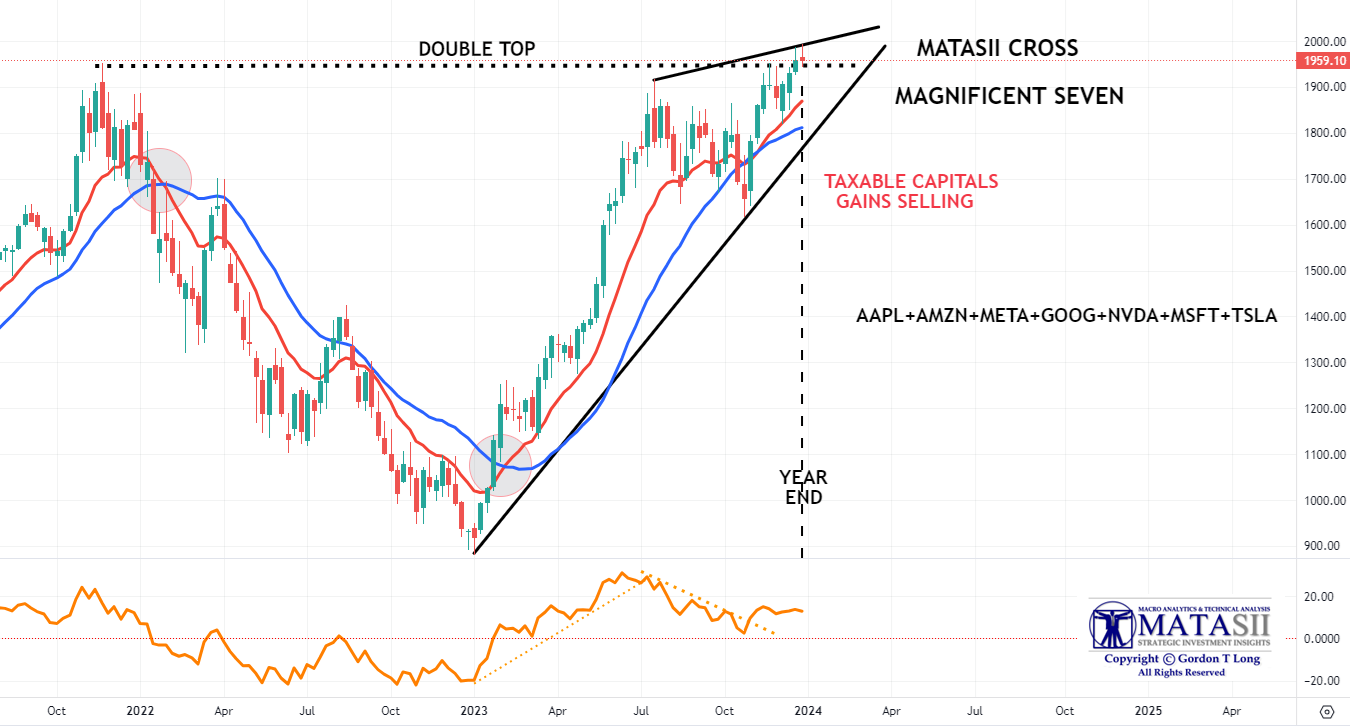
That question is further complicated by the fact that we are currently witnessing a Double Top in the US Equity markets, as represented by the S&P 500 possibly as shown below.
YOUR DESKTOP / TABLET / PHONE ANNOTATED CHART
Macro Analytics Chart Above: SUBSCRIBER LINK
Our view is the Emotional Chart may be best represented currently as shown below. This illustration highlights:
- ARTIFICIAL INTELLIGENCE has been a dominant “New Paradigm” driver of the 2023 market rise from AI stocks like Nvidia, which have contributed significantly to the performance of the “Magnificent 7” technology stocks.
- FED PIVOT: The market belief that July was the last Fed Rate hike and that the Fed Pivot will begin with its first Fed Funds Rate cut in March. Since November the markets have been “front running” this perception of significantly falling interest rates in 2024.
- SOFT LANDING: With Employment holding up extremely well, Jobless Claims low & relatively stable and with final US Q3 GDP being reported at 4.9%, a strong belief has emerged that the Recession may be avoided and if there is one it will be a “Soft Landing”.
- AN ELECTION YEAR: The Fed can be expected to take actions in an election year that will present the best Economic conditions going into the November Presidential election.
These factors are leading the public into a state of Fear of Missing Out (FOMO) on such an apparent strong investment climate. Money is moving from Money Markets to equity & bond ETFs. Global bond and stock markets added almost $20 trillion in capitalization during 2023, with all of that gain coming in the last two months of the year after it had tested unchanged on Oct 28th! The gains were dominated by global stocks, (which added $13.3TN), while global bonds rose by $6.1TN.
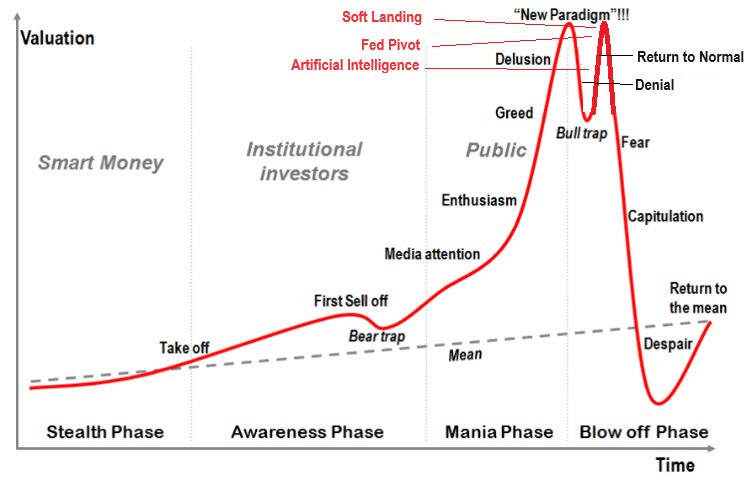
Of course the question is whether everyone is right? Our experience is that when everyone believes something, it seldom if ever unfolds as expected.
EXPECT THE UNEXPECTED TO OCCUR!
2 – FUNDAMENTAL ANALYSIS
SURGING RETAIL INTEREST
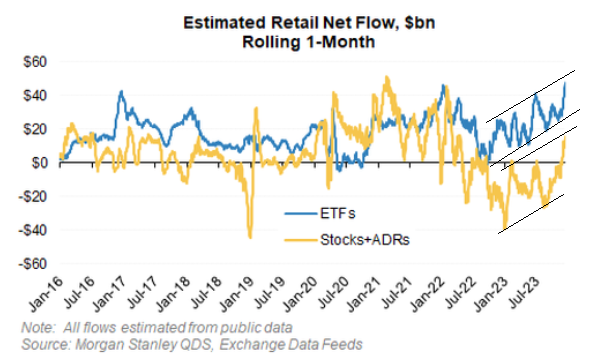
It is retail investors that have arguably been a big driver of the melt up, given they have been buying at the fastest pace in over 18 months. Presently it is coming in with over $60bn in total equity market demand over the last month on QDS estimates based on public data.
Retail is typically a buyer of ETFs, but the last month hit a record in dollar terms, likely helping the market rally.
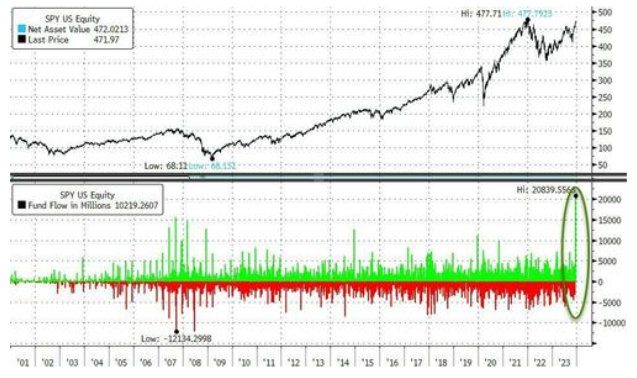 Even more remarkably, SPY – the largest and most liquid S&P 500 ETF – saw 4 straight days of massive inflows after Powell pivoted on Friday 15th, seeing the all-time biggest inflow into the fund of almost $21BN (and over $40BN in the last four days).
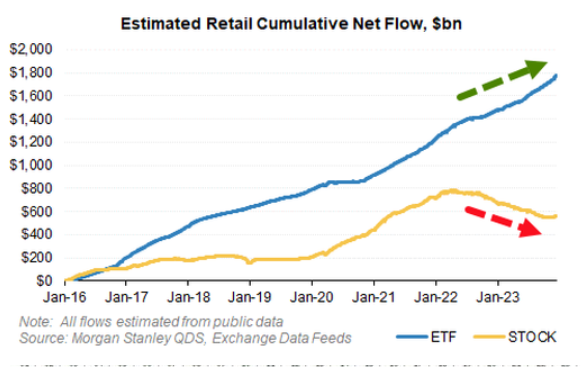
Bloomberg’s Eric Balchunas notes, the $21BN SPY inflow is an all-time world record for any ETF in one day flow.
In single-names the story is a little different though, and retail is likely less of a driver of price action compared to HFs. While retail has turned a single-stock buyer after 18 months of selling, retail volumes as a share of total are down slightly (although not historically low).
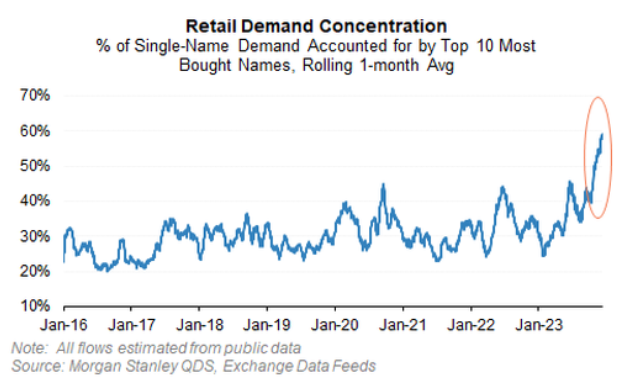
.. and that demand has never been more concentrated in a handful of Tech and Consumer names, and in aggregate only totals $15bn over the last month.
3 – TECHNICAL ANALYSIS
Historically January can be marked with:
-
- Tax Gain selling after a particularly strong prior year
- Sector Rotation with reduced weighting in sectors that had performed particularly well in the prior year
The market has recently shown pretty predictable behavior:
-
- When the US Yields Rise The US$ Rises
- When the US$ Rises, US Equities Fall
Let’s see what these observations may look like by examining: 1- US Treasury Yields, 2- US$ and the 3- US Equities.
US TREASURY MARKET
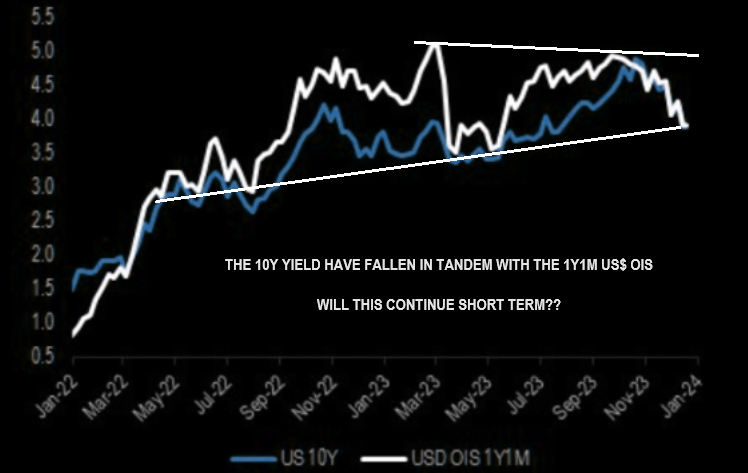 10Y US TREASURY YIELD – “TNX” – WEEKLY
The Weekly 10Y Treasury Yield has now reached its 80 WMA, which can be expected to offer near term support. Yields have come down quite fast and a consolidation should be considered normal.
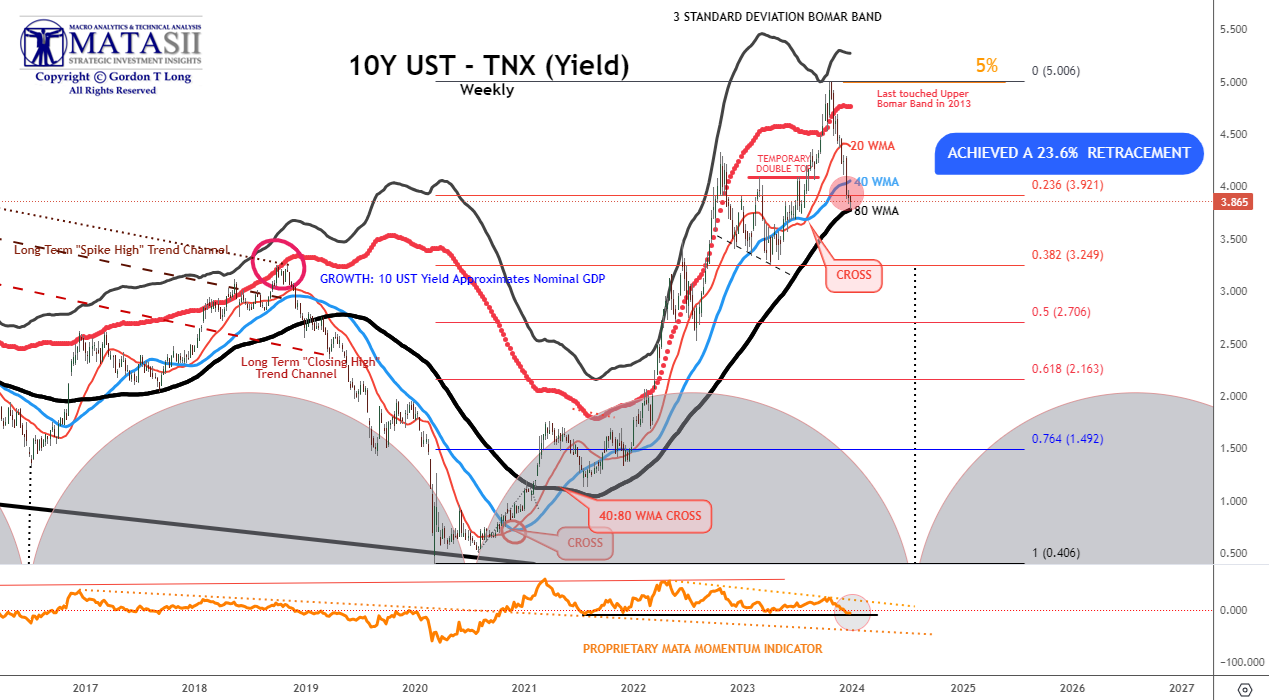
CHART RIGHT: The 10Y Treasury Benchmark Yield has been falling in tandem with the 1Y1M US$ OIS. Will this be continued near term or has it run its course – at least temporarily?
YOUR DESKTOP / TABLET / PHONE ANNOTATED CHART
Macro Analytics Chart Above: SUBSCRIBER LINK
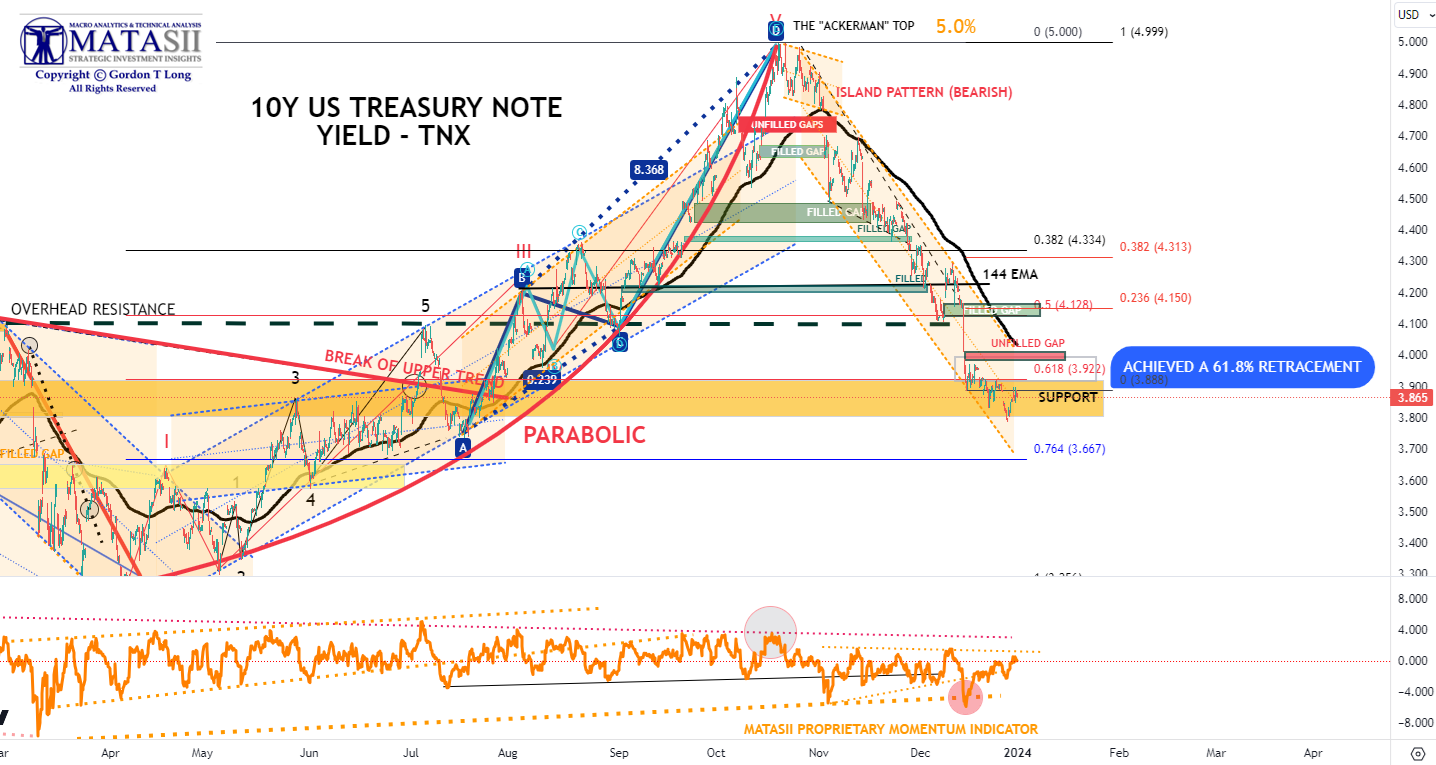
10Y US TREASURY YIELD – “TNX” – HOURLY
The TNX Hourly chart further shows we are now in an area of potential consolidation. It is likely we will now see a near term movement upwards towards its 144 EMA (black EMA), which traditionally acts as a “magnet” for this financial instrument. This may close the only open gap not yet filled since the bearish “Island Formation” at the TNX’s recent high.
YOUR DESKTOP / TABLET / PHONE ANNOTATED CHART
Macro Analytics Chart Above: SUBSCRIBER LINK
CURRENCY – US$
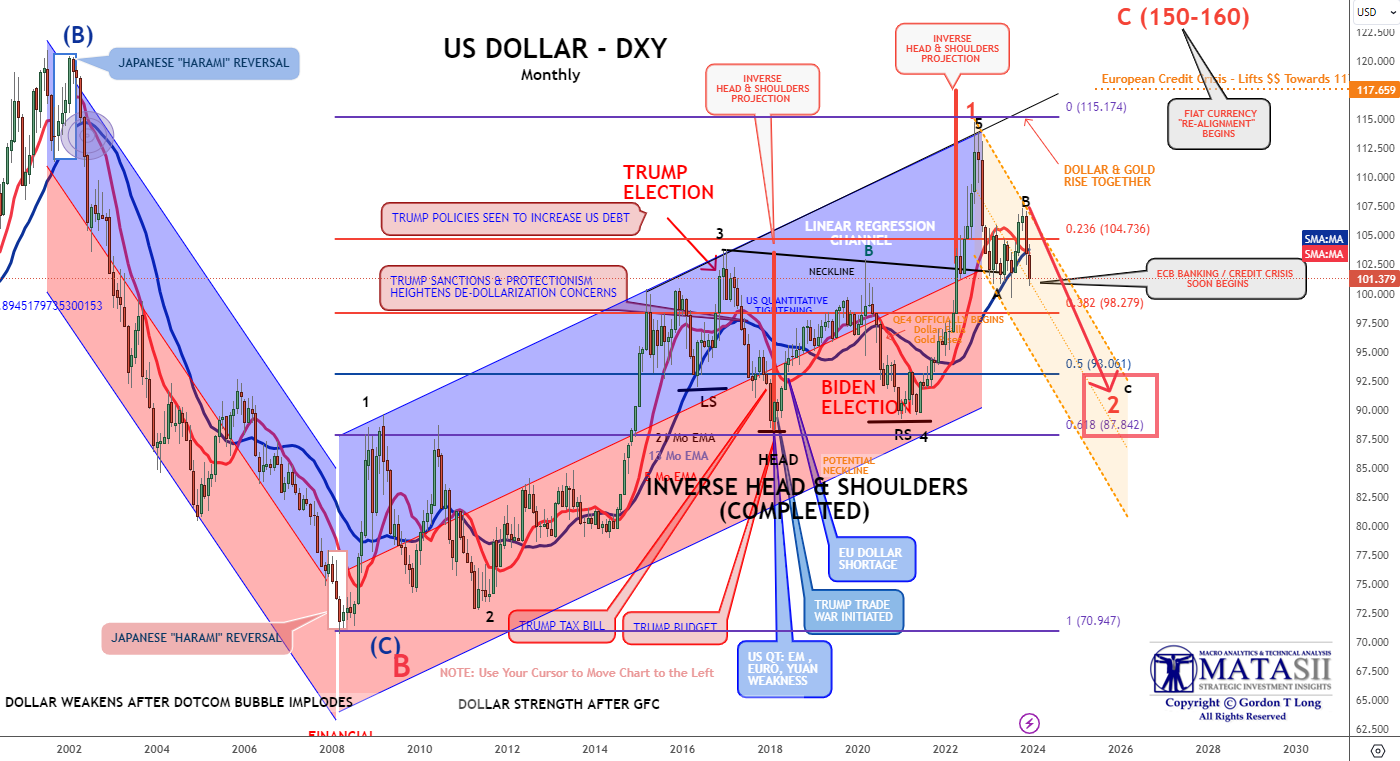
Over the last 60 days we have begun to see sustained downside pressure on the US Dollar as represented by the DXY.
We currently believe we are in the downward “C” wave of an ABC corrective structure that is likely to last into the Presidential election in November 2024. Longer term we presently see the US dollar rising.
YOUR DESKTOP / TABLET / PHONE ANNOTATED CHART
Macro Analytics Chart Above: SUBSCRIBER LINK
EQUITY MARKET

CHART ABOVE Drivers of 2023’s unloved bull market: liquidity and rates
MSCI World up 22% YTD as investors reluctantly reposition for reduced recession risk.
CONTROL PACKAGE
There are FIVE charts we have outlined in prior chart packages that we will continue to watch closely as a “control set” over the next 10 days.
-
- The Russell 2000 through the IWM ETF (CHART LINK)
- Nvidia (NVDA) (CHART LINK)
- The DJIA (CHART LINK)
- The S&P 500 (CHART LINK)
- The MAGNIFICENT SEVEN (CHART BELOW)
MAGNIFICENT 7 – WEEKLY
YOUR DESKTOP / TABLET / PHONE ANNOTATED CHART
Macro Analytics Chart Above: SUBSCRIBER LINK
FAIR USE NOTICE This site contains copyrighted material the use of which has not always been specifically authorized by the copyright owner. We are making such material available in our efforts to advance understanding of environmental, political, human rights, economic, democracy, scientific, and social justice issues, etc. We believe this constitutes a ‘fair use’ of any such copyrighted material as provided for in section 107 of the US Copyright Law. In accordance with Title 17 U.S.C. Section 107, the material on this site is distributed without profit to those who have expressed a prior interest in receiving the included information for research and educational purposes. If you wish to use copyrighted material from this site for purposes of your own that go beyond ‘fair use’, you must obtain permission from the copyright owner.
NOTICE Information on these pages contains forward-looking statements that involve risks and uncertainties. Markets and instruments profiled on this page are for informational purposes only and should not in any way come across as a recommendation to buy or sell in these assets. You should do your own thorough research before making any investment decisions. MATASII.com does not in any way guarantee that this information is free from mistakes, errors, or material misstatements. It also does not guarantee that this information is of a timely nature. Investing in Open Markets involves a great deal of risk, including the loss of all or a portion of your investment, as well as emotional distress. All risks, losses and costs associated with investing, including total loss of principal, are your responsibility.

