Gordon T Long

Gordon T Long

Global Macro Research | Macro-Technical Analysis 

MACRO

US MONETARY POLICY


WEALTH INEQUALITY WASN’T BY HAPPENSTANCE!

Global sovereign debt has been expanding at historic rates with the US Debt quickly now approaching $30T with the US Debt Ceiling moratorium ending Saturday July 31st. Overlay this with a $3.5T US budget reconciliation bill presently on the floor of congress (which along with other planned expenditures will total over $5T) policy setters are soon going to have to ask whether this spending is actually helping or hindering? Maybe just as important a question is who has been winning or losing during this era of exploding debt?

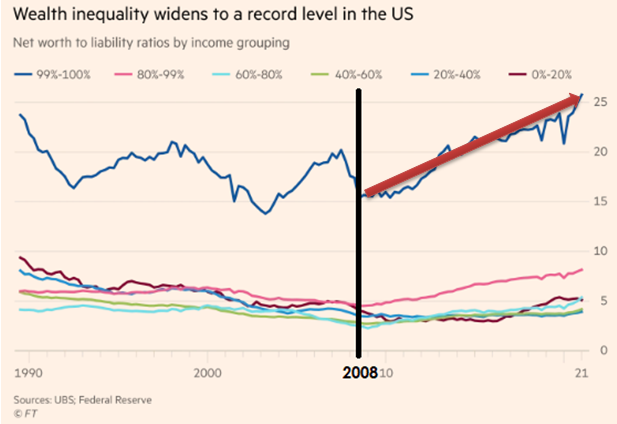
If we look at who has been winning over the last decade it is readily apparent it is the top 1%. Growth in wealth inequality has never shifted faster and seldom reached current levels. Is there a direct and provable correlation with the growth is government debt? Certainly something significant has occurred since 2008!

Let us begin by exploring what has importantly changed in our financial system.


START BY KNOWING HOW THE SYSTEM WORKS!

FIRST: THE MONEY MULTIPLIER

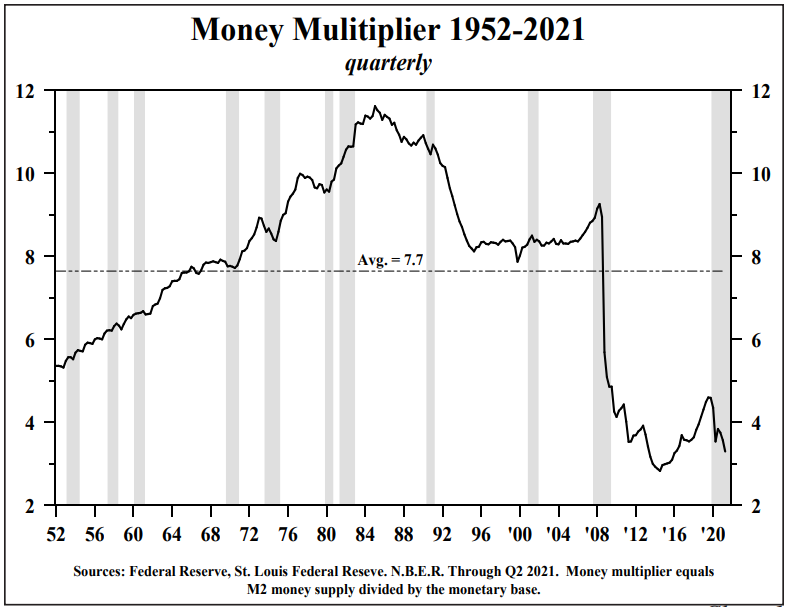
  • The Money Multiplier is the Money Stock (M2) divided by the Monetary Base,
  • It is referred to as “m”,

m = M2/Monetary Base

It is important to appreciate that the Money Multiplier is higher for bank loans than bank investments in securities. We will come back to that fact in a moment.

As the chart to the right shows is the Money Multiplier has fallen dramatically since the 2008 financial crisis which mirrors the growth in US Inequality (above).

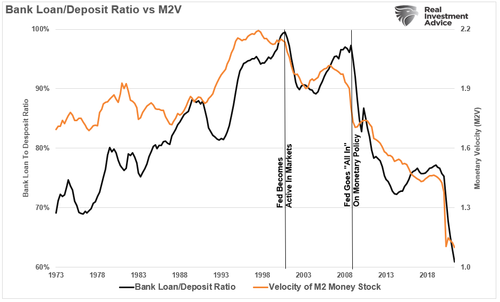
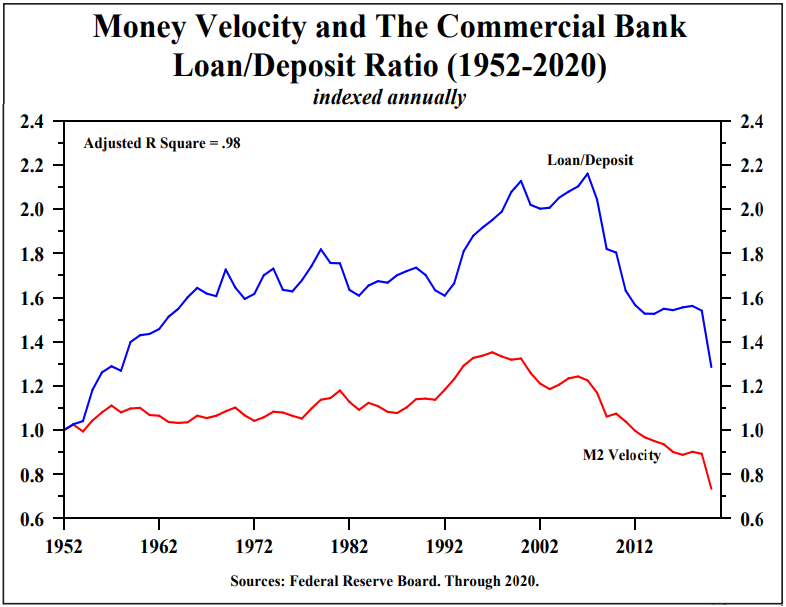
It is interesting to note that both also mirror the collapse in Bank Loan to Deposit Ratios. All correlate with a drop in M2.


This would suggest that due to the banks not lending in sufficient scope the money multiplier isn’t stimulating economic growth sufficiently. But this is the stock of money growth not how effectively or the rate at which it is being employed. For that we consider the Velocity of Money.
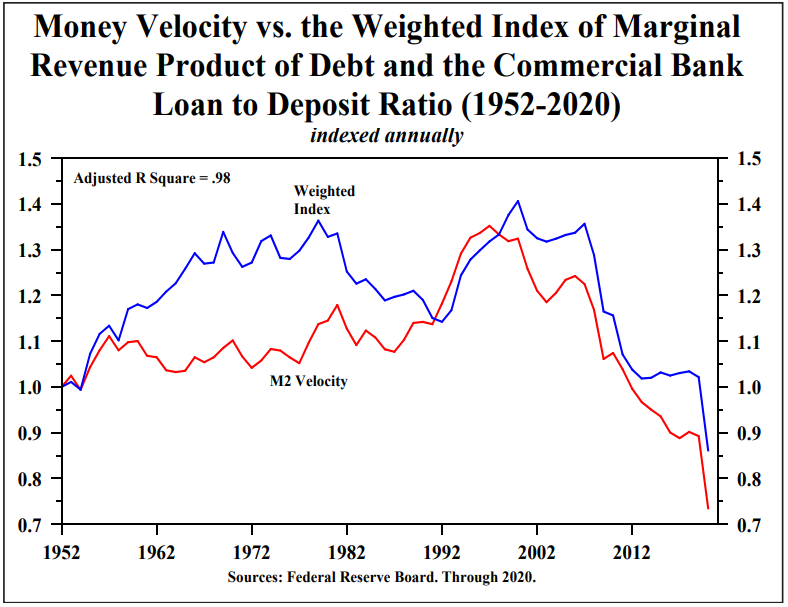
SECONDLY: MONEY VELOCITY

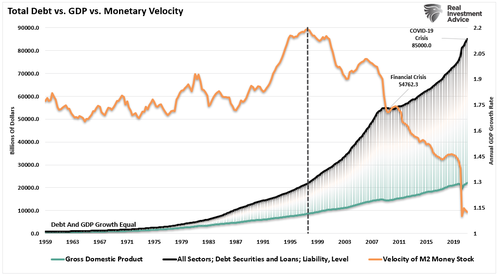
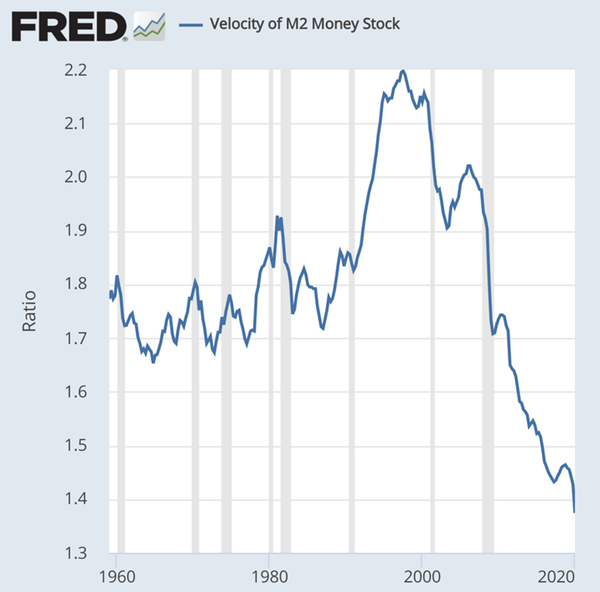
Money Velocity is different than the Money Multiplier. it measures the rate of use of the money actually created:

  • Money Velocity (VoM) = Money Stock (M2) divided by GDP (or Aggregate Demand) or
  • GDP = Money (M2) X Velocity (VoM)

The VoM has been dramatically plummeting since the Dotcom bubble burst and China entered the World Trade Organization (WTO). The shift of the US manufacturing and industrial base to China has had a profound impact on the US’ Economic vitality and Velocity of Money.

As a consequence it has also shifted the thinking of smart money to where real wealth can be created! Banks and Crony Capitalists have found a more lucrative game. The game of living off cheap money and government debt!


THIRDLY: MARGINAL REVENUE PRODUCT

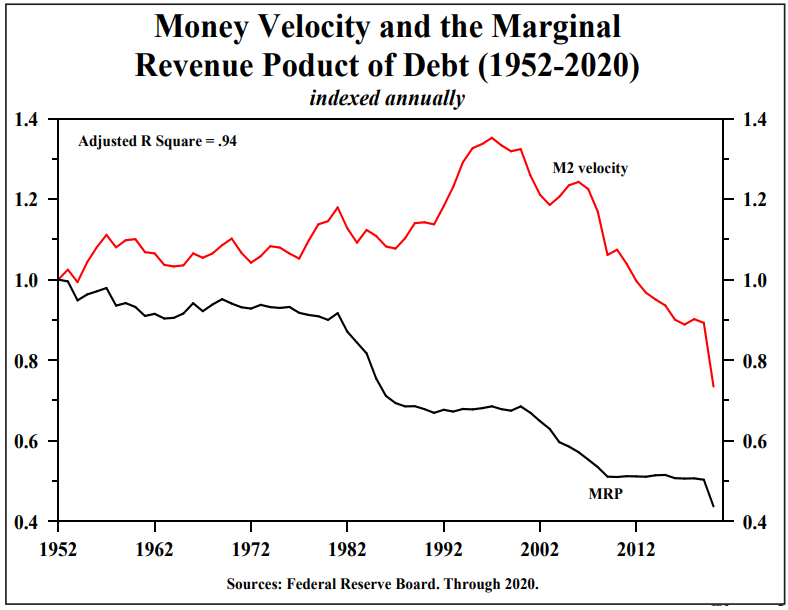
The reality today is that more government debt stimulus is not working as it once was expected to do and therefore the creation of government debt does not necessarily impact the broader economy (“Mainstreet”) to anywhere near the same degree it now impacts banks, shadow banks and financiers (“Wall Street”)! Using debt for fiscal stimulus is effectively now the equivalent of pushing on a string. and can be illustrated by what is referred to as the Marginal Revenue Product (MRP).

MRP = The amount of GDP created by an additional Dollar of Debt

MRP = Delta GDP/Delta Dollar Debt

A RISKY LENDING ENVIRONMENT

With rates kept artificially low by the Federal Reserve, along with a relatively flat yield curve the lending spread has become borderline problematic. The concern of lenders about their Risk Premium has been compounded by a weak economy and the obvious fact that corporations, consumers and governments at all levels have historic levels of debt and leverage on their balance sheets!

The US chart to the right is mirrored on a global basis. 20% of major Corporations are now “Zombies” which is the new reality for banks, financiers and the top 1%

So how have they been making such wild profits in a low rate environment??

SOME SIMPLE ARITHMETIC

THE LAW OF BIGGER NUMBERS

Prior to the financial crisis, bank profits depended on each bank holding a productive loan portfolio, with the result that banks minimized their excess reserves.

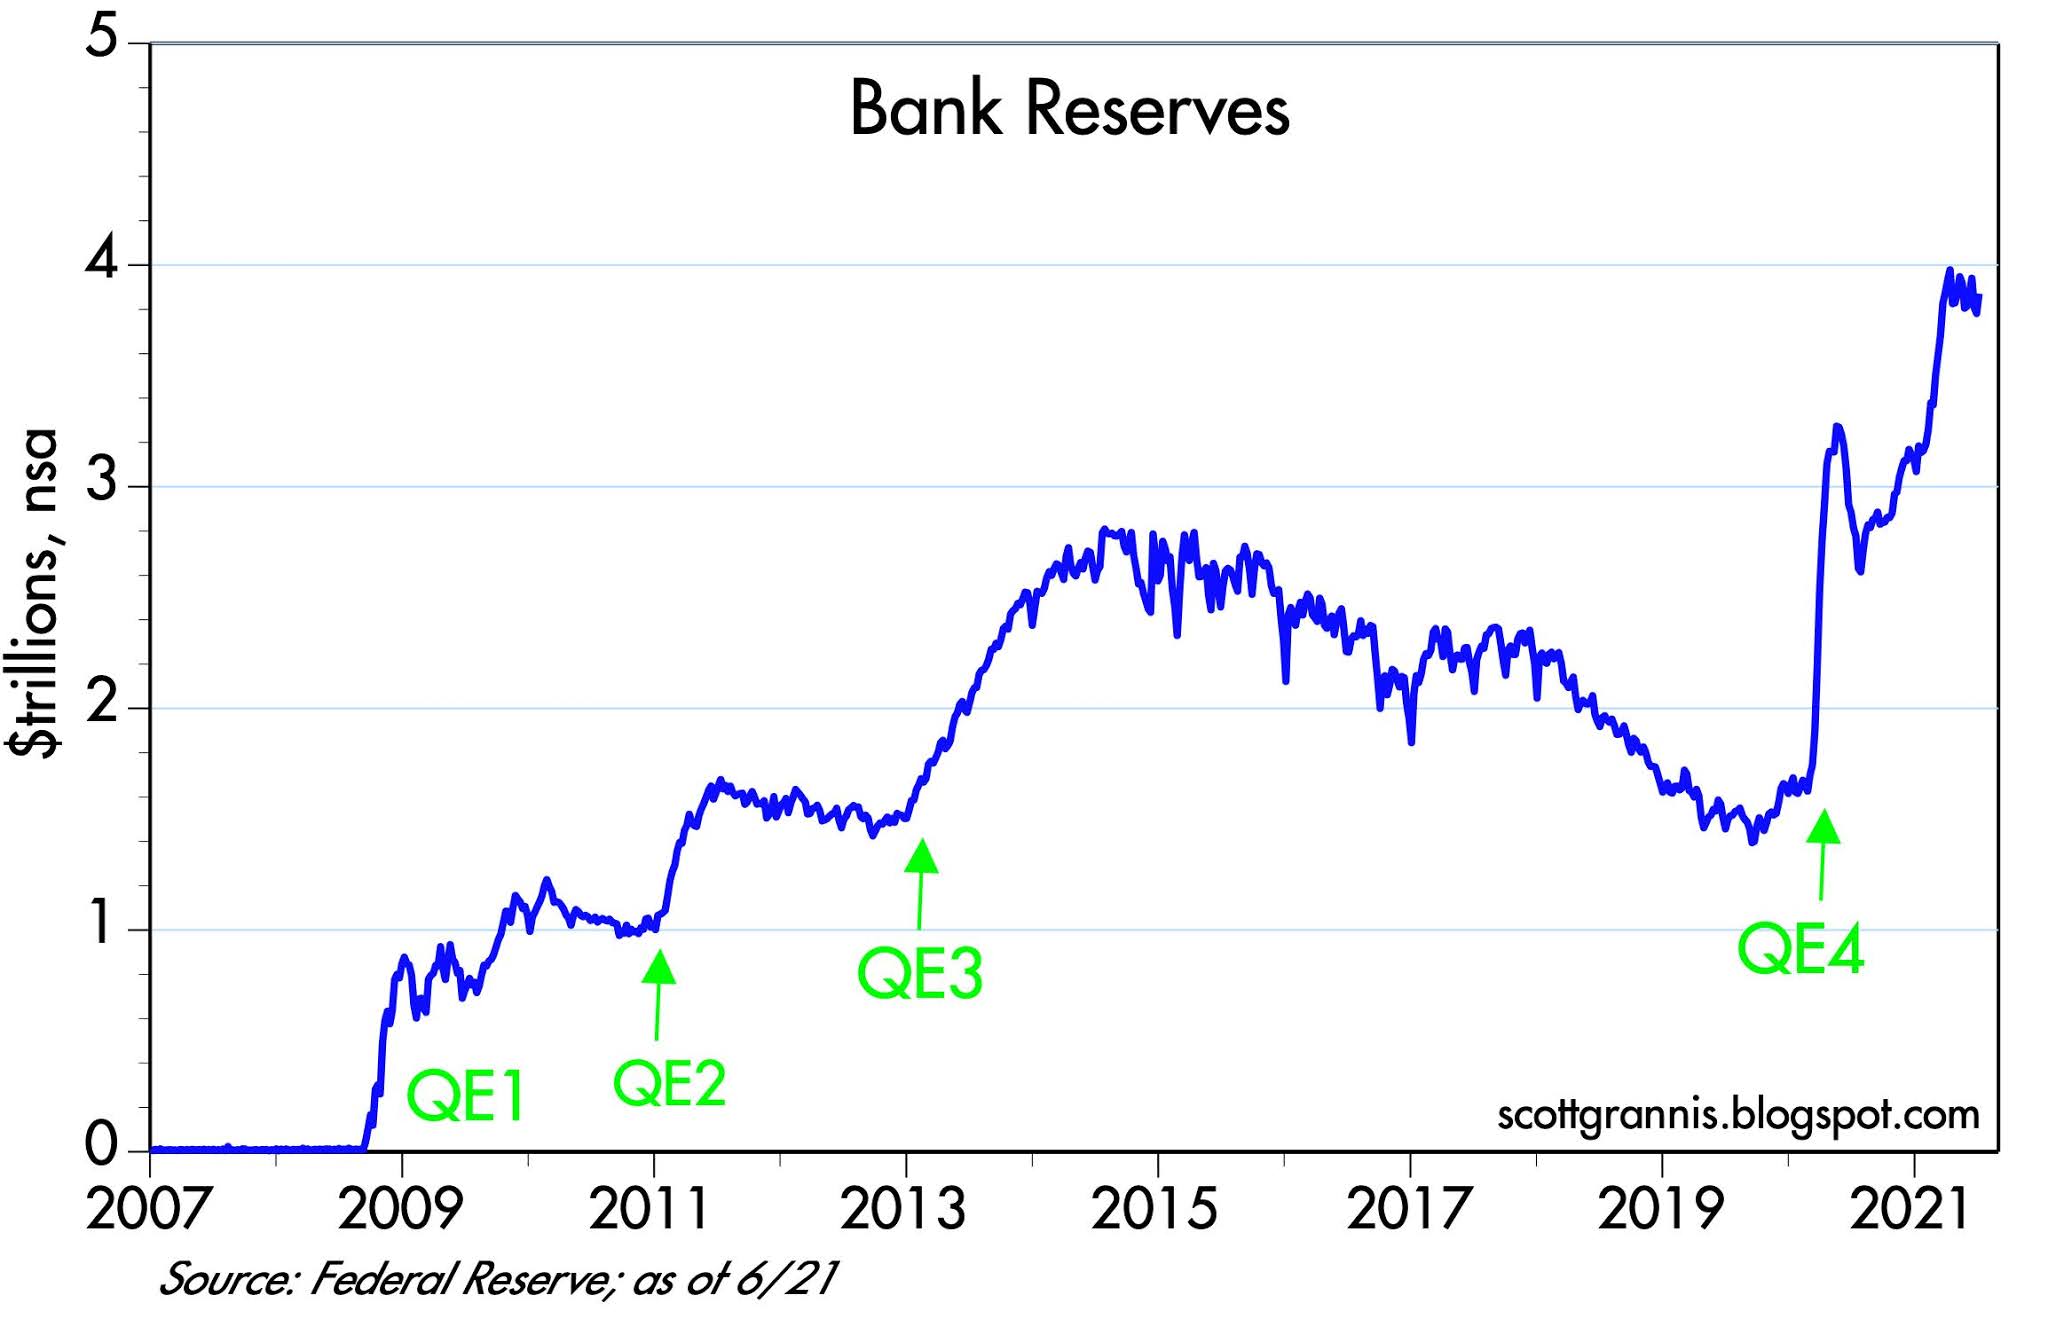
Starting in late 2008, the Fed began to pay interest on reserves, providing banks risk-free income as an alternative to lending, which had suddenly become far riskier (growing percentage of Zombie corporations and leverage used). The Federal Reserve’s interest rate on reserves (IOER) was 2.5%, significantly more than what banks were paying on most checking accounts.

Banks, Shadow Banks and the Wealthy as a result couldn’t can’t get enough of this easy money as the chart to the right (top) shows

With rates paid by the Fed on excess bank reserves 2.5% it may seem like a minor anomaly, but here is the slight of hand. What is 2.5% of $4Trillion?

ANSWER: $100B Net

This is risk free, guaranteed and issued as a credit to the banks excess reserve account. To put this in perspective the net earnings of the US five largest banks is expected to be by the end of 2021 less than $160B with growing loan loss reserves.

With these profits assured and zero bound rates the banks were willing to lend to primarily those who could leverage cheap money without taking on traditional risk. This normally meant those living off government contracts, have revenue guarantees and the already wealthy with solid collateral wanting to take on calculated market risk and cleverly reduce taxable income. The result has been that the rich got richer while “mainstreet” effectively got chocked from the money spigot.

BUT NOW THE FED HAS CHANGED THE RULES FOR THE BANKS!

The Fed reduced the interest it paid on reserves to 0.1% in early 2020, but recently raised it to 0.15%. Once the Fed stops paying interest on these huge ‘buffer stocks’ of bank reserves, the Fed felt the banks would be more incentivized to lend them out knowing if this did happen inflation would be expected to skyrocket.

But this is not happening!! Why not?

The answer is banks now see Inflation and will lose money if projected real returns will be below their required risk premiums. The Fed is using inflation to reduce future the value of future obligations. It is exactly the opposite for lenders. They loss by lending into a future Inflationary environment. Banks additionally see slow growth which means more defaults and loan loss reserves.

In our recent video entitled “The Great Stagflation” we spelled out the seriousness of Stagflation and how we are below the “Event Horizon” as a result of misleading economic Inflation and Growth numbers. (see graphic below)

CONCLUSION

IMHO the banks see they are on the cusp of a huge Debt for Equity swap and want the lending power to be quickly available in an approaching illiquid environment.

HOW WILL THE FED FIGHT INFLATION GOING FORWARD? ( … yet still protect Bank Risk Premiums?)

Once inflation becomes omnipresent, the only way to fight it will be for the Fed to tighten the money supply by raising interest rates generally throughout the economy. High interest rates will choke off investment and might trigger new real estate and stock market crashes.

The problem now is the minute the Fed realizes it needs to worry about inflation, it will become obvious that it has painted us into a corner. Discretionary Fed policy has limited the range of how it can respond to inflation in the future. In response to each development since the 2007 financial crisis, the Fed has repeatedly opted for policies with short-term benefits while disregarding the very real long-term costs. To fight inflation the Fed normally takes money out of the economy but after four rounds of Quantitative Easing, to sell bonds though Open Market Operations (OMO) it would drive bond prices down and yields up thereby stalling growth. If the Treasury issues more supply (which can be expected to do) this will further ignite the fires of lower prices and higher yields for Bonds.

The U.S. economy has now entered unexplored territory, though this territory has unhappy similarities with Revolutionary-era hyperinflation, Civil War inflation of the 1860s, and the stagflation of the 1970s. None of these historical experiences were something anybody would want to relive.

“We believe we have reached a structural change in inflation. Part of that is driven by public policy, but part of it has been driven by capital markets and ESG mandates.

The enormous emphasis on investing in often money-losing businesses in disruptive areas like technology has left traditional industries starved for growth capital. The result is they haven’t grown capacity and now they cannot meet demand. The more these “value” stocks are starved of capital, the higher prices are likely to go and the longer the inflation is likely to last.

And this doesn’t even begin to address the rising cost of labor. Currently, there is a labor shortage and there are approximately 9 million open jobs according to the latest government data. In the coming months, unemployment benefits will be cut. This will drive some of the unemployed back into the workforce. Deflationists believe it will be enough to end the labor shortage. However, since people can collect benefits without being required to look for work, it is unclear how many benefit collectors are happy to receive benefits, but have no plans to rejoin the labor force. It will take time to determine how much of the labor shortage is structural.

We know what the President wants – if you are having trouble finding enough labor, “pay them more.” Sounds like a wage inflation policy to us.

As for the Fed policy response, the market seems to think that by simply noticing inflation and, perhaps, making modest changes to monetary policy, inflation will be brought under control. But what if what’s needed isn’t merely tinkering? Reported inflation last month annualized at a double-digit rate. What if the need is an immediate end of quantitative easing and a rapid increase in rates? The so-called Taylor rule4 says the correct Fed funds rate today would be about 5%.

David Einhorn – Greenlight


FOLLOWING DETAILED ANALYSIS IS SUBSCRIBER CONTENT ONLY

Subscribe to view full post content with supporting live charts
 

FAIR USE NOTICE  This site contains copyrighted material the use of which has not always been specifically authorized by the copyright owner. We are making such material available in our efforts to advance understanding of environmental, political, human rights, economic, democracy, scientific, and social justice issues, etc. We believe this constitutes a ‘fair use’ of any such copyrighted material as provided for in section 107 of the US Copyright Law. In accordance with Title 17 U.S.C. Section 107, the material on this site is distributed without profit to those who have expressed a prior interest in receiving the included information for research and educational purposes.  If you wish to use copyrighted material from this site for purposes of your own that go beyond ‘fair use’, you must obtain permission from the copyright owner.


NOTICE  Information on these pages contains forward-looking statements that involve risks and uncertainties. Markets and instruments profiled on this page are for informational purposes only and should not in any way come across as a recommendation to buy or sell in these assets. You should do your own thorough research before making any investment decisions. MATASII.com does not in any way guarantee that this information is free from mistakes, errors, or material misstatements. It also does not guarantee that this information is of a timely nature. Investing in Open Markets involves a great deal of risk, including the loss of all or a portion of your investment, as well as emotional distress. All risks, losses and costs associated with investing, including total loss of principal, are your responsibility.