![]()
Welcome to MATASII.com!
CONTACT US
general contact & administrative:
[email protected]
personal messages:
Gordon T Long
[email protected]
Andrew J.D. Long, MFTA
[email protected]

Now Available!
Gordon’s 2020 Thesis: GLOBAL CONFLICT
Click here to go to the Thesis download page.
Dear Valued Members!
The site will be going through some updating this spring. The same great research and information will continue, however we will be doing a little restructuring and trimming.
If you have any thoughts or suggestions, things you’d like to see, let us know! All requests will be considered seriously!
The goal is to make the site more user friendly; focusing on any relevant current events, as well as relations to the Key Dates and Gordon’s yearly Thesis.
There is a lot of information across the site at any given time. Our objective with the update is to try and focus this more for you and provide a more cohesive “train of thought” across the site.
Thank-you for your patience as we go through some changes!
Tutorials and information pertaining to site use.
We Take Requests! Have a security or index you like to watch and we aren’t doing it? How about MACRO info. you’d like to see more of? While we can’t guarantee we will be able to fulfill all requests (Tradingview charts and time may limit us), we do take all requests seriously.
Something you’d like to see? Have constrictive criticism? Or just want to say hi and chat? Please feel free to contact us in general or individually – we’d love to hear from you!
CURRENTLY WATCHING
LATEST POSTS
 COVID-19
Market Impacts
 STAGFLATION
Shift of Value
 GLOBAL RECESSION
Investing in a New Trend
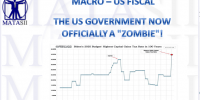
- THE US GOVERNMENT NOW OFFICIALLY A “ZOMBIE”!
April 29, 2024 - Under The Lens: MAY 2024 PPV Promo
April 26, 2024 - IN-DEPTH: TRANSCRIPTION – LONGWave – 03-10-24 – APRIL – Economic Stagnation Will Soon Turn to Stagflation
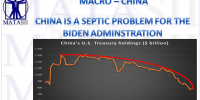
April 24, 2024 - CHINA IS A SEPTIC PROBLEM FOR THE BIDEN ADMINSTRATION
April 22, 2024 - CHINA IS A SEPTIC PROBLEM FOR THE BIDEN ADMINSTRATION Copy
April 22, 2024