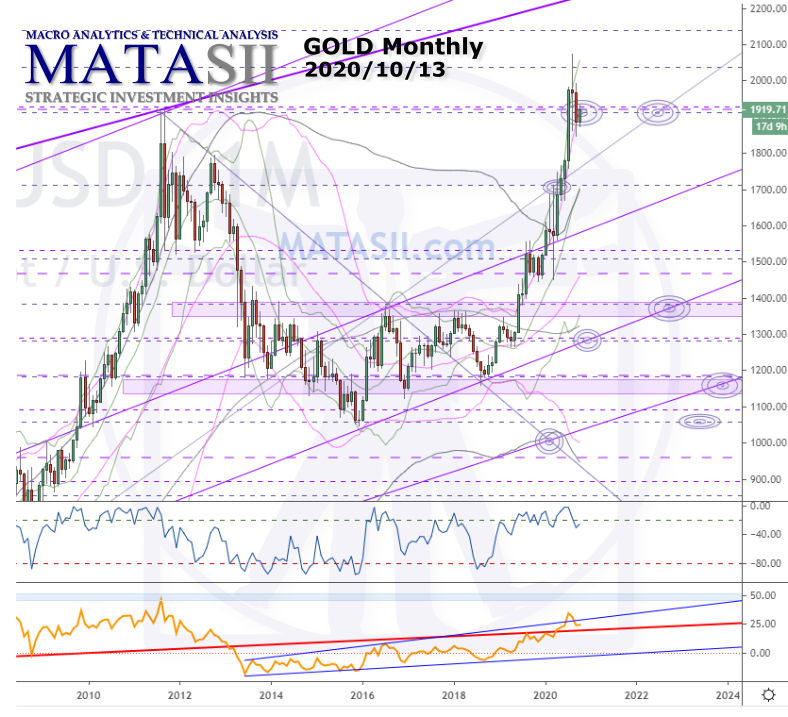
TRIGGER$ Technical Analysis Market Road Maps | HPTZ Methodology COMMODITIES Gold Previous Monthly Previous Monthly Updates: Chart initially created 2019/08/11. Below you can see previous updates as we followed the market; last image below is the current market as of 2020 10 13. Previous Weekly We also offered a weekly perspective, with potential market moves […]
Trig TA Charts
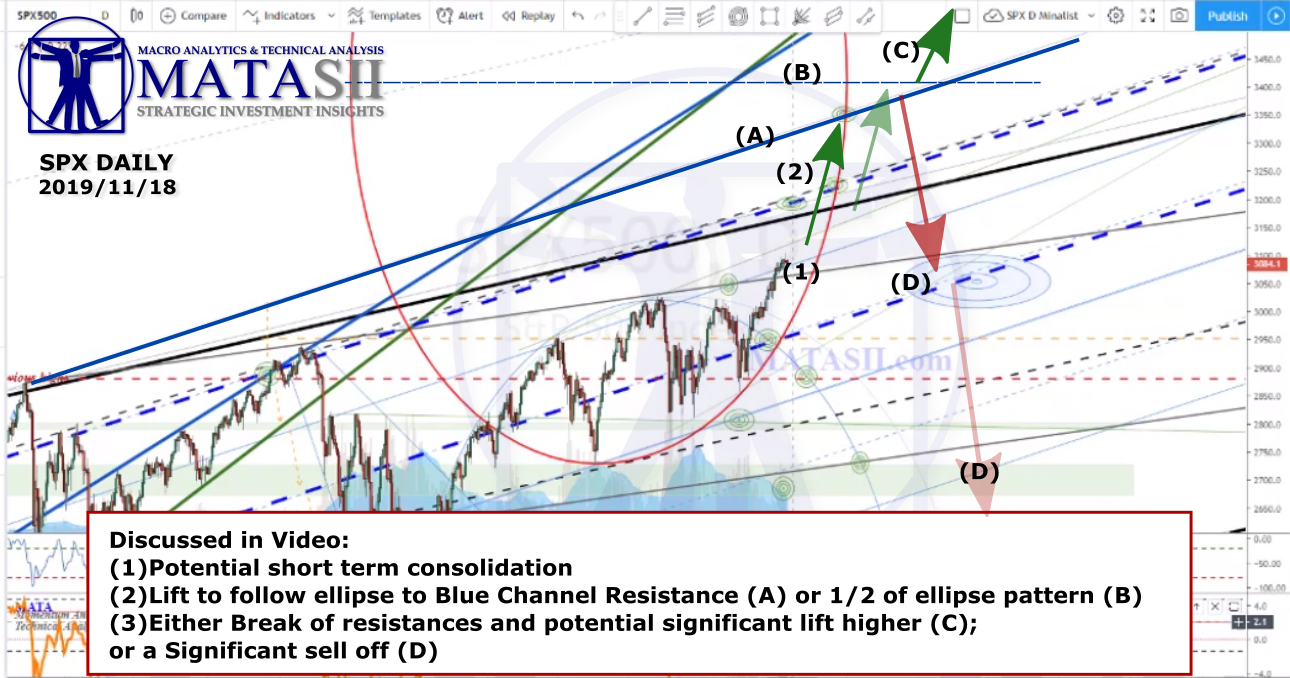
SPX Update – Technical Alert
Economic & Technical Analysis for the Active Trader Technical Analysis Market Road Maps | HPTZ Methodology Extensive Technical Analysis and Market Road Maps for major indexes, commodities, and FOREX. The High Probability Target Zones Methodology (HPTZ) is used to locate significant supports / resistances, patterns, break-out opportunities and other technicals of importance. The method creates a market “road […]
GOLD Hits 8 Month Target
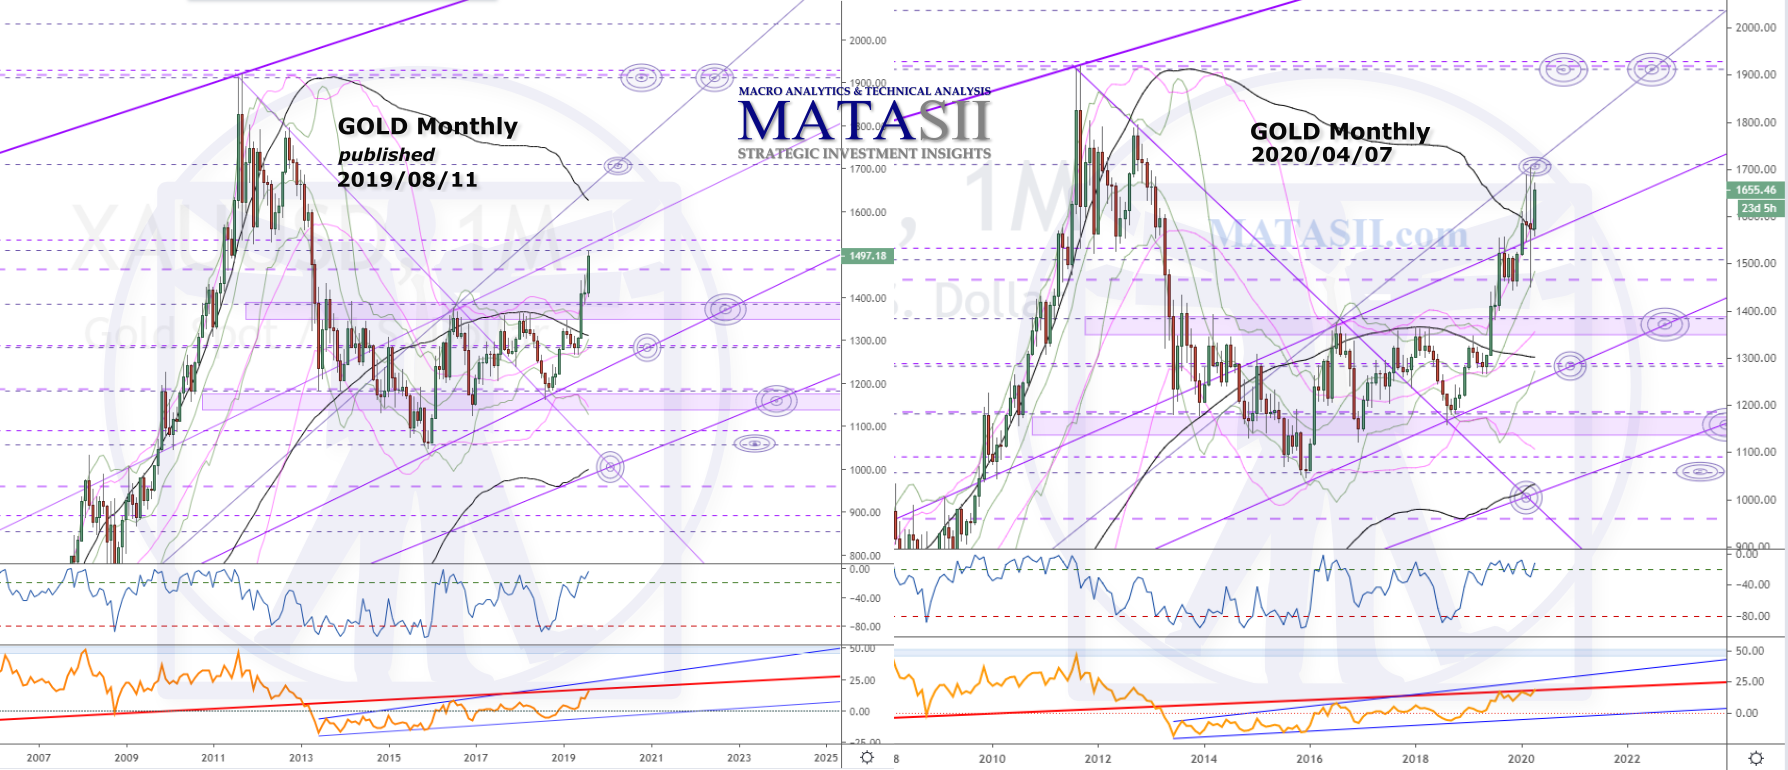
TRIGGER$ Technical Analysis Market Road Maps | HPTZ Methodology COMMODITIES Gold Previous Monthly Our last technical update for Gold (Aug 11th, 2019) offered the monthly chart below (left) for consideration. The current view (right) shows the market holding and bouncing around between significant technicals previously identified; then breaking resistance and lifting in to a target […]
OIL Dump Captured, What’s Next?
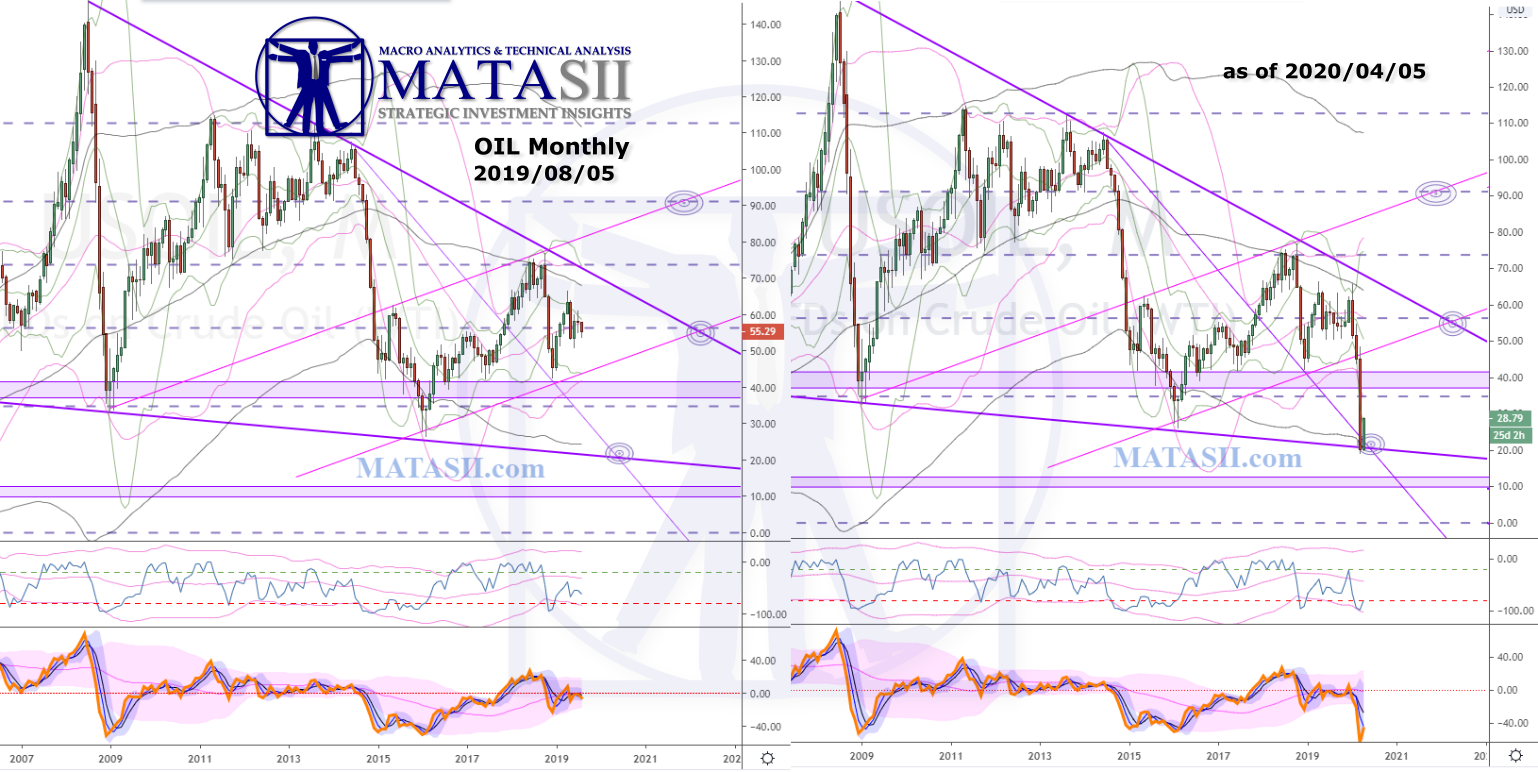
TRIGGER$ Technical Analysis Market Road Maps | HPTZ Methodology COMMODITIES Oil OIL DUMP CAPTURED: Our previous oil update (Aug 5th/2019) can be seen on the left, with the current market on the right. At that time, the market was sitting on a significant Fib ratio, inside an obvious wedge or triangle pattern. There were only […]


