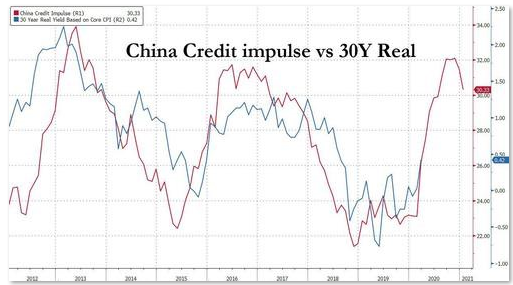
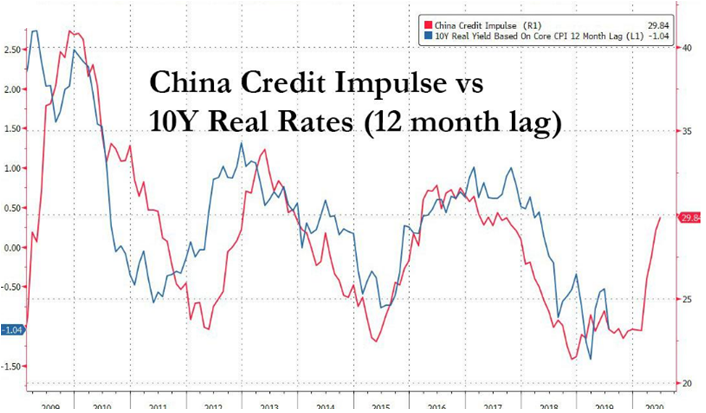
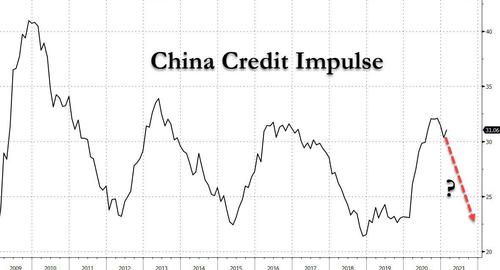
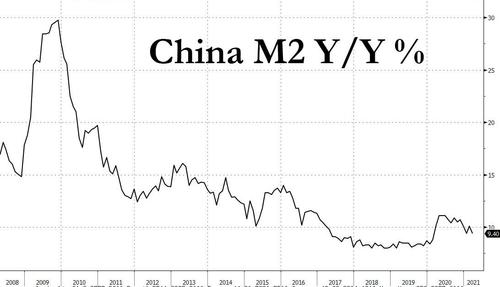
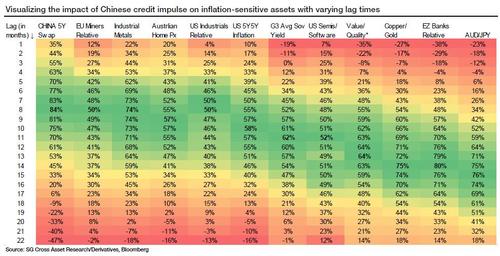
The table above shows the correlation between different assets and Chinese credit impulse for varying lag times. The extent of the differences between lags in correlations is exemplified in the left-hand chart below. While peak correlation for Chinese interest rate swaps arrives with an eight-month lag, the peak correlation for euro-zone banks manifests itself with a lag of 14 months (read more here “
In Historic Reversal, China’s Credit Impulse Just Peaked: What This Means For Global Markets“).
Looking ahead, with high correlations and short lag times, Chinese interest rate swaps and industrial metals should be the first assets to be adversely impacted by the topping of the Chinese credit impulse. Australian house prices and US 5Y forward 5Y inflation will likely also be hit in this first group.
The mining and industrial sectors also have short lag times, but their correlation is slightly lower. The other highly correlated group of assets, including euro-zone banks, also gets strongly affected by credit impulse, but the rather large lag time opens the door for other factors to influence the price action of these assets as well.
Low correlation with certain assets suggests that Chinese credit, while being one of the drivers, may not be the main driver of price performance for these assets (e.g. semis/software ratio, sovereign yields in the West and value/quality ratio).
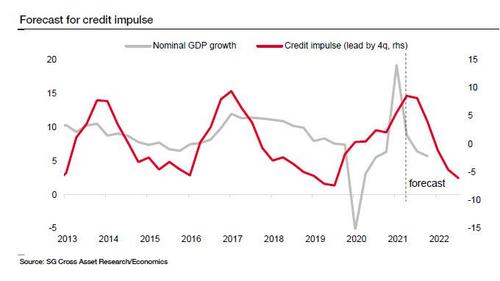
In the chart below, SocGen provides a critical estimated timeline of the peak Y/Y performance for each of the assets it sees as impacted by China’s credit impulse slowdown. While these assets are influenced by multiple factors and therefore could easily diverge from expectations, the chart below does present a neat output from a lagged regression analysis and is a useful guideline for the balance of this year and next.”
 We have been arguing that though Inflation pressures are clearly with us, many of the underlying drivers are associated with bottlenecks in the ‘just-in-time’ (no inventory) global supply chains restarting from Covid-19 lock-downs. Though these transitory factors will begin to moderate in late Q2 and Q3 2021, Y-o-Y comparisons from the extreme lows during the initial Covid lock-downs will dramatically distort increases in actual ongoing rates of inflation. The shock of Inflation is not over but will nevertheless moderate in Q4 at around ~2.2-2.4% as concerns with Disinflation takeover. We want to explain this shift will mean across assets so you can prepare your investment thesis early.
