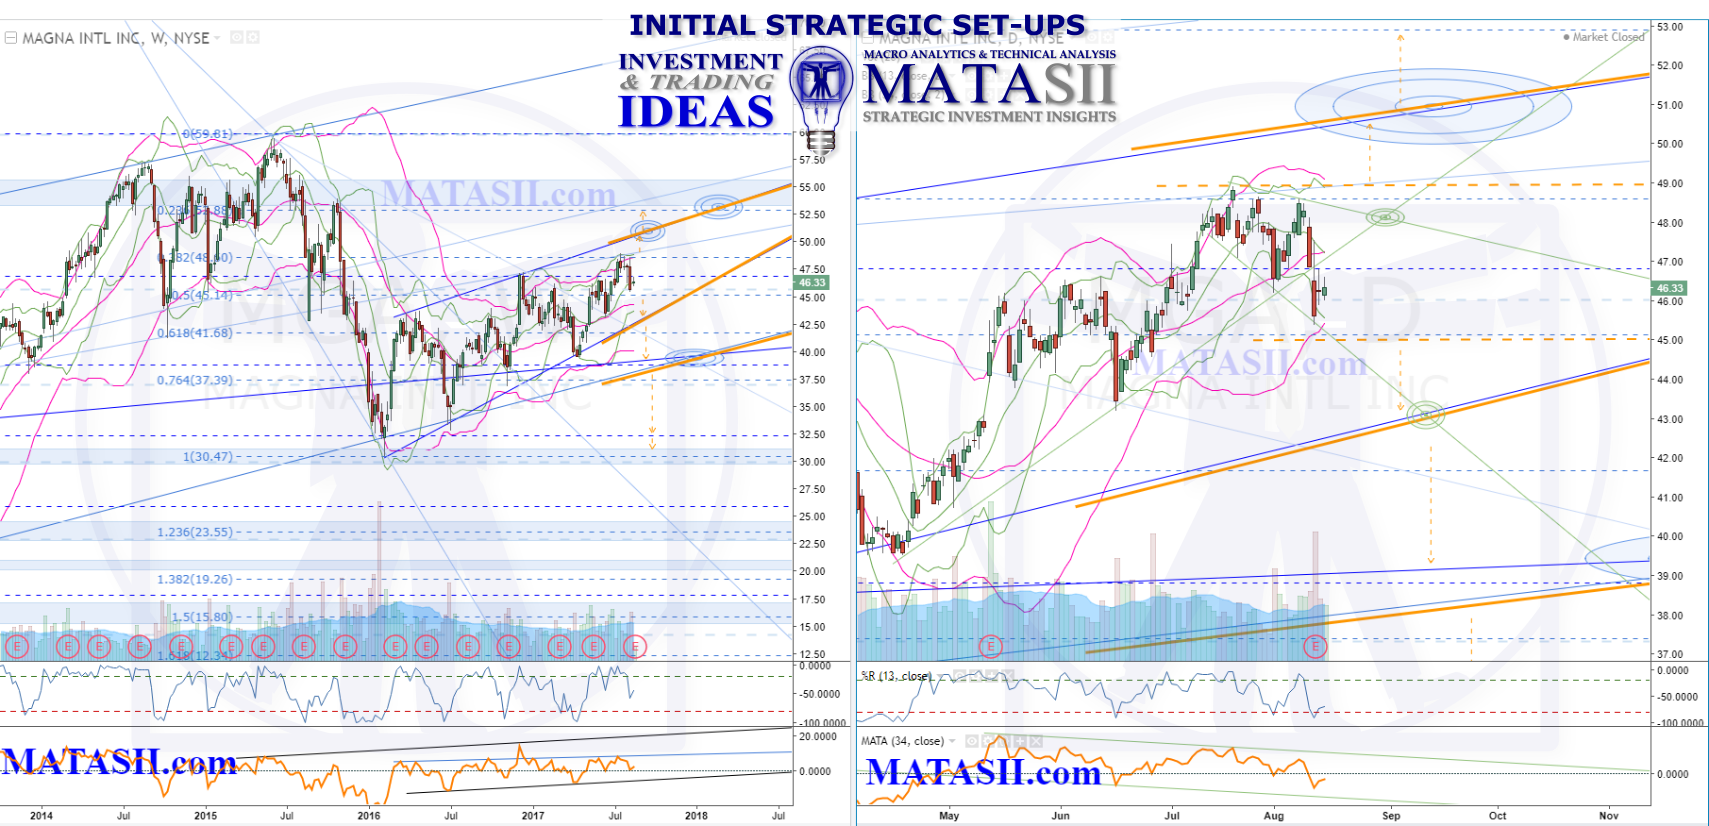
Watching for expected weakness in the auto sectors, the current technical set-up for MGA is below. A potential double top can be seen on the weekly chart (left), with the market then dropping off in to 2016. Since then a slightly contracting wedge consolidation has developed: breaking this structure offers potnetial opportunities. Solid orange highlights the structures s/r's (support/resistance), orange dashed arrows offer potnetial moves to consider. The daily chart (right) shows a couple riskier considerations: dashed orange highlights. These are inside the larger structure and offer a potnetial move to the structures s/r's. They are considered a little more risky however as the main pattern could still hold and potentially reverse the market.