IN-DEPTH: TRANSCRIPTION - Q1 2019: SII UPDATE
COVER
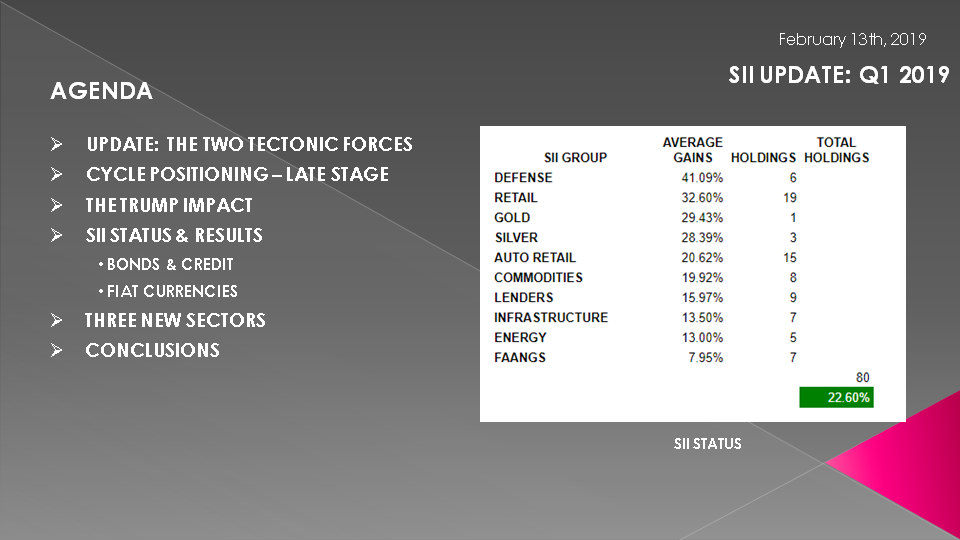
AGENDA
SLIDE 5 - TECTONIC FORCES
I thought it important that we revisit some of the scenarios we outlined in last year's Q1 SII Update to see what we can learn and possibly conclude.
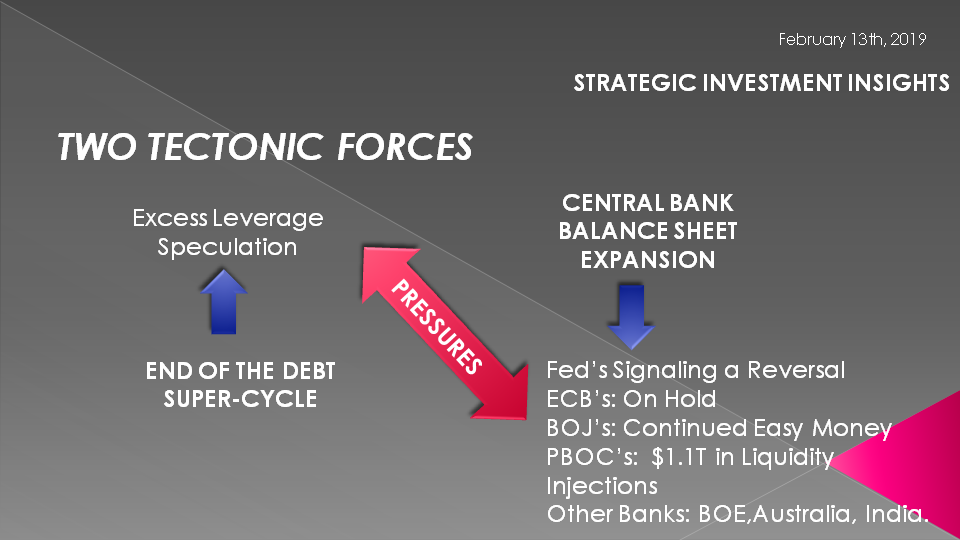
The first is our regular update discussion on the two major Tectonic Forces at play within the Global Financial Markets.
The forces of the End of the Debt Supper Cycle versus the forces of the Global Central Banks, now trapped in counter competition.
Last year we were witnessing the Central Banks all in the process of various stages of ending easy credit and tightening to various degrees.
In our opinion this would only quicken the pace of the natural process of the ending of the Debt Supper Cycle.
We knew it couldn't last and would be nothing more than like tapping your breaks while driving on ice - try to slow but not put the car into an uncontrolled skid and sudden crash.

SLIDE 6
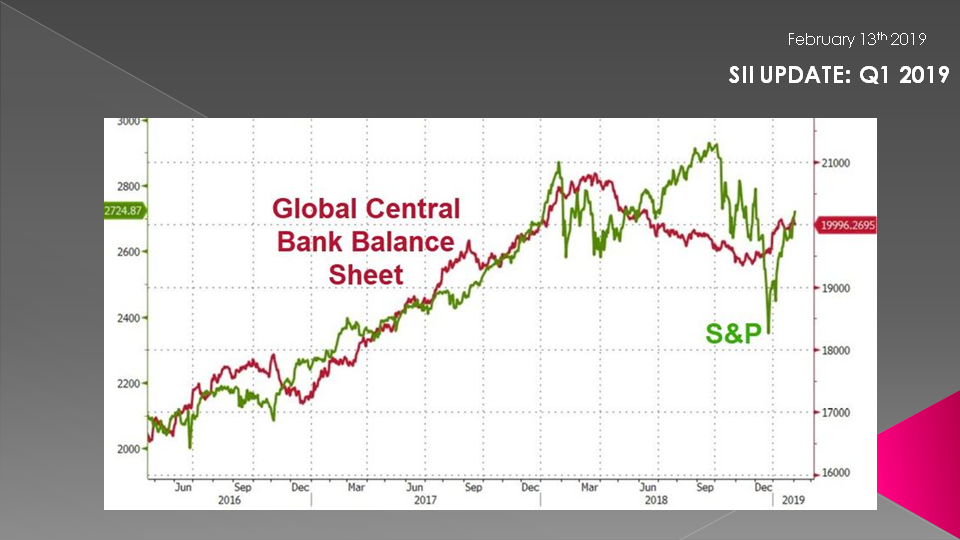
What a year makes!
The market volatility in Q4 2018 was simply too much for the Fed and and other central banks to handle. The worst December since 1931. We have witnessed the Federal Reserve reverse its position in and unprecedented and historic fashion as almost all central banks have stopped tightening, reversed directions or accelerated easy money.
SLIDE 7
The markets have reacted accordingly with an unprecedented and historic recovery in January since 1987, resulting in temporary stability. The Christmas Eve Mnuchin Massacre was what it took to call the central bankers into coordinated actions.
SLIDE 8
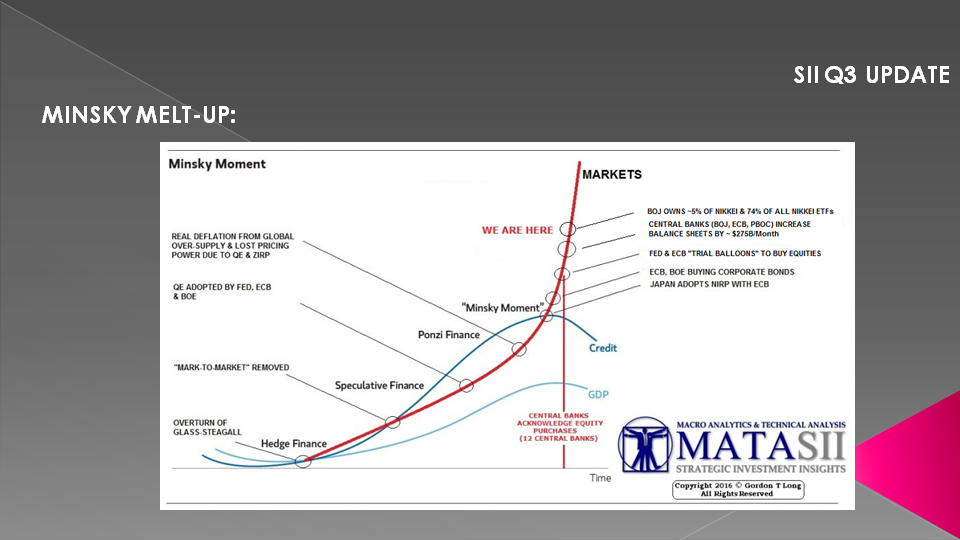
Last year we said we were in the early stages of a potential Minsky melt-up when we updated this chart we have been using since the Fed's Taper program was announced.
SLIDE 9
We have updated the chart.
The credit cycle and GDP cycles have reversed but the markets have not - other than a temporary blip in Q4!

SLIDE 10
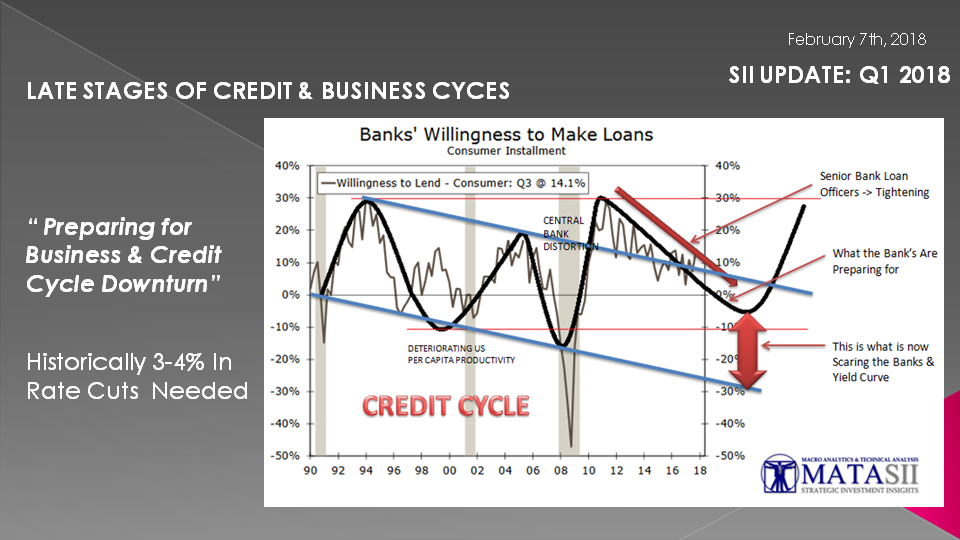
We showed this chart a year ago. It said the credit cycle reversal was beginning and the banks were preparing for it. I have always found that the banks are one of the best indicators to watch. When they start battening down the hatches you should also!
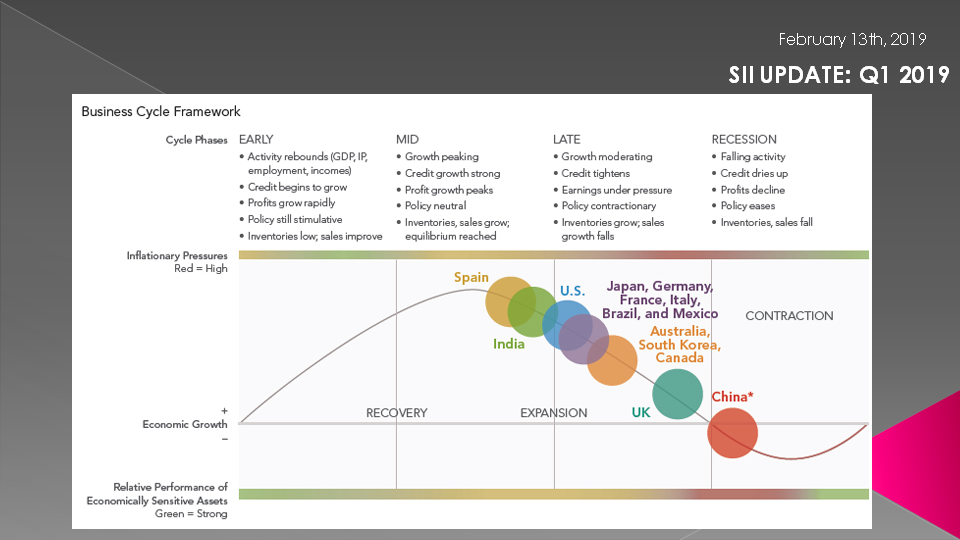
SLIDE 11
Well a year later we have got clearer evidence, much of which we have shared with you in previous presentations in 2018.
.... Like the advancement in the turn in the Business Cycle...
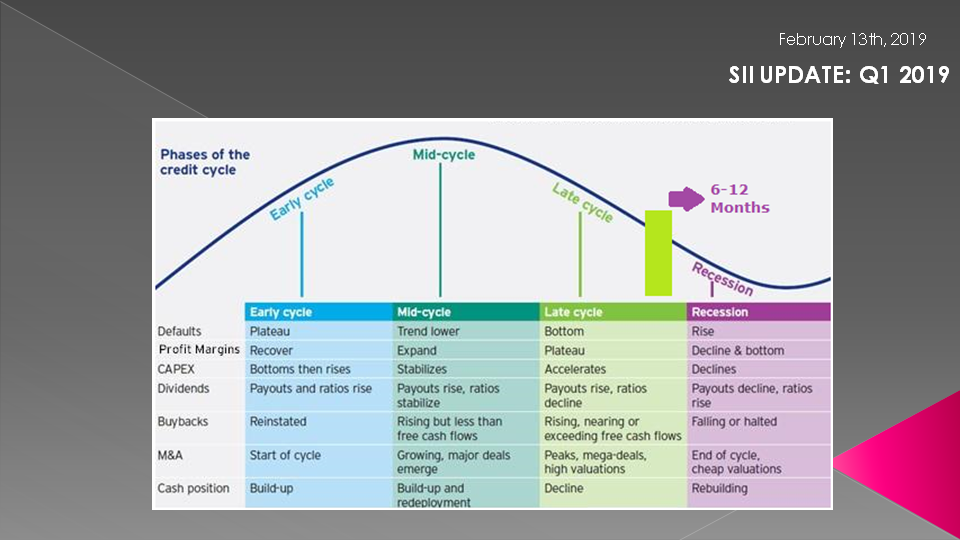
SLIDE 12
..... the late stage shift in the Credit Cycle...
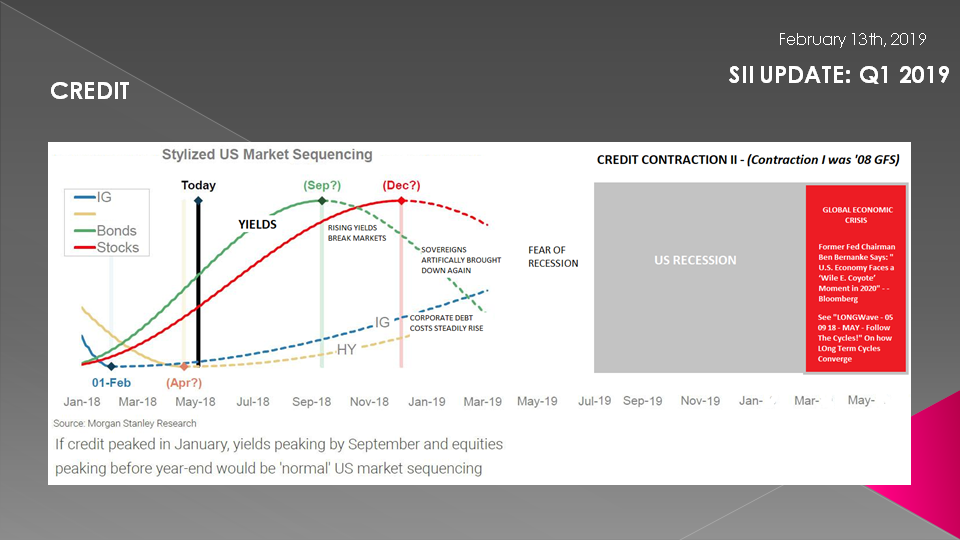
SLIDE 13
... the timing of shifts in various elements of the credit cycle - which our predictions turned out to be extremely accurate.
SLIDE 14
We have seen the banks tighten lending with their willingness to lend (shown here) also falling quickly.
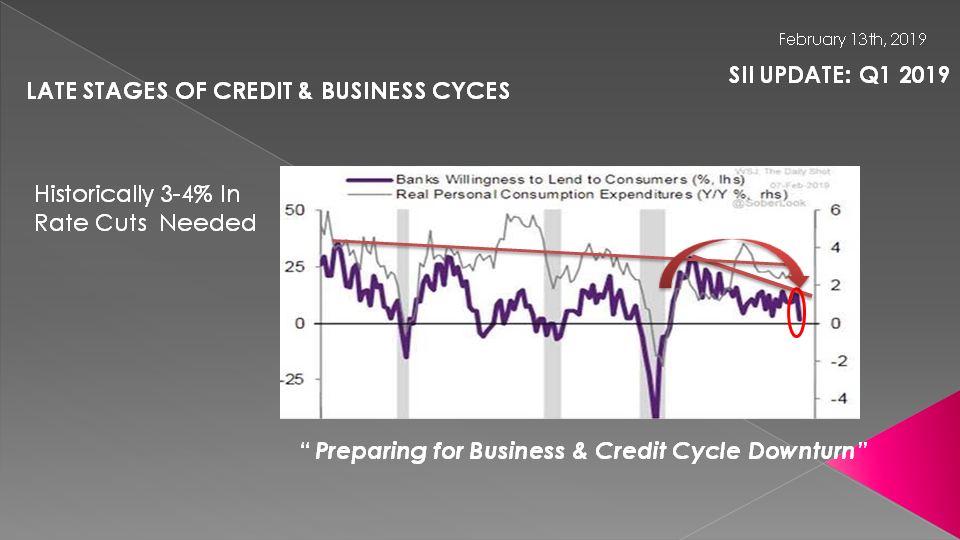
SLIDE 15
What is very telling is that the Primary Dealers (or the Money Center Banks) have become the dominate purchaser of US Treasury Bills, Notes and Bonds. This normally only occurs for three reasons
1- Their is a serious concern about liquidity and banks are preparing accordingly,
2- Foreigners are not buying sufficient US Treasuries at the auctions (I refer you here to our 2019 Thesis paper: De-Dollarization)
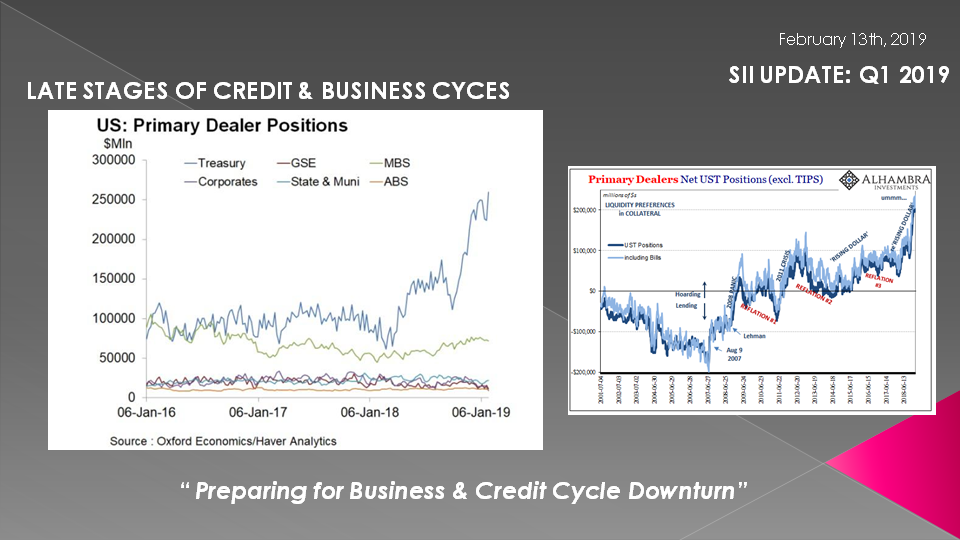
SLIDE 16
and
3- Banks are expecting a downturn in the Markets or Economy or Both.
We actually may be witnessing all three presently occurring.
- Companies "don’t go and distribute cash to their shareholders in the form of buybacks or dividends if they have good investments to make of a long-term capital nature."
- The surge in Bank payouts underscores that banks have limited opportunities to keep expanding their businesses profitably. So, they’re pumping out cash.
- Additionally, as Primary Dealers their hoarding of UST's has now taken on ABSOLUTELY IMMENSE PROPORTIONS since Q4 2018,
- We know Dealer holdings follow the rhythm of the Euro$ squeezes.
- Maybe there really is no one to buy all these UST’s piling up on exposed dealer balance sheets?
- It now seems only a matter of time before the Fed not only ends its balance sheet unwind, but proceeds with QE4 in order to fund America's gaping budget deficit.
- However, whereas a new QE may be sufficient to monetize debt under normal conditions, it is unclear if even the Fed would be able to step up and monetize the tens of trillions in new debt that will have to be issued over the next few years should Ocasio-Cortez "Green New Deal" with its multi-trillion price tag, ever become a reality.
THE LOOMING $5.9T BIG KAHUNA
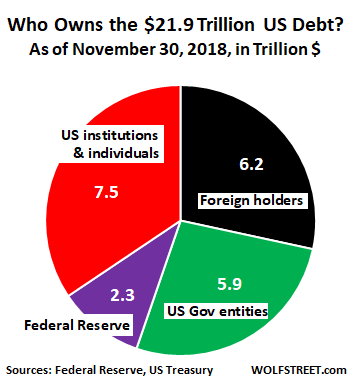
THE PROBLEM IS THE $5.9T IN BONDS HELD BY "US GOV'T ENTITIES' THAT MUST BE PAID OUT -- NOT 'ROLLED OVER'!!
WHAT LIES AHEAD
- Foreigners can be expected to sell at ever increasing rates as De-Dollarization advances,
- US Banks can't handle any more Treasuries without dramatically increasing excess Reserve payouts by the Fed and
- The Unfunded Pension Tsunami will completely, and VERY SOON consume the US Treasury's ability to fund US governmental needs.
- The EU Labor productivity growth has been almost non-existent over the past decade or so with almost all of the EU issues having to do with Supply-Side problems. An EU Banking Crisis Looms on the Horizon.

SLIDE 17
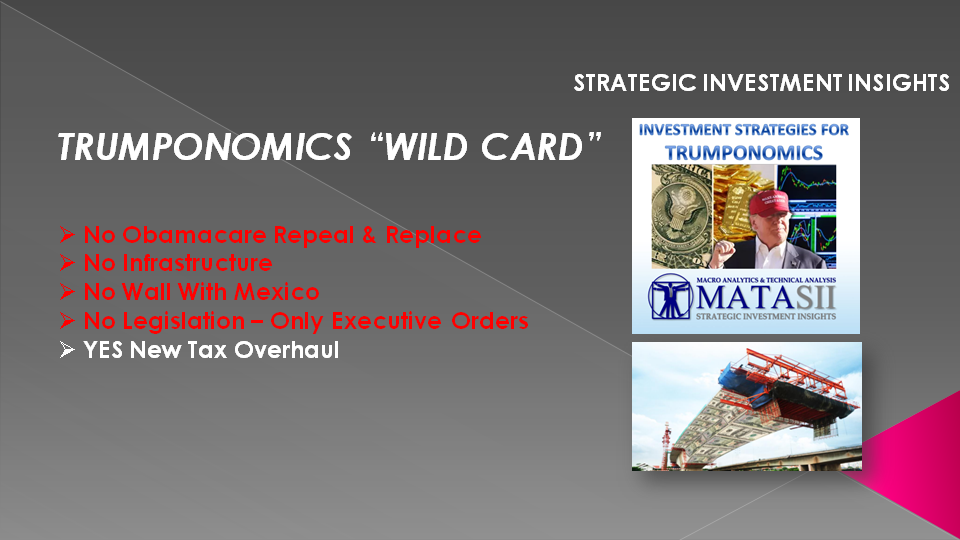
Last year we discussed Trumponomics and what he had realistically achieved or maybe more appropriately described as what Congress had limited him to being able to change.
He had actually achieved a lot in terms of regulatory changes, business confidence, attracting business back to America, the beginning of renegotiating trade deals but the real achievement was "Tax Reform".
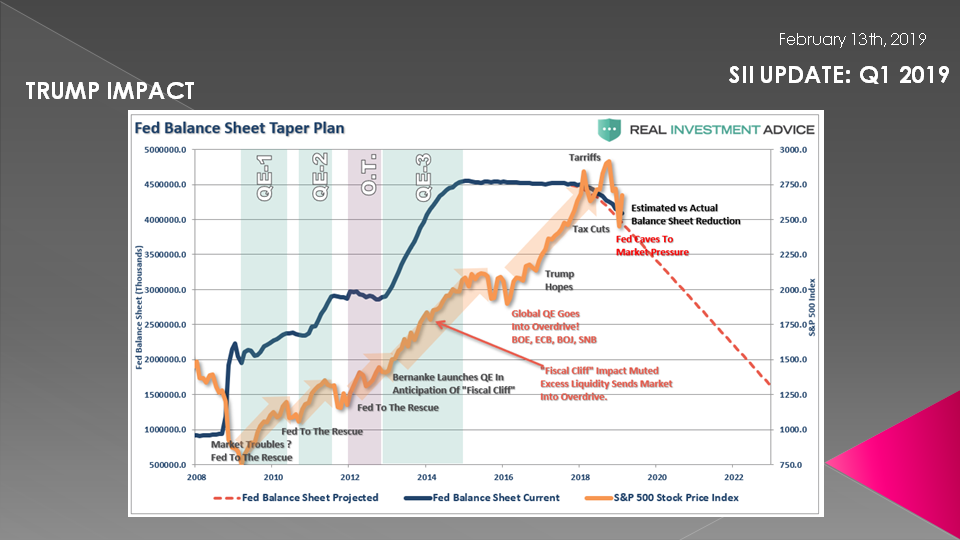
SLIDE 18
... as such, as can be seen here we , we saw a "sugar high" from those tax relief gains as we began 2018.

SLIDE 19
But 2018 turned out not to be a continuation. But rather clearly a market that ran out of steam and was setting the stage for reversal.

SLIDE 20
This however was no longer about Trump but rather about the Global Central Bank Tightening efforts to fend of the end of the Debt Supper Cycle. What Kondratieff or the Long-Cycle calls the "Winter" stage.
SLIDE 21
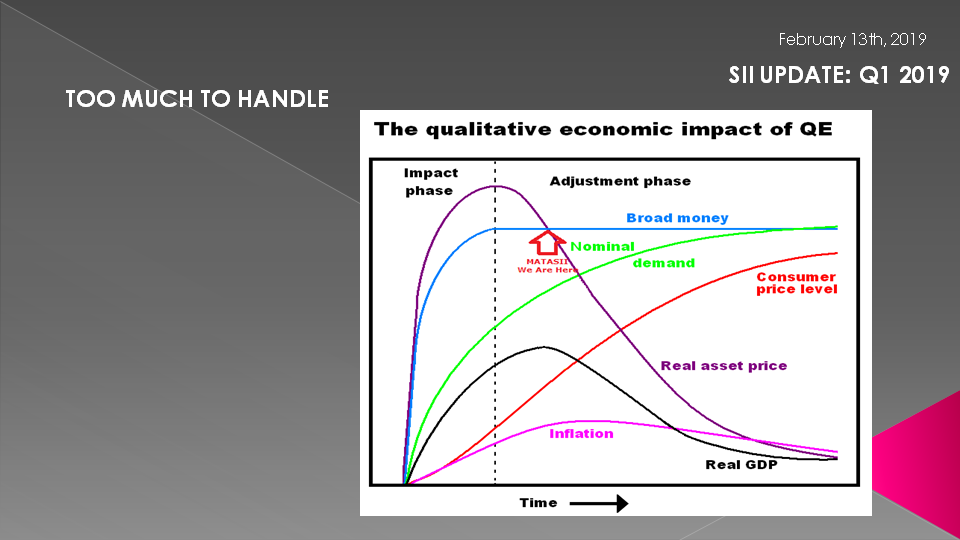
What we in reality are seeing is the after affects of QE.
QE is fundamentally about increasing demand. That is pulling demand forward through cheaper money allowing demand to expand. Unfortunately, on the other side of pulling that demand forward is a hole. The longer QE - the bigger that hole is!
The only solution is more stimulus (which may temporarily buy more time) or batten down the hatches for the inevitable storm. The Central Bankers have decided on the former after surmising the magnitude of the potential global storm.
SLIDE 22
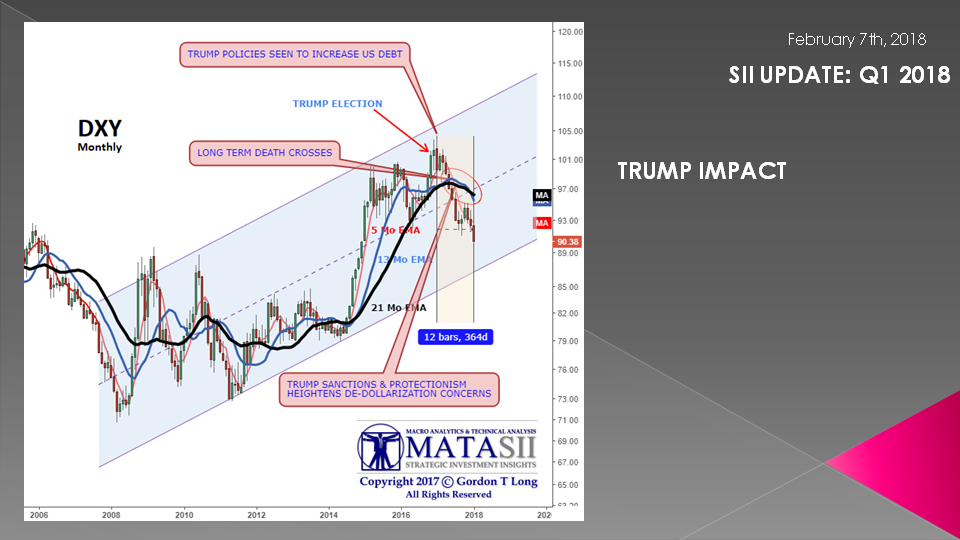
Last year we examined the impact Trump Policies were having on the US Dollar. We can see here that falling his election and the realities of his policies regarding increasing the US Debt - the dollar steadily fell.
In actuality this was good for the global economy as well as US financial assets - making them cheaper for foreign investors.
SLIDE 23
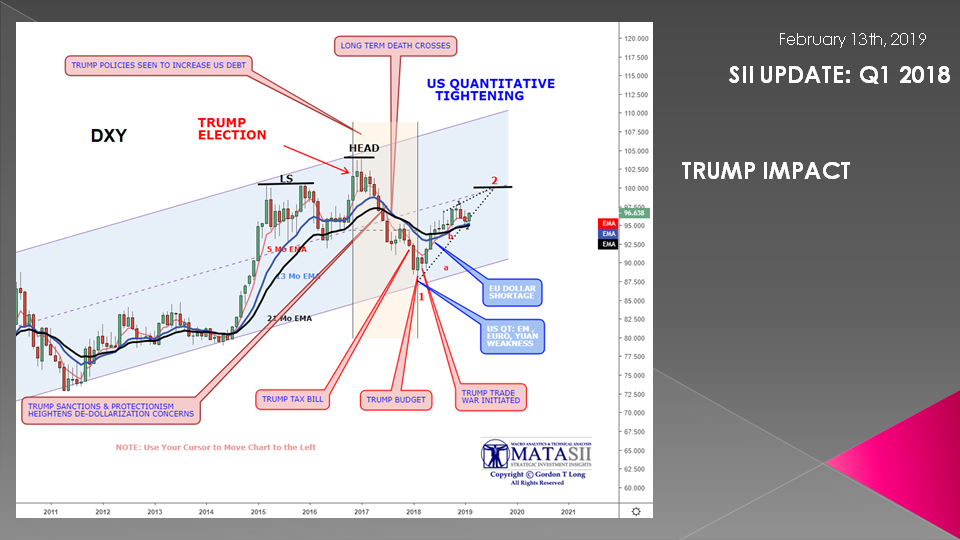
That all changed going into last year as the Federal Reserve implemented its Quantitative Tightening Policies regarding the Central Bank's Balance Sheet as well Trumps Trade battle with China.
Both contributed to a strengthening dollar. The former by reducing the previous effective Currency debasement and the later due to a Flight to Safety.
As this chart suggests we suspect this is all part of an across markets "Right Shoulder".
SLIDE 24
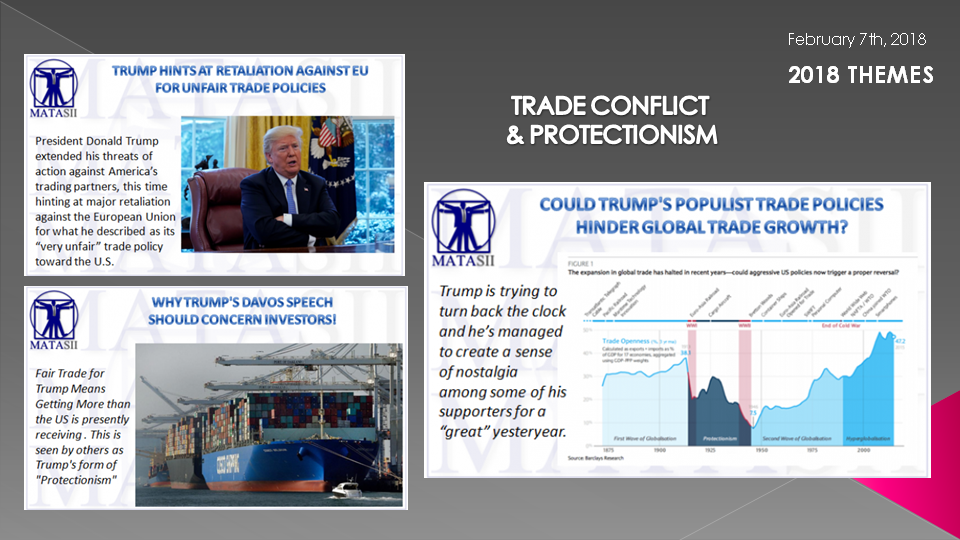
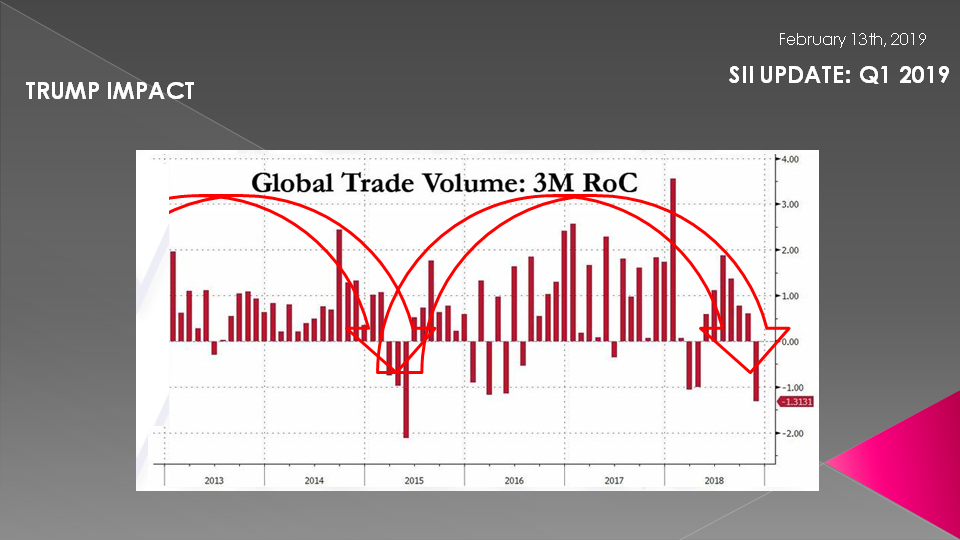
Trump's Trade War which has been as much about threat as the reality of the magnitude of actually implemented Trade Tariffs have had a sobering impact on Global Trade. Corporate CEO's have prepared for the worst.
SLIDE 25
The results (along with cyclical factors) are having a significant impact on Global Trade and GDP growth expectations.
SLIDE 26
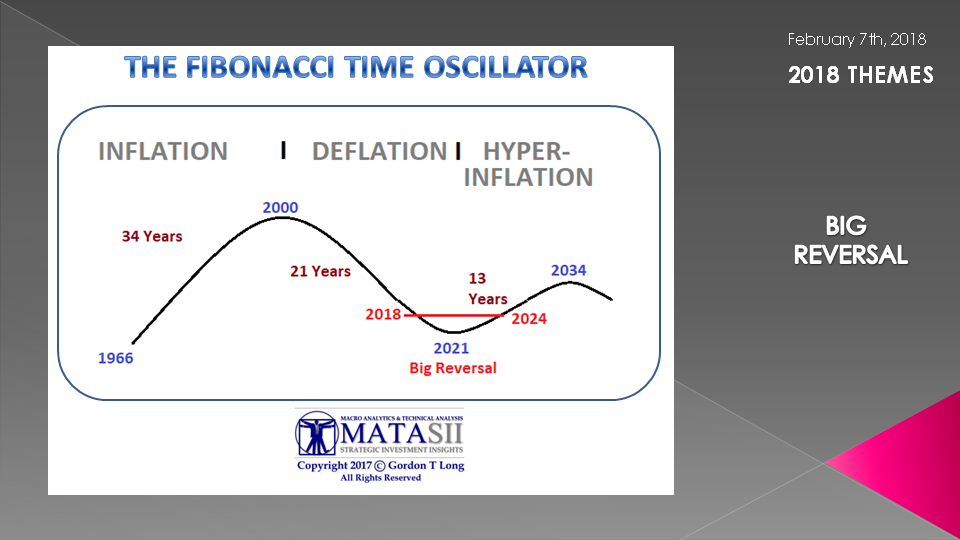
We have discussed in previous video's the Big Reversal we believe we are in the process of going through and this will no doubt play into it. On the other side of more short term deflation has Supply is forced to be reduced will be Price Inflation leading to inflation scare and potentially Hyper-Inflation. Remembering that Hyper-Inflation is first and foremost a Currency Confidence driven issue.
SLIDE 27
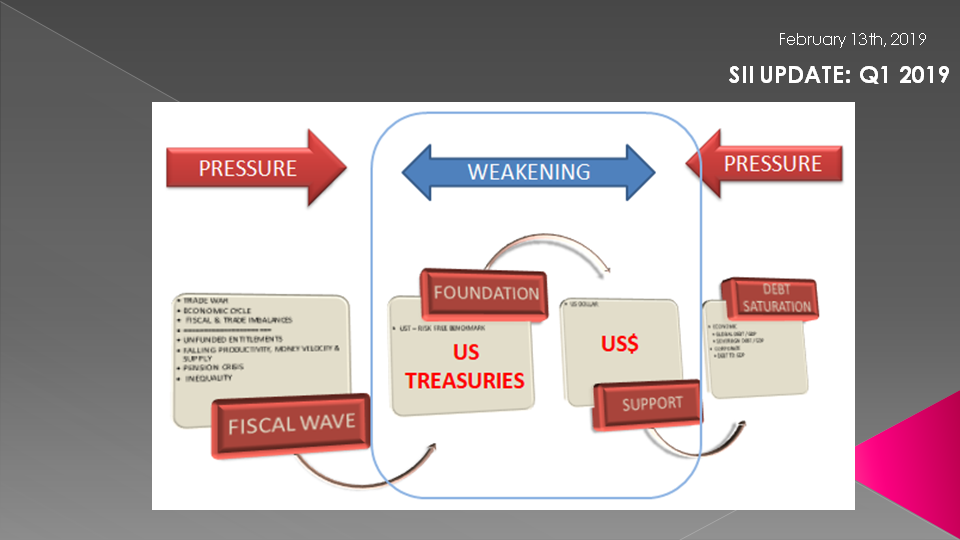
Our De-Dollarization Thesis paper (which this chart is from) lays out the seriousness of the global shift away from the US Dollar. Even small reductions in its global use and need has profound impact on Inflation expectations and the US Economy.
The Fiscal Wave on the left (associated with Underfunded Entitlements, a Pension Crisis, Falling Productivity, Falling Velocity of Money and Shrinking Money Supply) are being met on the left with the realities of Global Debt Saturation. These forces are destabilizing the global financial system which is supported by the dollar and its foundation being the Risk-Free measure of risk - US Treasuries!
SLIDE 28
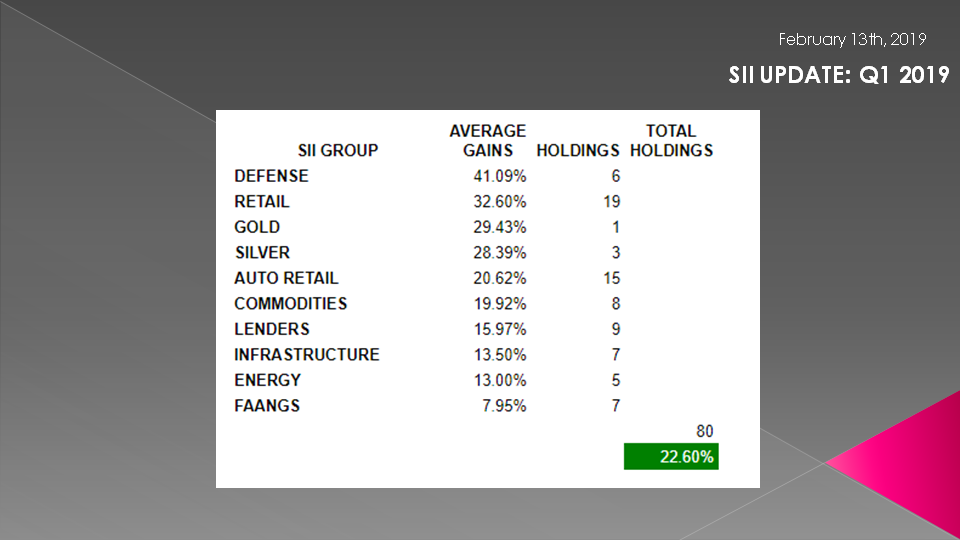
Throughout this chaos our Strategic Investment Insights have performed extremely well.
Currently the 80 members of the approximately 150 SII Watch List have Short or Long Triggers in place.
This does not include the Bonds & Credit nor the Fiat Currency SII.
Both of these have performed extraordinarily well but the profits are about the how investors chose to invest - whether the cash markets, futures, options or ETFs.
SLIDE 29
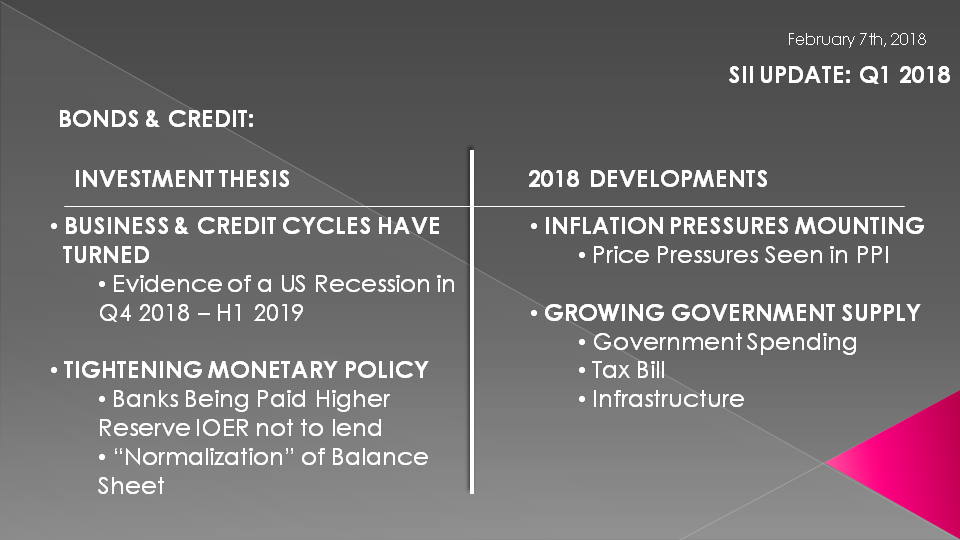
In the Bond & Credit area the movement in High Yield and 10Y Treasury were well identified by our Macro Analytic approach.
SLIDE 30
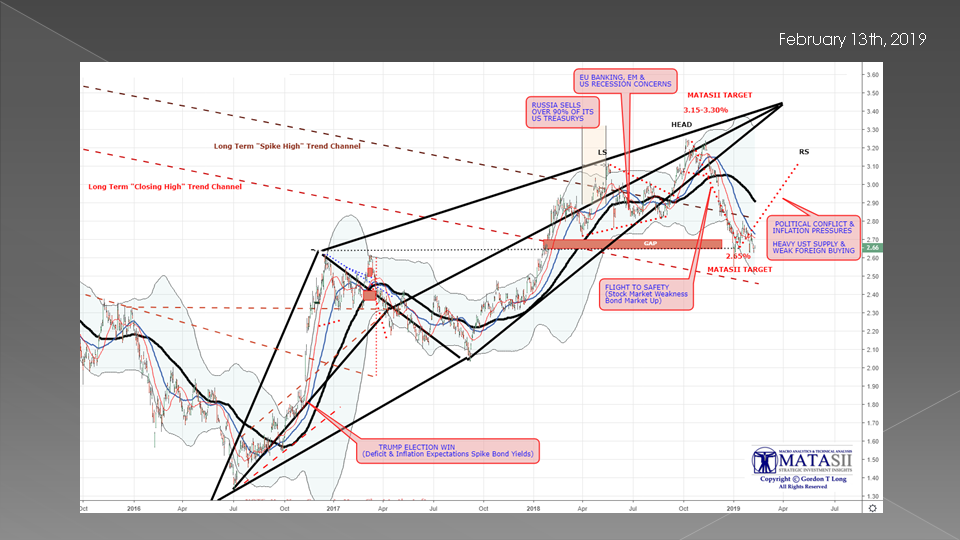
The 10 year UST chart from Q1 2019 showed our projections had been sound as our "Diamond pattern tracked near perfect. We were looking for 2.85 on the UST which we early in 2018 raised slightly higher to 3.15.

SLIDE 31
We actually reached 3.22 (marked here as the "Head" in what we currently see to be a potential Head & Shoulders pattern.
The drop to 2.65 was also well established in advance and posted regularly on MATASII. The "GAP" bar we felt needed to be filled before the Right Shoulder lift could get underway.
2019 will tell whether this is still the correct call.
SLIDE 32
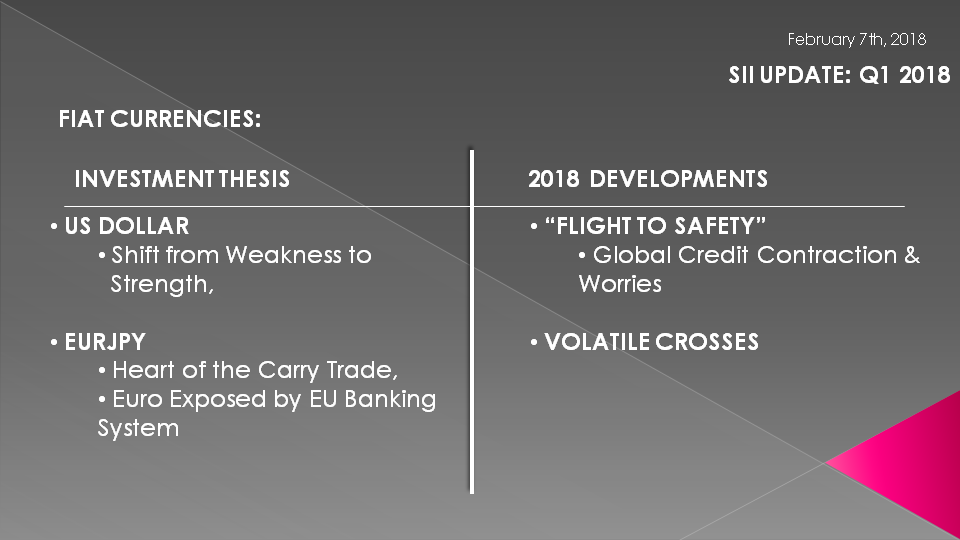
Last year we laid our expectations regarding the US dollar.
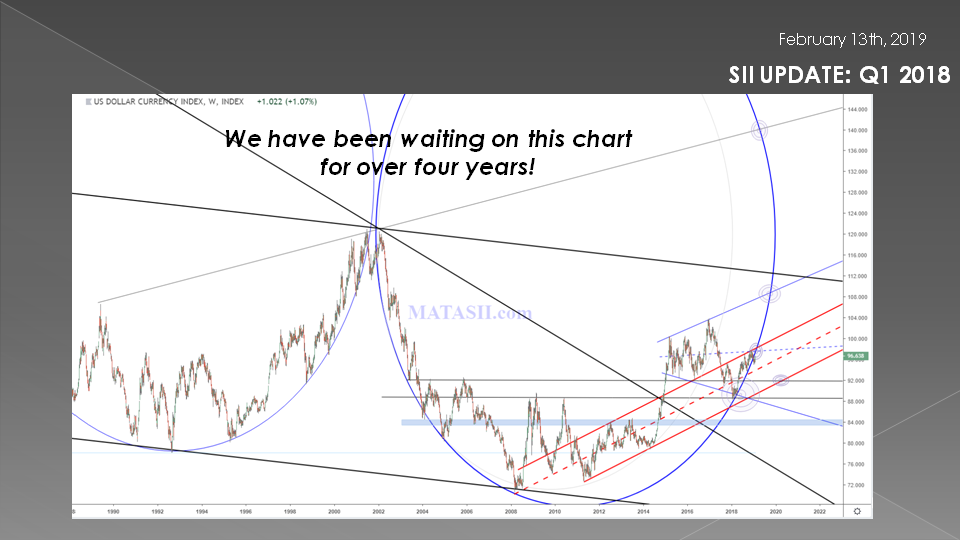
SLIDE 33
It was centered around our expectations that the US dollar would rise along the right side of this ellipse formation towards the upper Red Trend Channel. We were looking for it to hit our circled HTTZ on the Ellipse.We have had this chart in place since we completed the last Ellipse shown on the left.

SLIDE 34
The results have been quite amazing - and profitable for this SII.
We have achieved our HPTZ.
We feel there is more to go in 2019 ....
SLIDE 35
... as we showed on this previous dollar chart with yet another right shoulder drawn in.
It appears the US dollar will reverse sometime in mid 2019 as will the US Treasury Yield.

SLIDE 36
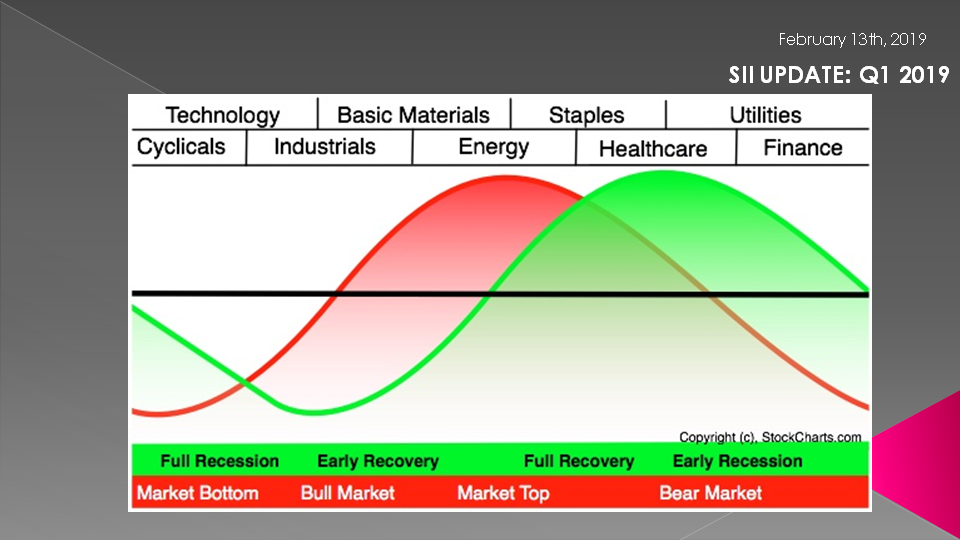
We are nearing the final stages of the Global Credit cycle that will lead to a Recession.
Defaults will start rising, profit margins will decline and bottom, Capital expenditures will decline, Dividends & Ratio will decline, Buybacks will fall or be halted, M&A will decline and Cash flow rebuilds will become paramount to corporations and investors.
As such investors will shift to value and recession proofing.
SLIDE 37
As a result we have added three new SII sectors this year.
- Healthcare
- Utilities
- Consumer Staples.
We are not saying these are going top be the best performers but rather will likely be something that our overall Watch List will show needs to be somewhere in your portfolio based on our Technical Analysis timing tools.
SLIDE 38
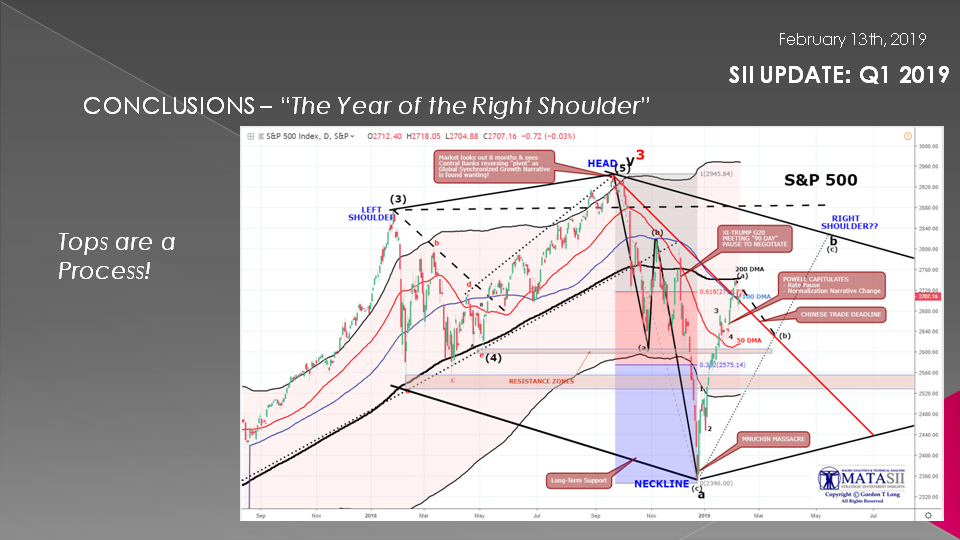
Remember, Tops are a Process. Major tops are often multi-years phenomenons.
We are seeing potential Head and Should formations across equities, currencies, and bonds. As well as Inverse Head & Shoulders in Precious Metals and Commodities.
2019 is likely to be the year of the "Right Shoulder".
SLIDE 39
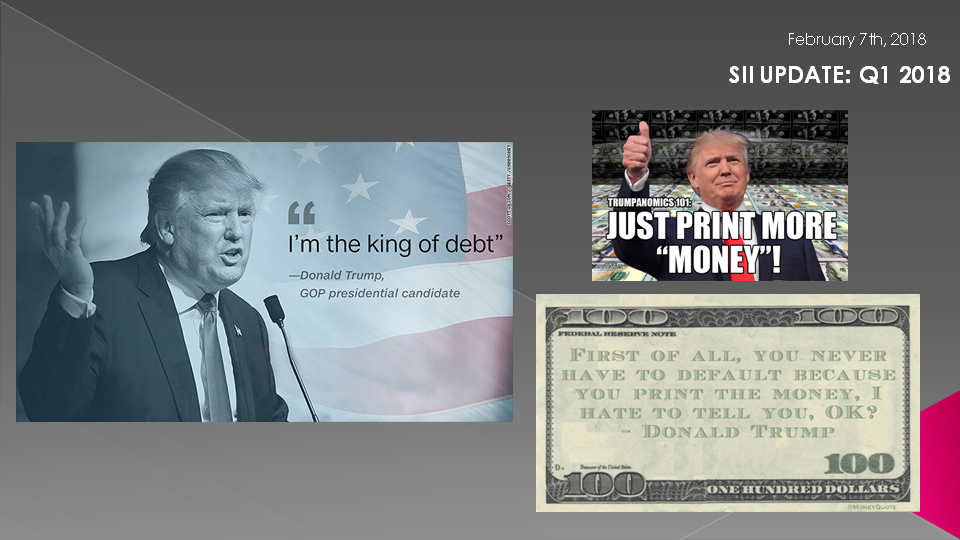
As I often remind us in these videos, remember they will print the money to solve any and all problems until such time as no one will take the money or it is of no value.
That day is still in the future so take advantage of the opportunities as they currently exist.
Investing is always easier when you know with relative certainty how the powers to be will react. Your chances of success go up dramatically.
The powers to be are now effectively trapped by policies of unsound money and fiat currencies.
SLIDE 40
I would like take a moment as a reminder:
DO NO NOT TRADE FROM ANY OF THESE SLIDES - they are for educational and discussions purposes ONLY.
Thank you for listening and until next month may 2019 be an outstanding investment year for you and your family.
Thank you for listening!