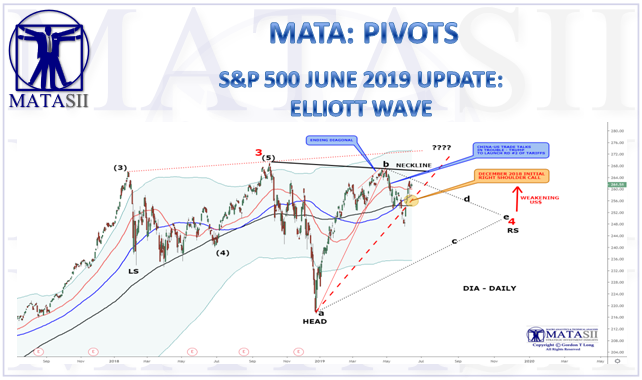
S&P 500 JUNE 2019 UPDATE: ELLIOTT WAVE
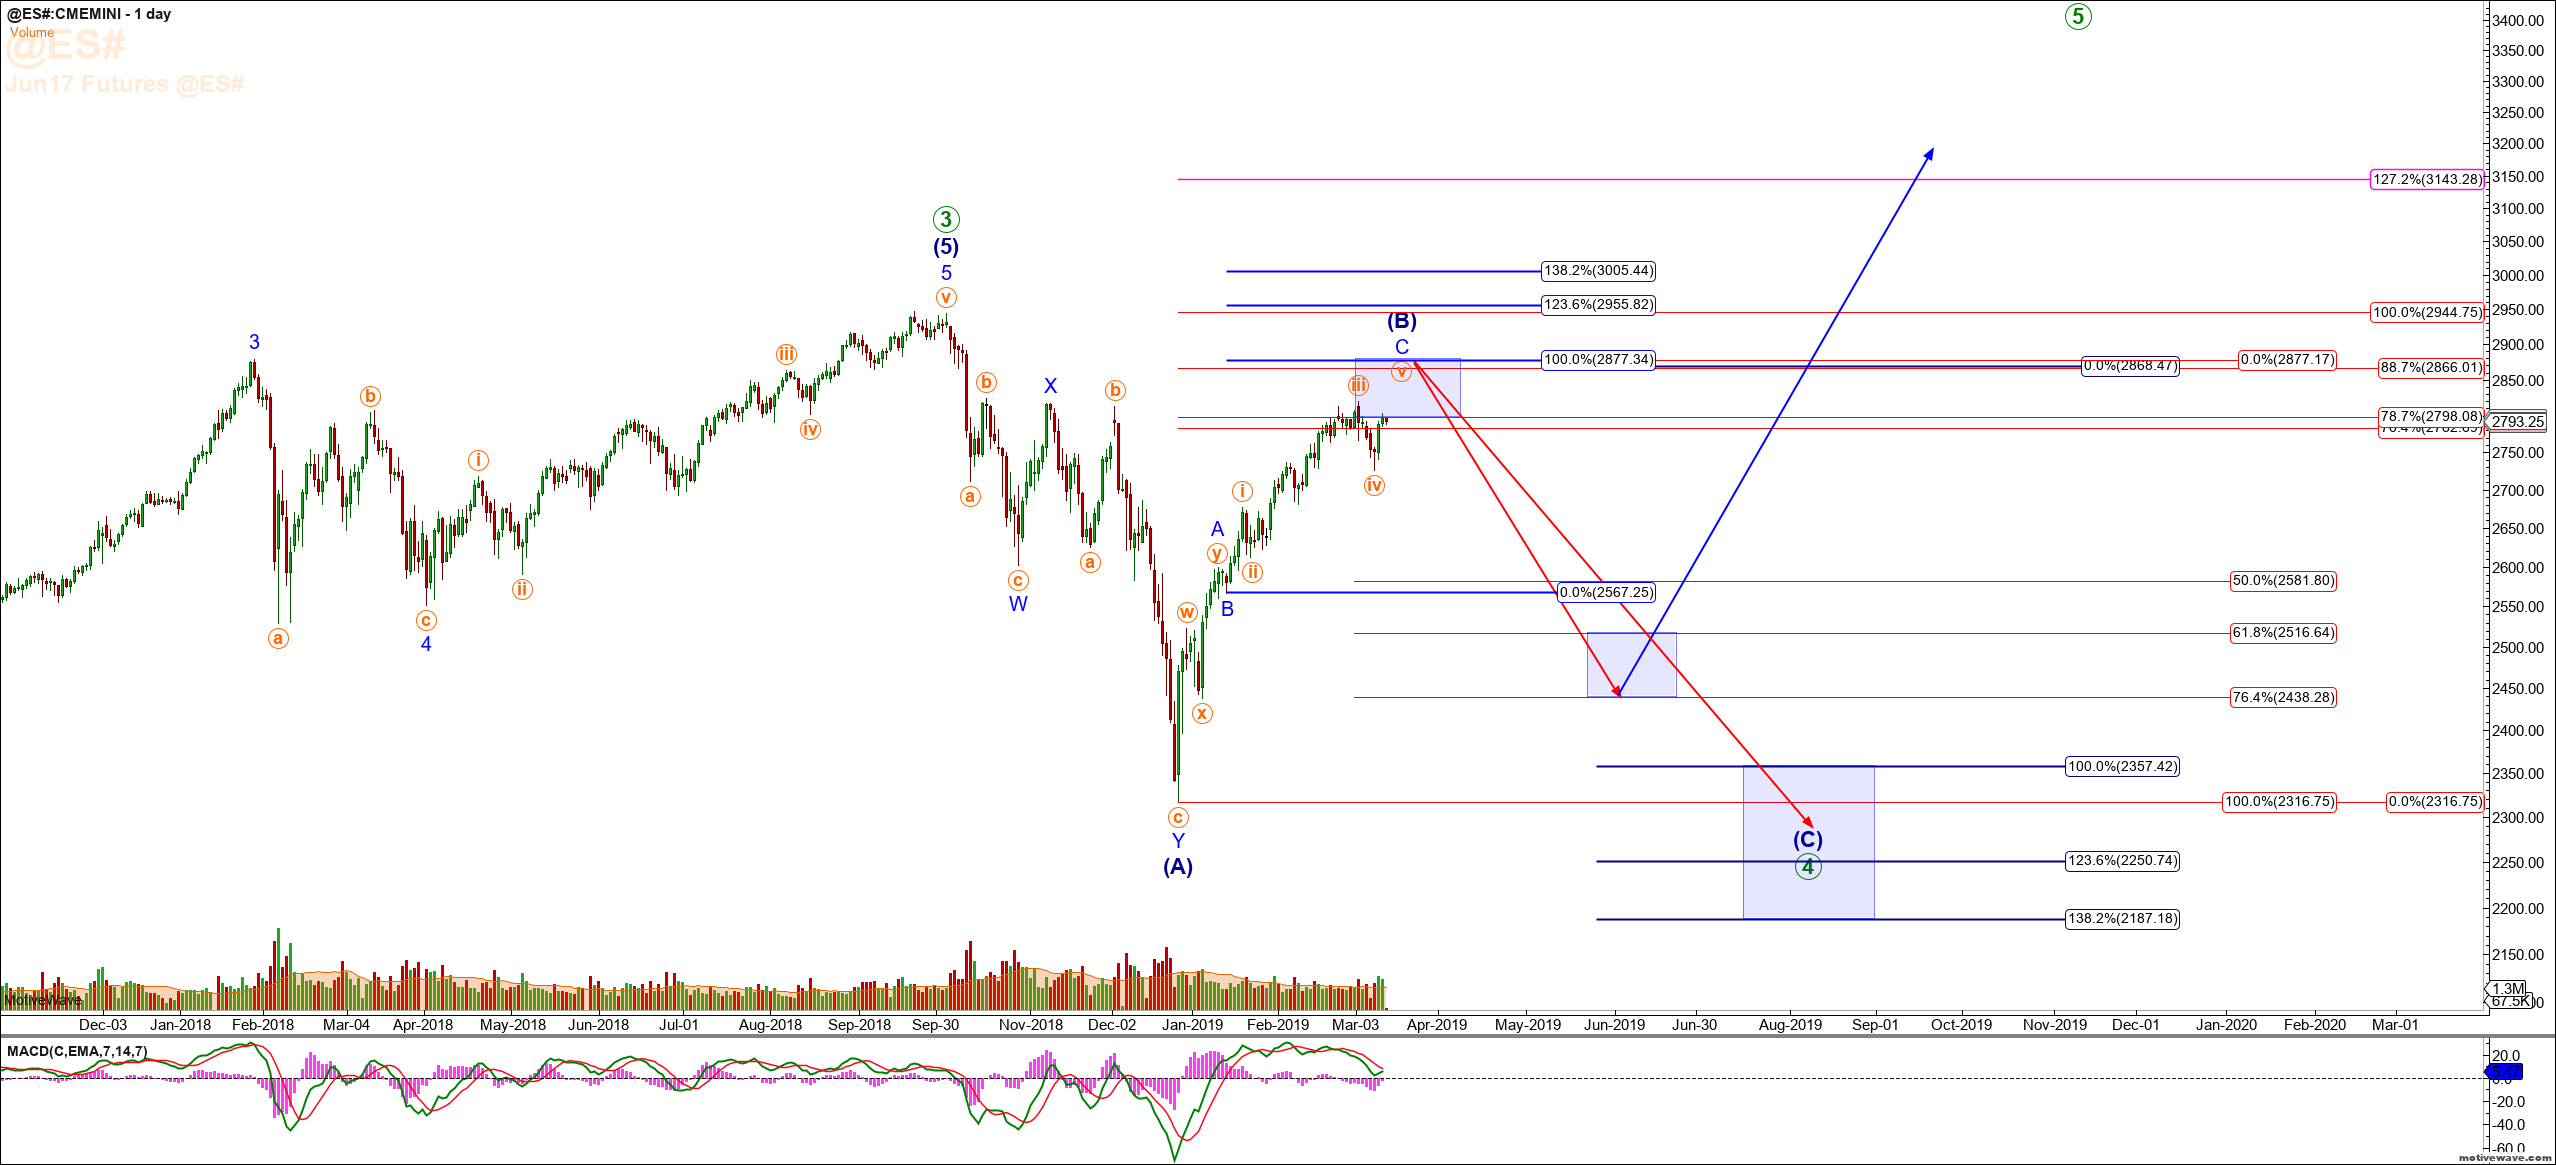
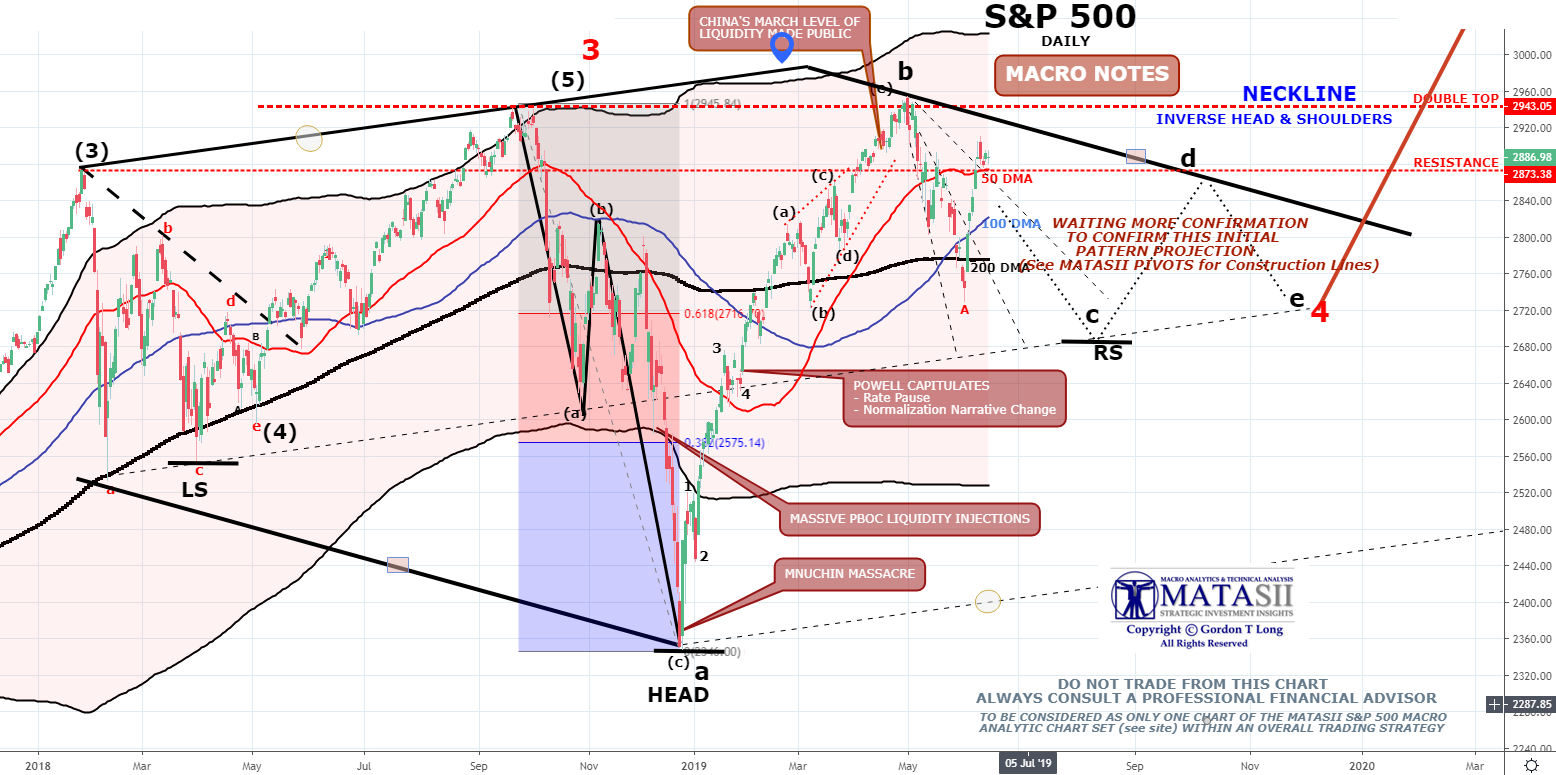
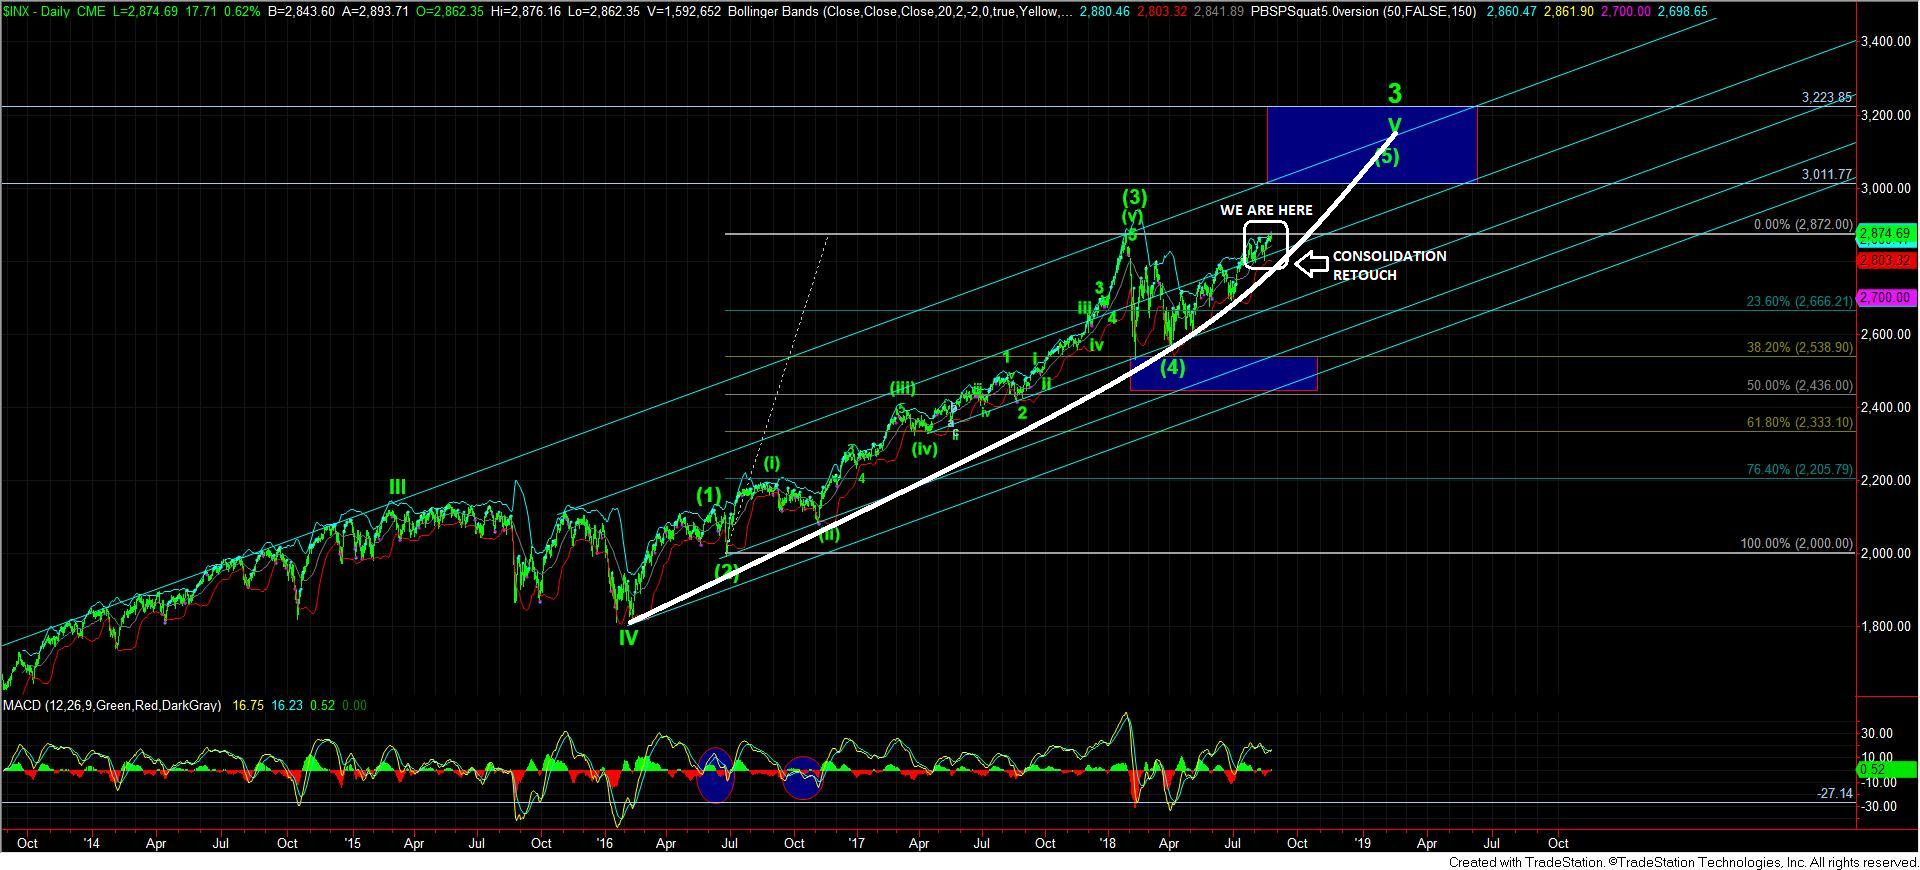
CURRENT CHART - S&P 500
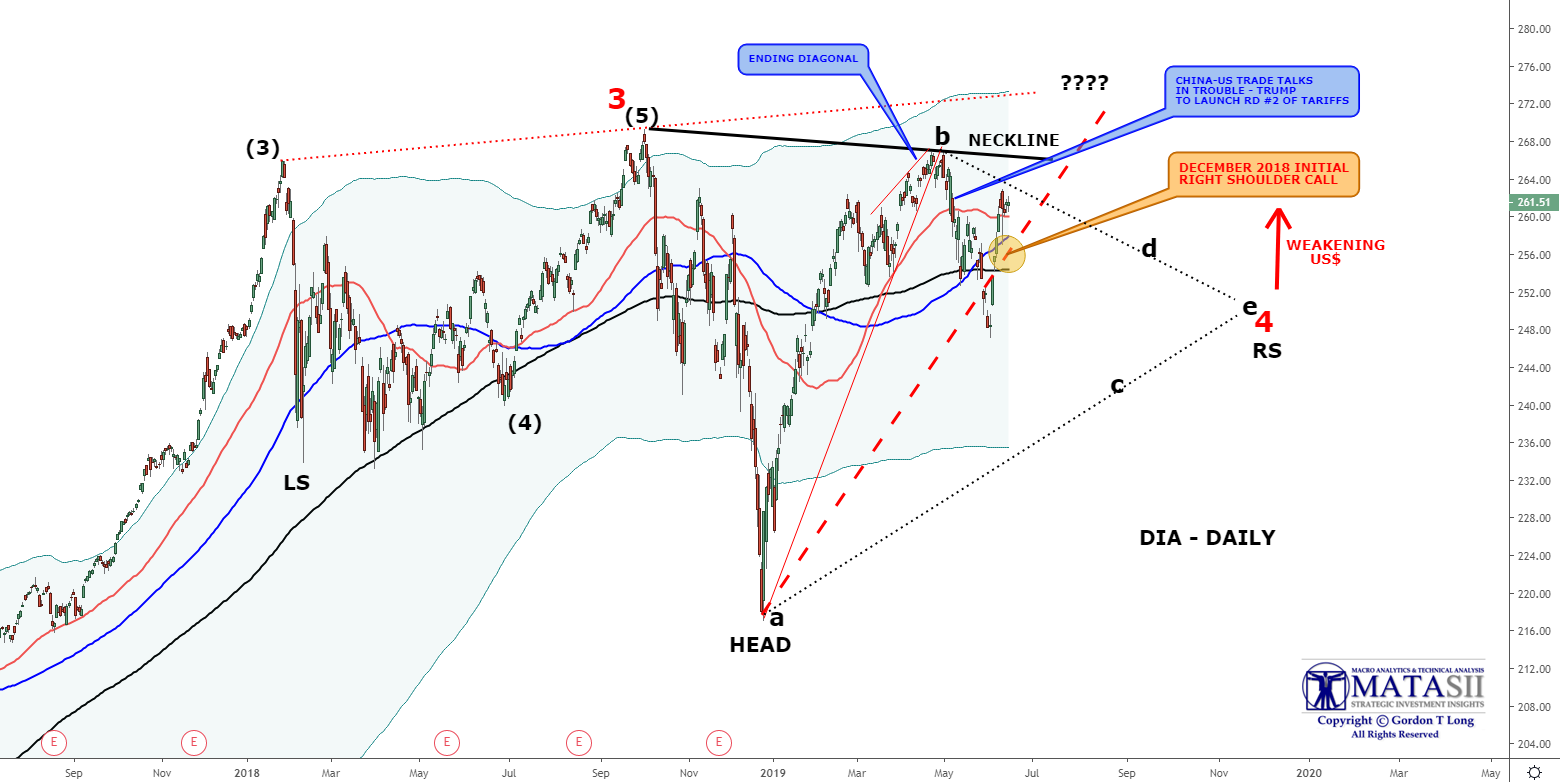
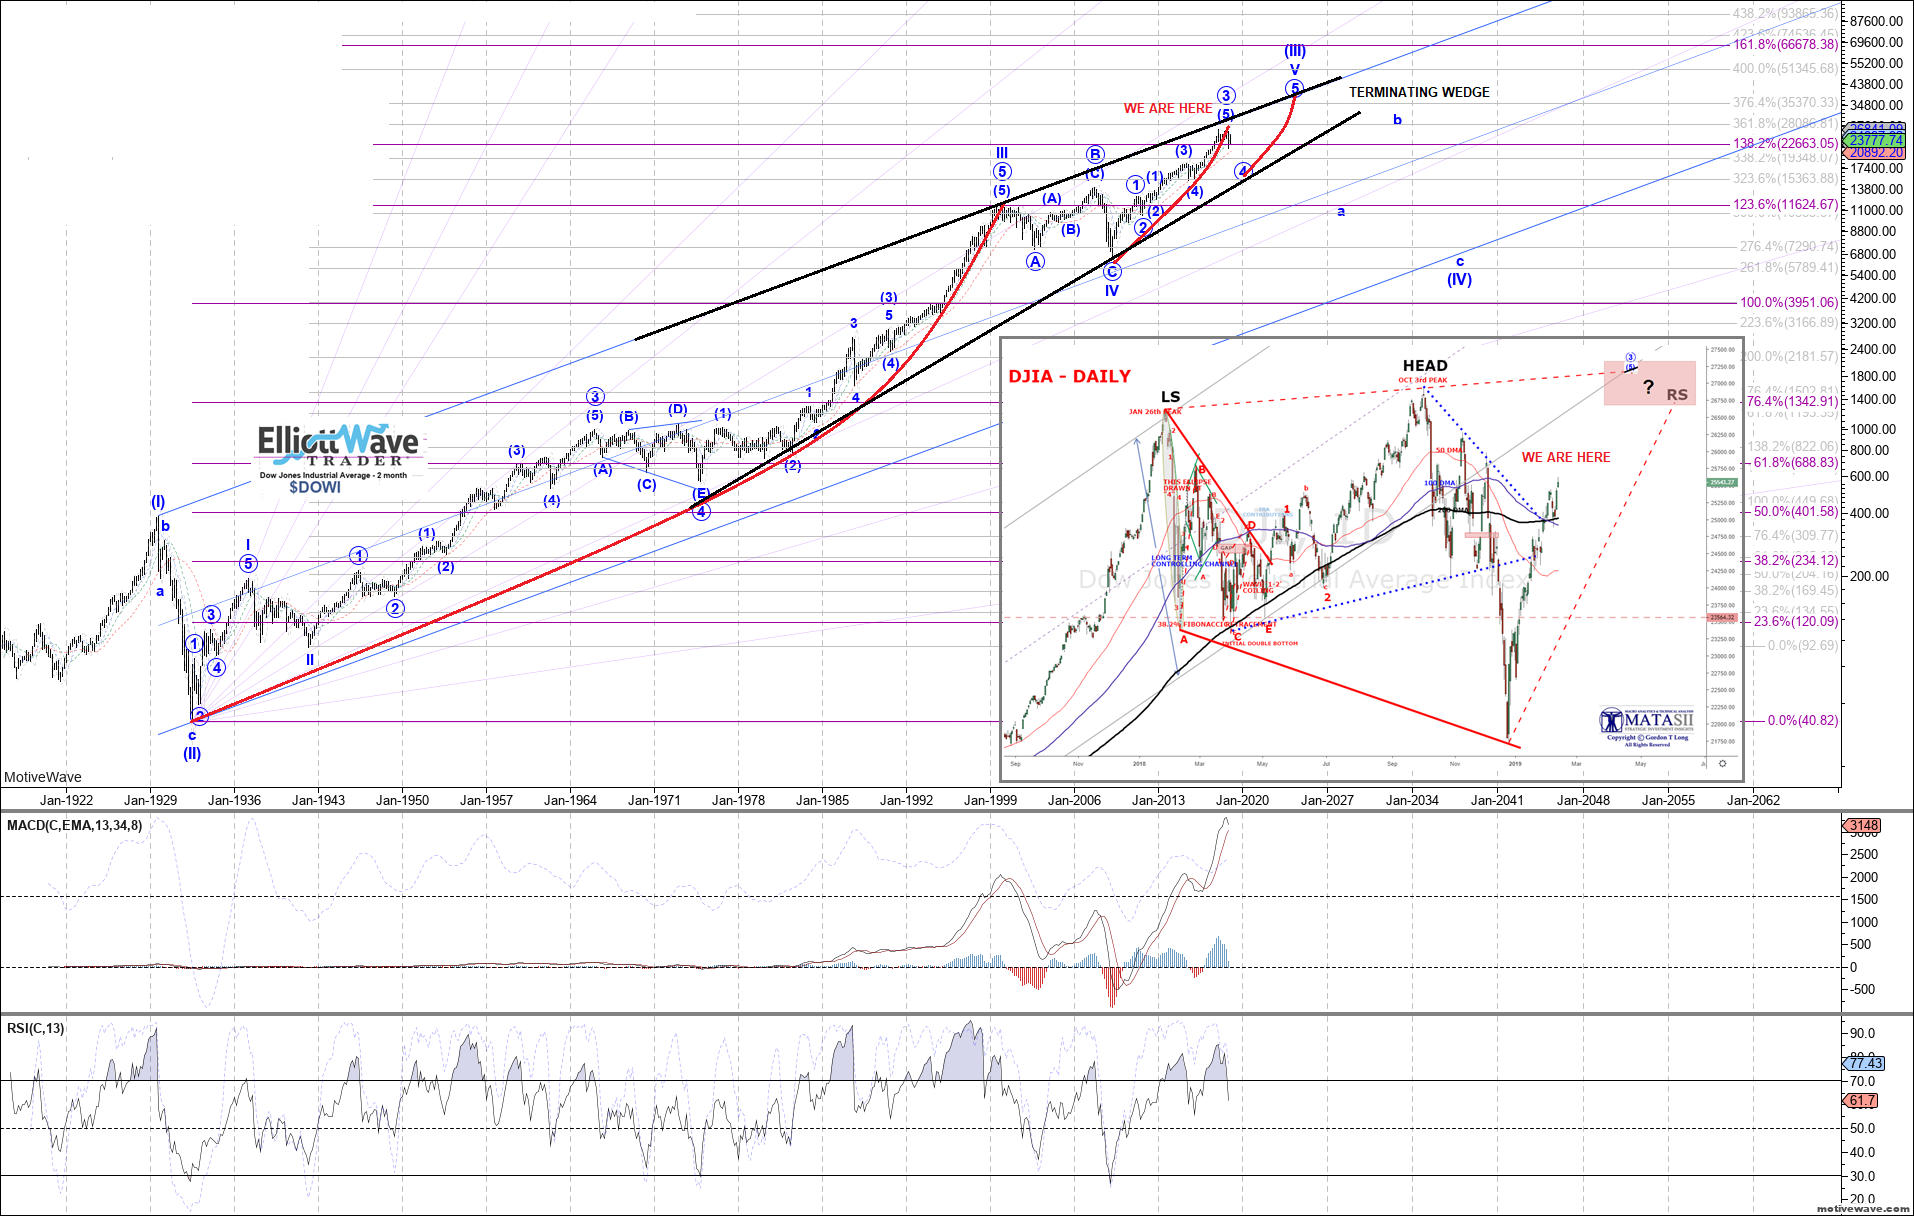
CURRENT CHART - DJIA (DIA)
PERSPECTIVE (Some Charts Somewhat Dated but still valid based on the above)
BIG PICTURE
LONG TERM VIEW
- We are in the early stages of a "Minsky Melt-Up",
- Minsky Melt-Up ends just after the next US Presidential Election,
- Suggest you read: WASHINGTON'S PLAN TO AVOID AN OUT OF CONTROL US DEBT PROBLEM
- Additionally: CENTRAL BANKS ENRICH A SELECT FEW AT THE EXPENSE OF MANY
- Melt-Up began going parabolic with the US election of Donald Trump & his Fiscal & Tax Policies,
- Notice how long the recovery from a Fiat Currency Collapse / Re-Allignment will take the Global Economy from an Elliott Wave Count perspective (bottom right corner marked "IV")

INTERMEDIATE TERM
FOUR MONTHS AGO WE SAID:
- "We are presently looking for a corrective consolidation back to the S&P 500 200 DMA" -- This has been achieved,
- The consolidation is not over until we find support on the "Minsky Parabolic" shown in white below,
- The Parabolic pattern (in white) currently approximates the 200 DMA but is not an exact overlay. The white line is slightly lower.
LATEST -- DJIA
ADDITIONAL ELLIOTT WAVE PERSPECTIVES