IN-DEPTH: TRANSCRIPTION - SII UPDATE: MID-YEAR 2018
COVER

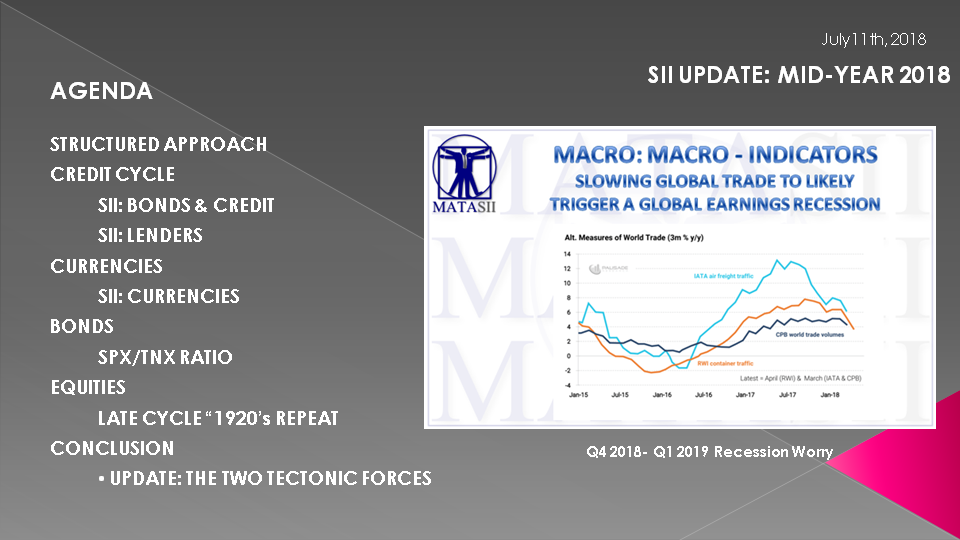
AGENDA
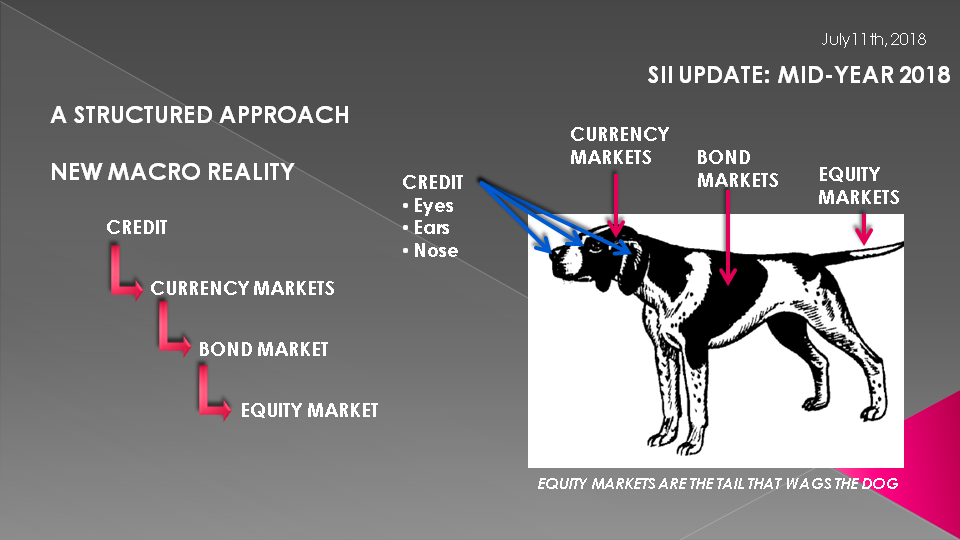
SLIDE 5 - A STRUCTURED APPROACH
In this Mid-Year update of our 2018 Strategic Investment Insights, I want to follow the Structured Investment Approach we outlined in our recent June LONGWave video entitled "A Structured Investment Approach (LONGWave - 06 13 18 - JUNE - A Structured Investment Approach) - represented here graphically & our last UnderTheLens video entitled "Macro Investing in an Era of Political Discord"(UnderTheLens - 05 23 18 - JUNE - Macro Investing in an Era of Political Discord).
Starting with Credit we need to remember that Credit isn’t a specific market – but involves multiple tradable vehicles with complex relationships which we previously outlined.
As I have said many times, we now live in an Era of Creditism versus traditional Capitalism where the Credit Cycle now controls the industrial economy and to an ever increasing degree, the business cycle. The Global Credit Cycle controls national economic cycles as money and credit is borderless and moves in milliseconds.
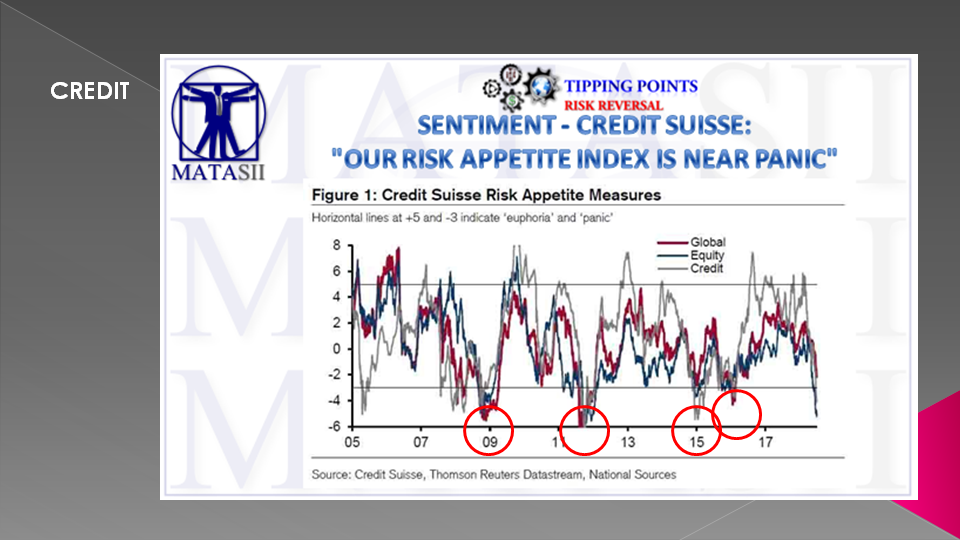
SLIDE 6 - CREDIT
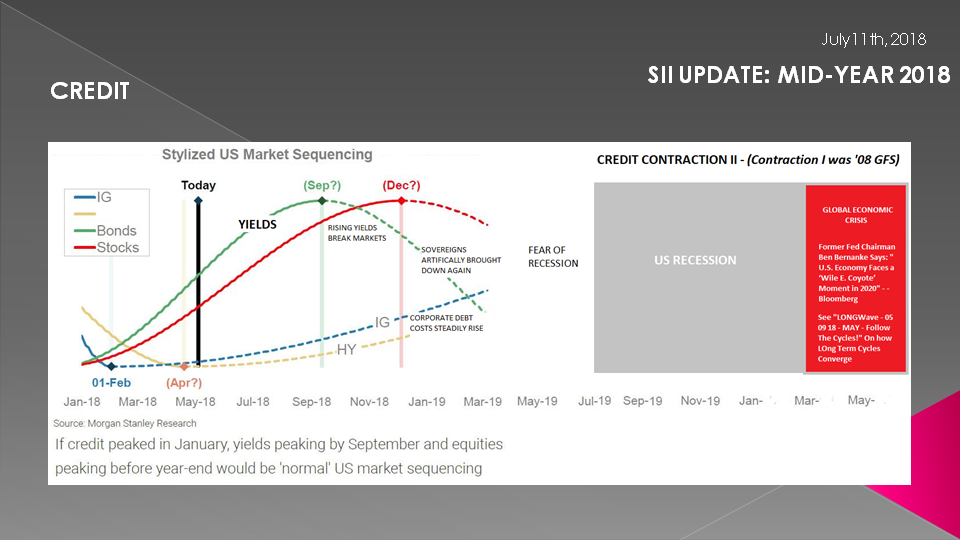
In our May LONGWave - Follow the Cycles (LONGWave - 05 09 18 - MAY - Follow The Cycles!) and other video’s, we have offered a number of credit cycle road-maps and key indicators within them to watch.
I think this particular cycle diagram offers us what we need to kick off our review of our 2018 Strategic Investment Insights.
The last time I showed this chart we positioned the US credit cycle where the red arrow is shown.
We additionally labeled the fact we were beginning to see signs of risk reversal and building inflation in the bottom right box. This is where the arrow is today as we talk.
I am now seeing early signs of "Flight to Quality” in both US Treasuries and the US Dollar – Our fourth stage in this particular illustrative road-map.
I have been posting a steady stream of developments on the MATASII site regarding both Risk and Inflation, both domestically and globally.

SLIDE 7
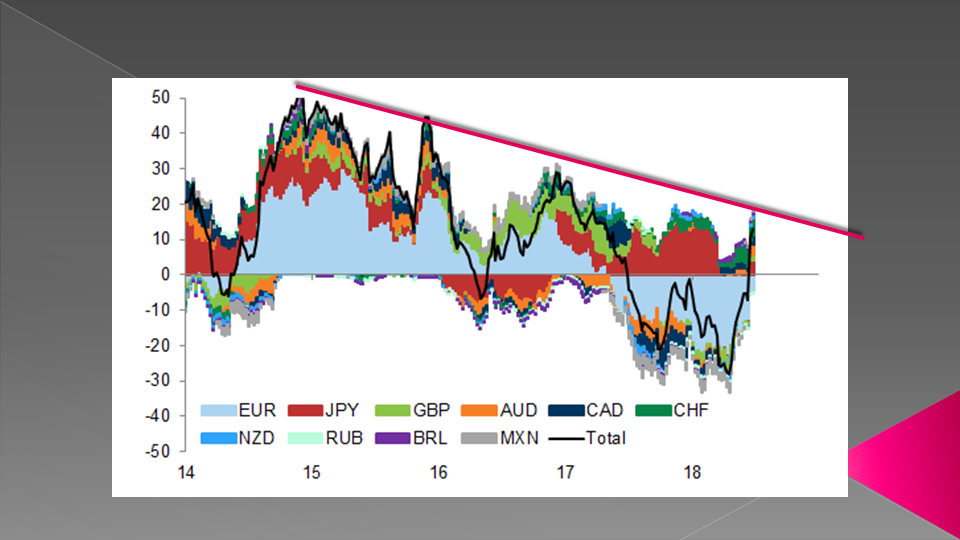
Concerning RISK, we see here that Global Risk Appetite is in as clear a “freefall” as we have witnessed in a long time.
The Red arrows circles contrasts our current situation to:
- The 2009 Financial Crisis,
- The 2012 EU Banking Crisis – driven by Greece,
- The 2015 US Taper Ending – and the fall in Emerging Markets & Commodities,
- The 2015-2016 Chinese Yuan Currency Devaluation Shock.
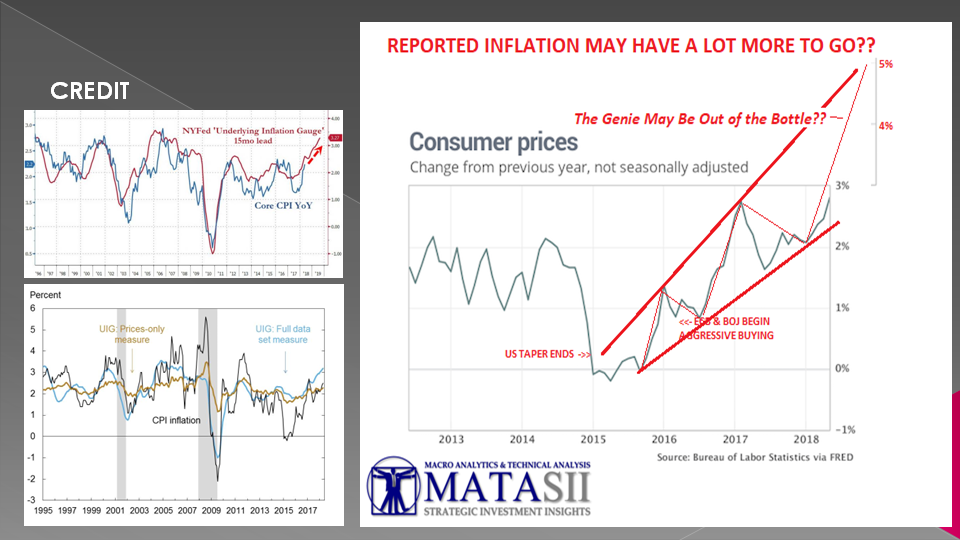
SLIDE 8
I sense that the Inflation Genie is presently quickly getting out of the bottle – but it may be even worse than what John Williams at Shadowstats sees it to currently be. His work shows US Inflation at just over 10% using the 1980 government basis for calculating inflation before all the Hedonics, Substitution, Imputation, Proportional Substitution and other statistical obfuscations were implemented.
TRADE WARS
What few yet appreciate is that Trump’s Trade Tariffs are effectively a US Consumption Tax!
- Trump’s Tariff’s on foreign products increases the price of those import prices that must be absorbed by the importer or the final user – the US Consumer.
- You can fully expect that 90% or more of the tariff costs will be passed directly onto the US Consumer.
- The US Government gets the increased payments in two forms – the full tariff increase at the time of importation and the sales tax on higher costing products. The sales tax being paid to state.
- Foreigner exports may slow, but the importer or the the consumer who uses the goods and services will pay!!!
This is called price inflation! Hold onto your hat as this could get ugly quickly if the Master of the "Art of the Deal" doesn’t resolve things quickly
My back of the envelope calculations indicates that Tariff Price increases could quickly match the recent US Tax relief for individual households. A Coincidence or a Strategy - You decide!
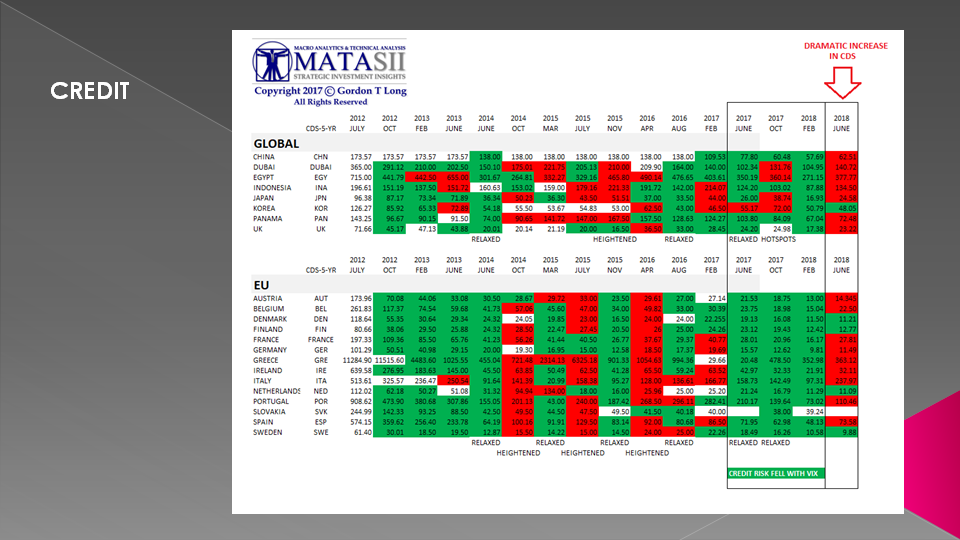
SLIDE 9 -
The world recognizes what is going on as shown by the dramatic increase in sovereign credit default swaps globally, as illustrated in our latest world CDS update shown on the right hand side of this graphic.
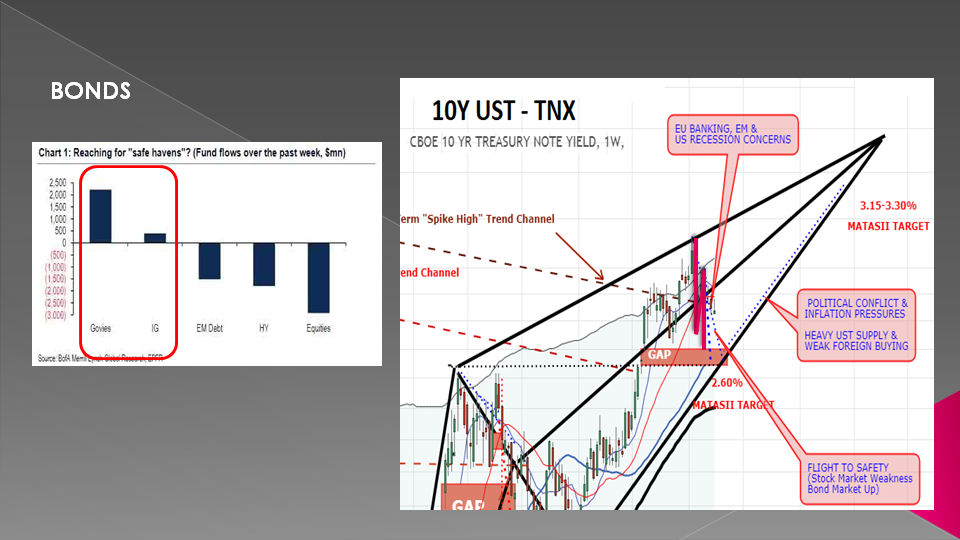
SLIDE 10
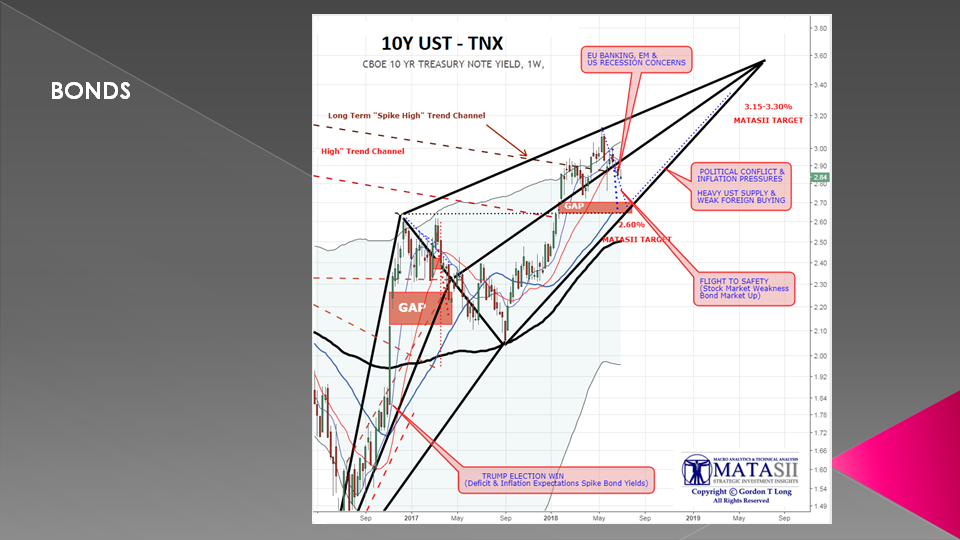
What this is translating to in the world's "risk free" benchmark - that is the 10 US Treasury Note - is the beginning of a "Flight To Safety with US Bond yields falling and their prices rising.
We have been anticipating this at MATASII with our 2.6% call shown here.

SLIDE 11
This unfolding shift is likely to develop in two legs with us just now beginning the second leg down of a classic "abc" corrective move.
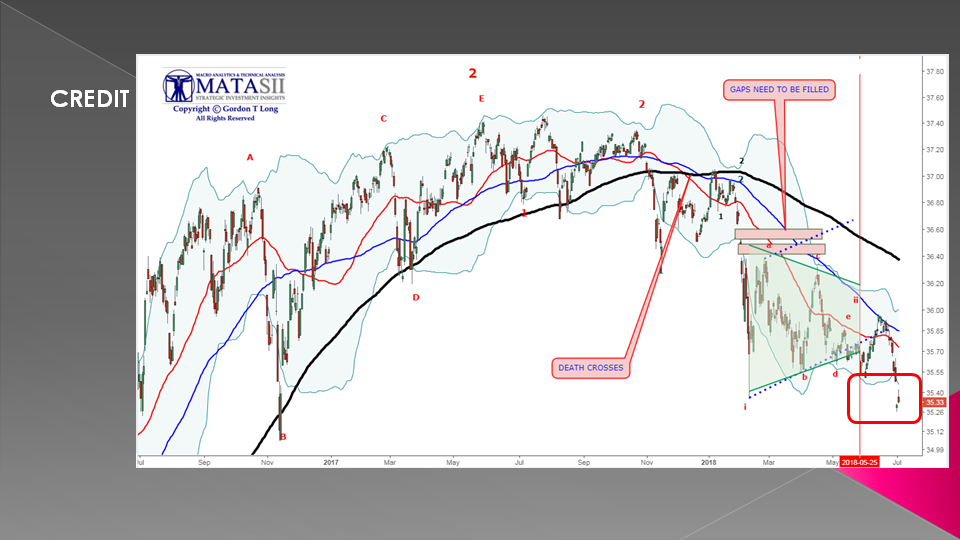
SLIDE 12
We are additionally seeing, as expected, the High Yield or Junk bond market beginning to breakdown.

SLIDE 13
.... before what is likely to be a cascading drop lower!
SLIDE 14
The signals and patterns suggest that the Bond & Credit markets are likely to unfold in the fashion illustrated here.
SLIDE 15
The late cycle predictability is why the Bond & Credit SII is one of our top three 2018 focus areas. It is why we increased their focus at the beginning of the year.
We showed this chart during our last update.
What we have added is the fact that with a rising US Dollar the cost of hedging for the Carry Trade has made the Purchasing of US Treasuries very expensive and is presently restricting the Carry Trade in buying US Treasury securities. Therefore the "Flight to Safety" driver is not getting any assistance from the Carry Trade and hence Bond Yields are not currently getting hit as hard as they might have. I expect this to change.
We will discuss that in a moment.

SLIDE 16
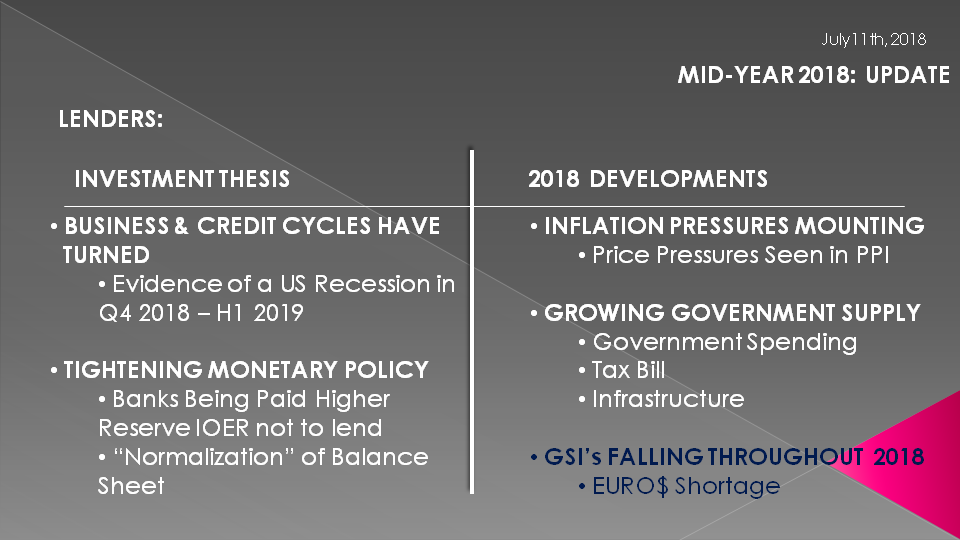
Another higher focus SII is the "Lenders". Our call on shorting Deutsche Bank last year has turned out to be a major win. We see a lot more pain to come in the global banking arena, and specifically European and EM banks. What we have is a serious Eurodollar shortage which is seriously impacting the Global Strategic Financial Institutions.
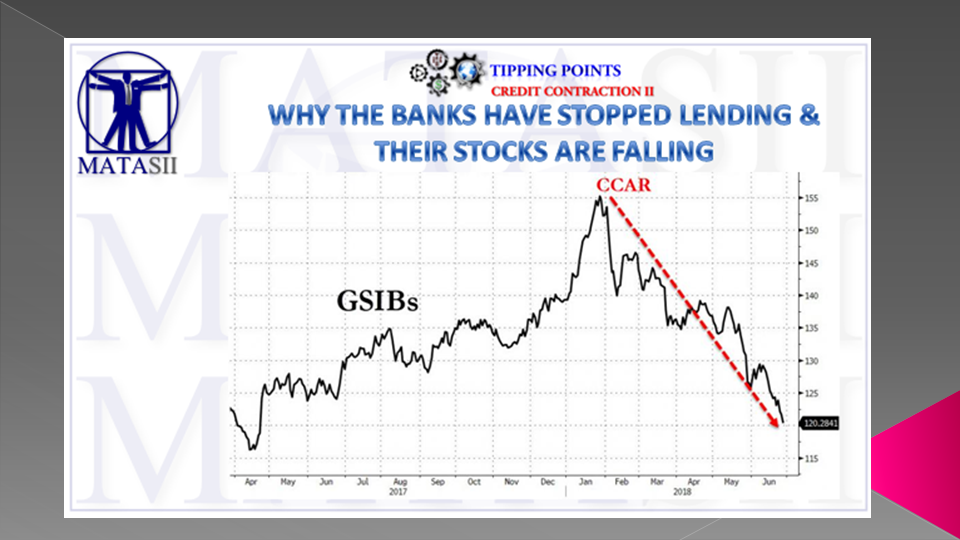
SLIDE 17
The Eurodollar shortage isn't presently getting much attention but these major banks and financial intermediaries are getting steadily hammered since "risk-off" shift occurred in late January.
SLIDE 18
Nothing points out this shift in global "risk-off" better than when "Bitcoin" reversed direction - shown here in gold and the red arrow.

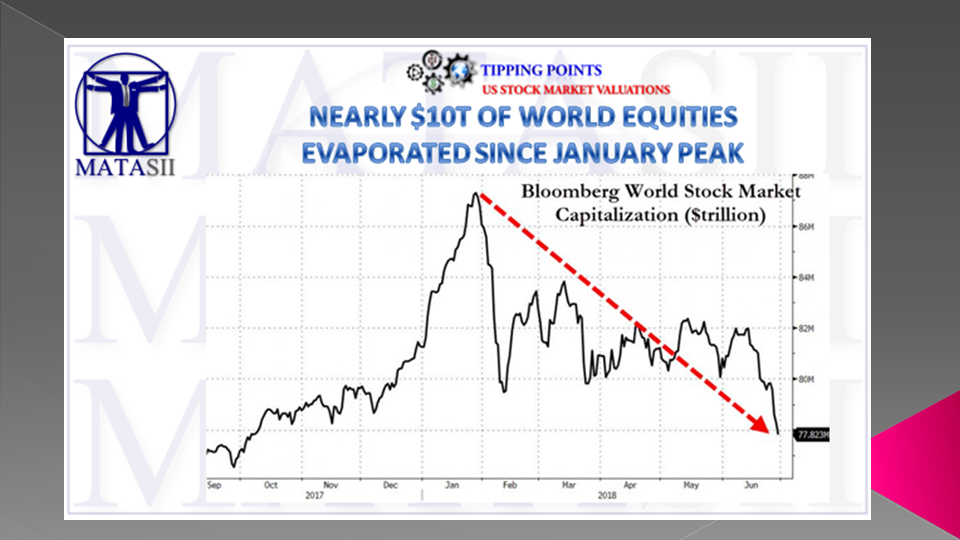
SLIDE 19
We have seen approximately $10T in world equity valuations evaporate since this January peak!
SLIDE 20
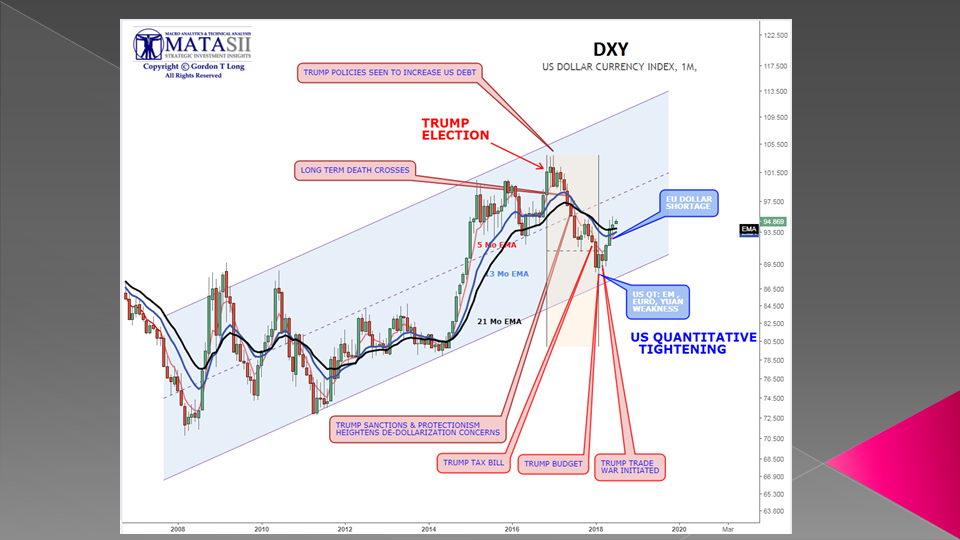
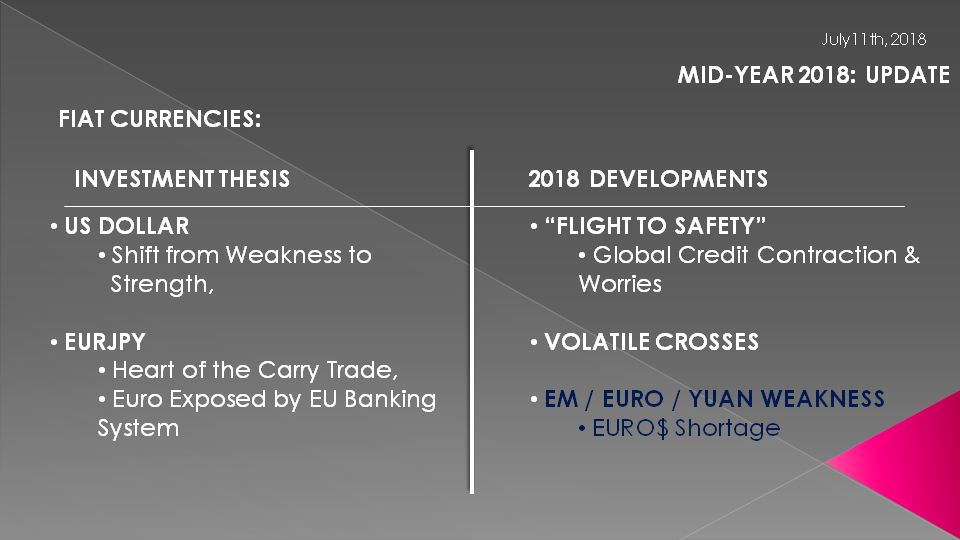
Shifting to Currencies - the third of our 2018 top three focus SII's - we see here a chart of the US dollar.
The US Dollar has steadily fallen since Donald Trump was elected and only recently reversed. The reversal coincides with the US implementation of Quantitative Tightening while the other major global central banks were further behind in various versions of their own "TAPER" programs - and still are.
This and higher US Fed Funds rates has triggered the lift in the US dollar along with an increasing "risk-off" flight to safety which I mentioned earlier.
SLIDE 21
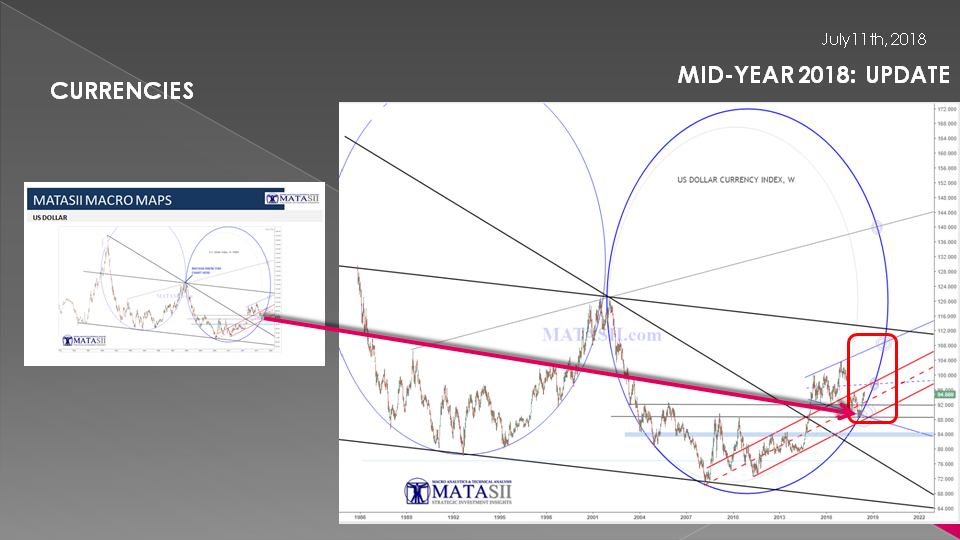
The bottom in the US dollar coincided almost exactly with this dollar chart we drew a few years ago when we exited the first ellipse on the left. If this pattern continues to be as predictive as it has been then we can expect some consolidation in the US dollar before it explodes higher to the High Probability Trading Zones (HPTZ) shown.
SLIDE 22
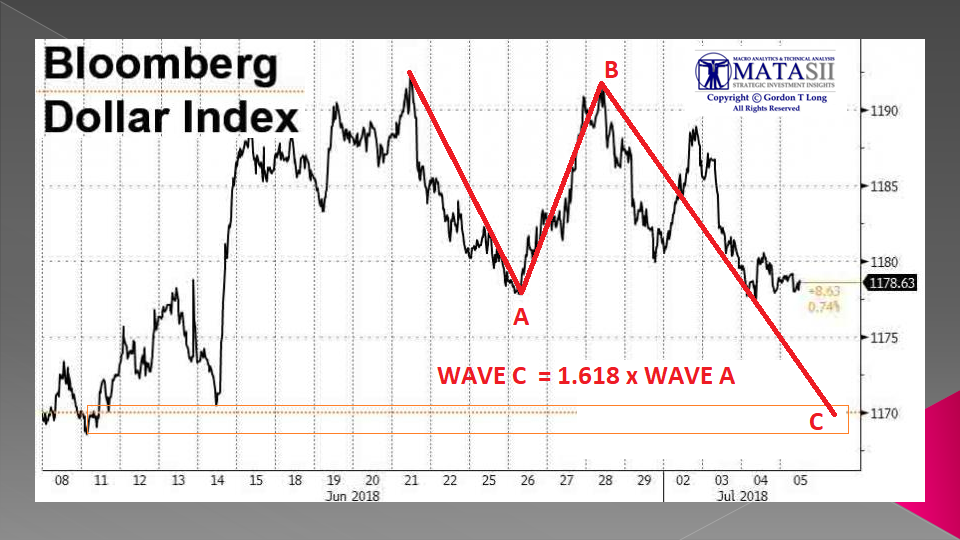
Our short term consolidation expectations are shown here.
We need to complete the final "C" leg which appears to align closely with a touch of the "ellipse" shown on the previous slide.
SLIDE 23
We think the near term buying of the US Dollar has presently been overdone and is reaching a reversal point before going higher.
SLIDE 24
This chart we also showed in our last update. The major change is the degree of Eurodollar shortage being caused by developments in the Emerging Markets, the EU and China. The Euro and Chinese Off-Shore Yuan continue to be extremely weak against the US dollar and we don't see this getting any better soon. In fact it could get seriously weaker in the near-to-intermediate term.
SLIDE 25
Shifting from Credit and Currencies, lets take a little closer look at the bond market which we touched on earlier. We showed this chart previously but we didn't focus on the expected lift in yields after the "ABC" is completed.
We see a major push higher in yields due inflation and supply. Don't underestimate how much a Tariff War will mean to price inflation.
There is a chance we are too conservative on the degree of lift to expect in US 10 Year Treasury Yields. We suspect at 3.3% the Fed will step in whether officially by stopping rate hikes and QT or in some other stealth manner centered around the dollar.
SLIDE 26
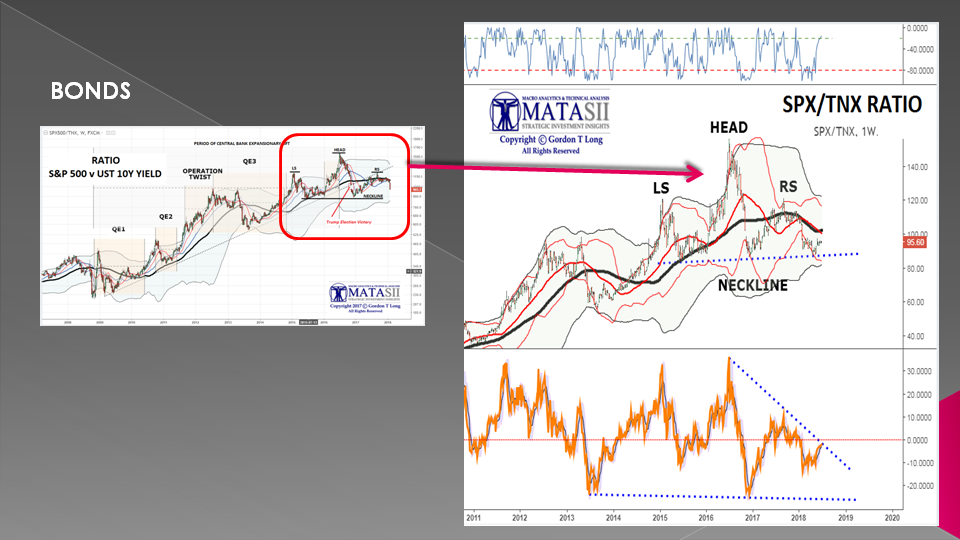
What we are watching closely in the Bond Market is the ratio of the SPX to the 10 Year Treasury note on a log basis - as shown here.
We have a pretty clear head and shoulders pattern.
We have done a lot a spreadsheet ratio modeling with the SPX and 10 Year Yields and are surprised to see how important the neckline shown here is and what a break of it would mean to both the equity markets and bond markets.
We don't have time here to take you through these perturbations but what we concluded is that there is a high chance that we will see something that is eerily reminiscent of what preceded the 1929 stock market crash.
SLIDE 27
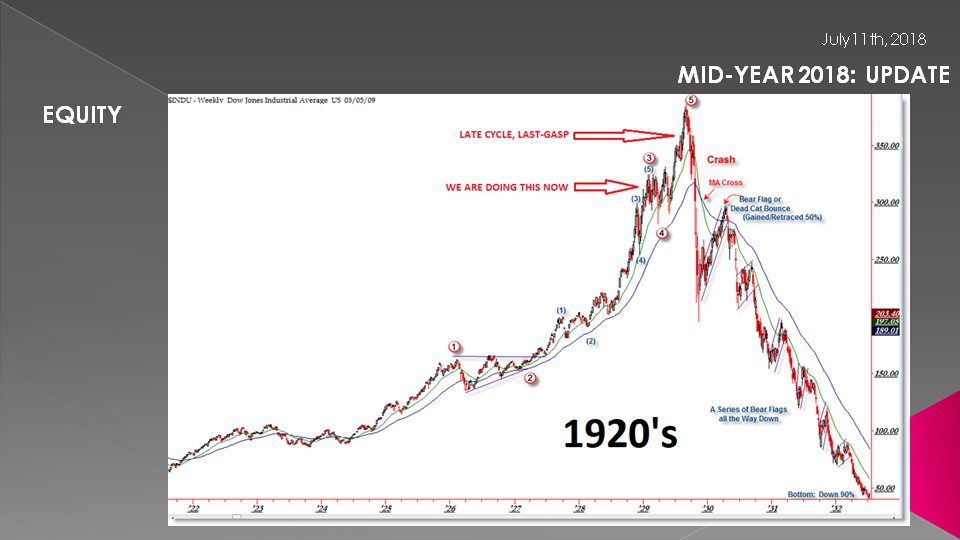
The 1929 stock market crash was based on an out of control, highly leveraged US credit cycle with global currency investment flooding the US.
It led to a late cycle, last gasp higher move in stock prices based on Monetary policy accommodation, before abruptly plummeting.
SLIDE 28
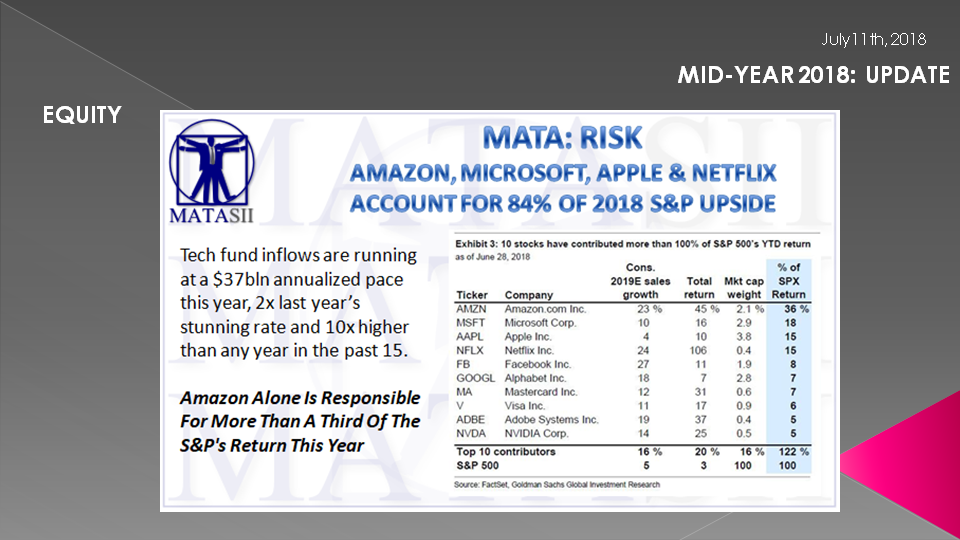
When you recognize that four stocks accounted for 84% of the 2018 S&P's upside, you can appreciate how fragile and dependent the equity markets are.
Additionally in total, Corporate Stock Buybacks accounted for nearly all stock appreciation in first half.
Stock buybacks and ETF Index impact is a potentially very serious looming problem - but maybe not immediately!!
SLIDE 29
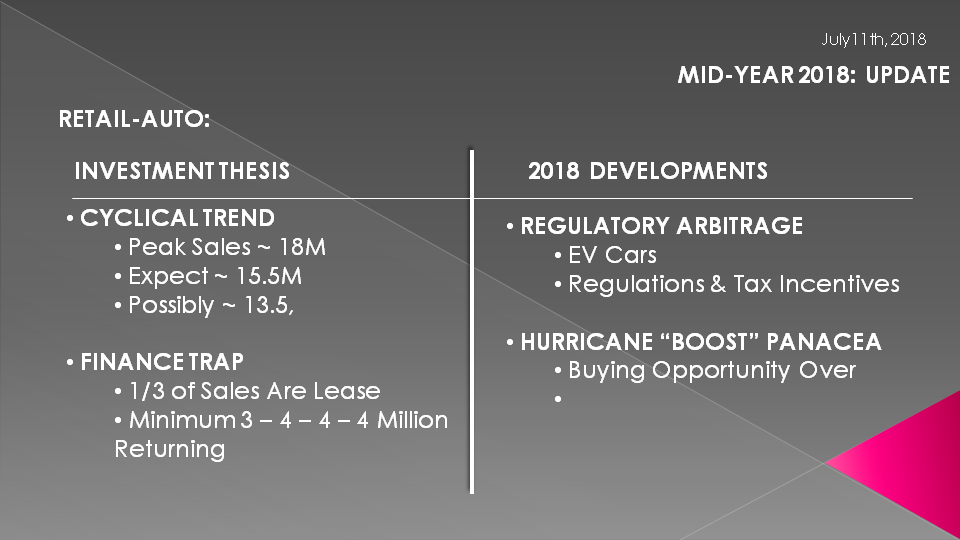
We continue to believe there are serious cyclical and finance issues in the Auto Sector,
SLIDE 30
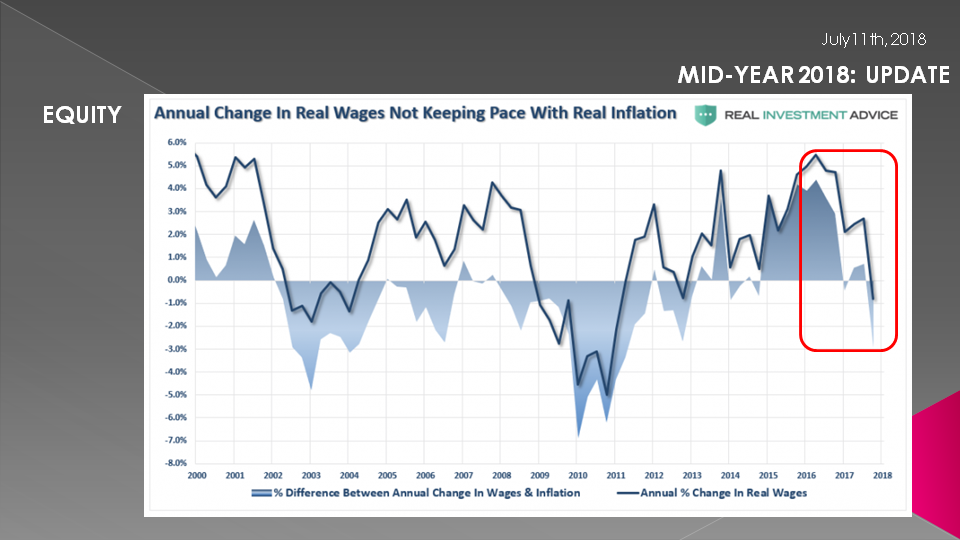
The US Consumer is tapped out with wages not staying abreast of the real inflation rate.
SLIDE 31
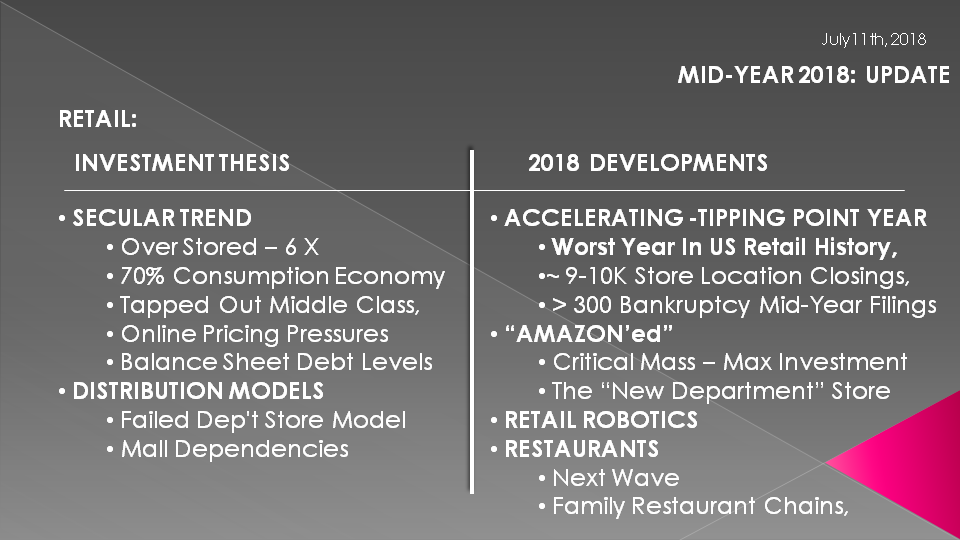
This is not a new problem but it is getting worse quickly. When you add possible Trade Tariff price increases to this, it is going to hit an already troubled Retailers under financial & margin siege. We continue to see major short opportunities in this sector. You may want to revisit our extensive watch list (with annotated charts) for ideas.
SLIDE 32
Defense has been a star for us but we think most of the good news is priced in now and the dividend game has been effectively played.

SLIDE 33
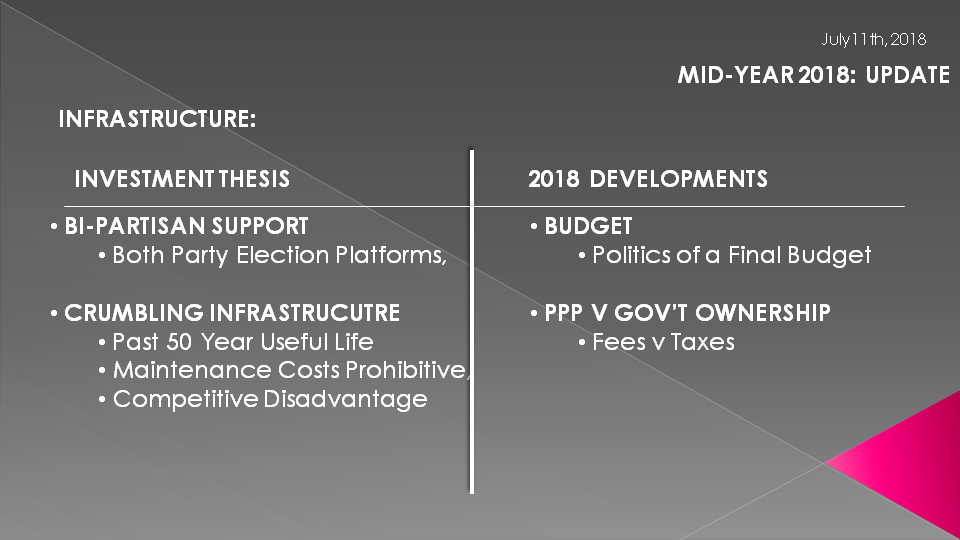
Infrastructure is likely to again become a major talking point after the mid term elections this fall. It is time to do your due diligence, though waiting to the fall may be the best best.
SLIDE 34
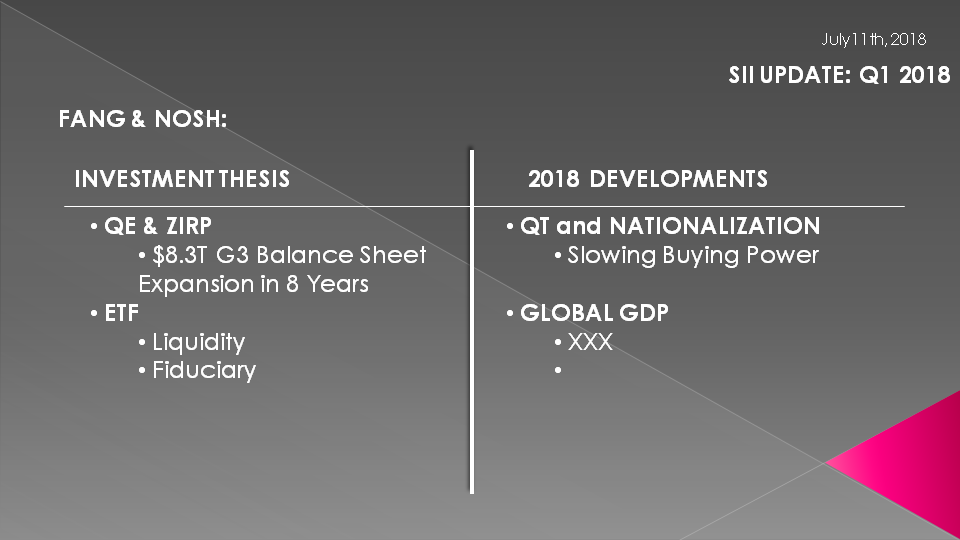
The FANG & Nosh SII has been a spectacular SII for us but we now stress caution here. We noticed that even Morgan Stanley today issued a rare sell downgrade on the Technology stocks. Again, caution is advised.
SLIDE 35
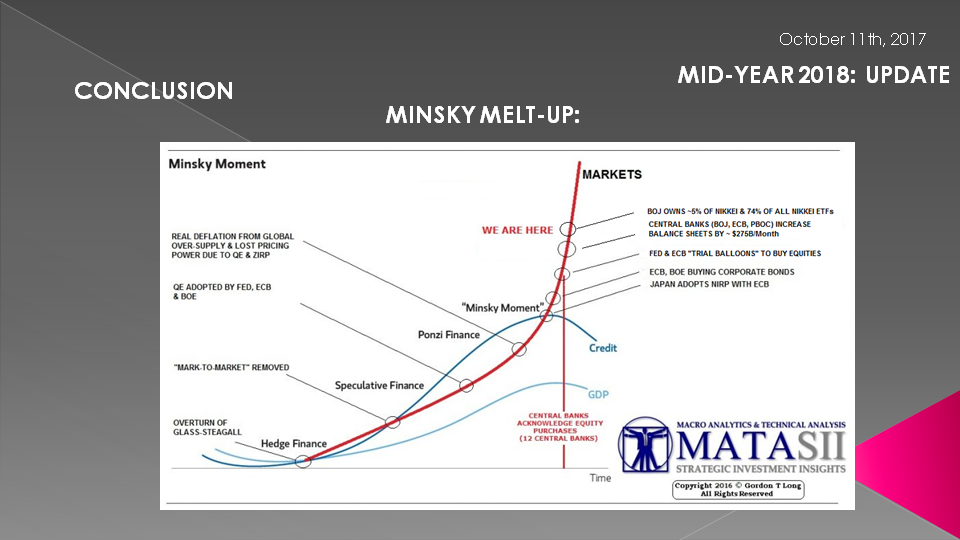
In our view the Minsky Melt-Up is not over! There is more to go but the tide is steadily going out.
SLIDE 36
We feel that the Trump Tax cuts bought the market another year but a Trade War could take that back abruptly!

SLIDE 37
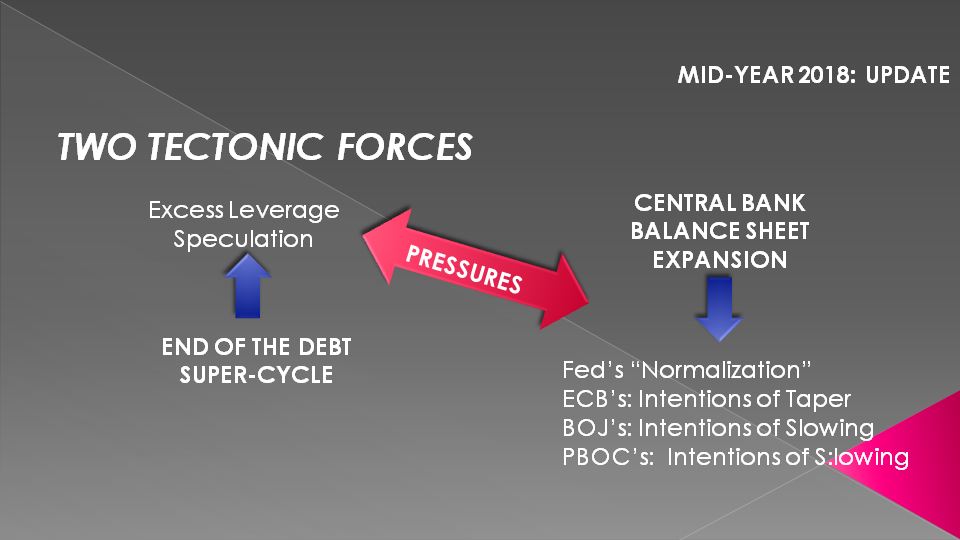
The Tectonic Forces we outlined in prior updates are steadily shifting. The pressures of an ending Debt Super Cycle will soon win out over competing central bank monetary policies. It is only a matter of time before the earthquake from these forces manifests itself within the global financial markets.
SLIDE 38
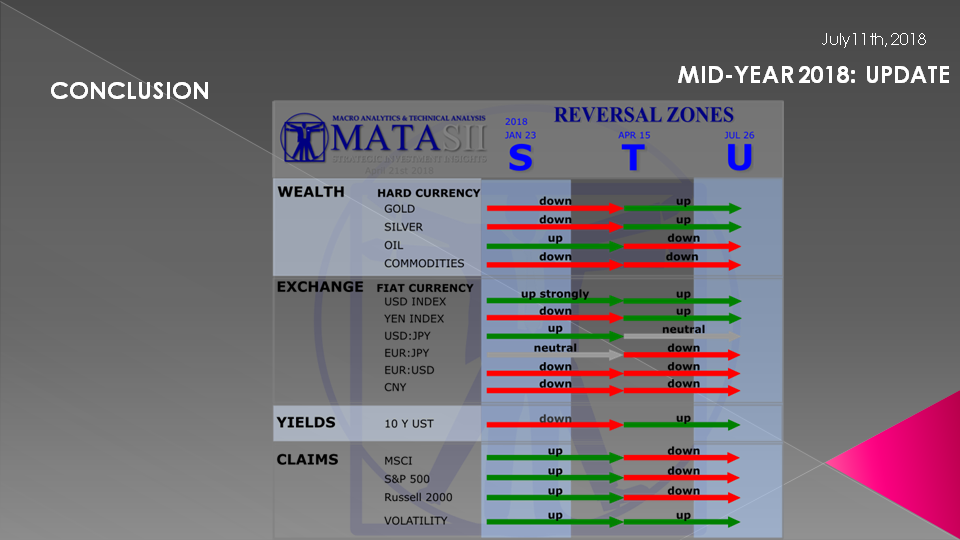
We encourage you to examine the just released market reversal Zone$ and Bia$ outlook which ties all of the above together. We don't show it here since we keep it strictly to the subscriber side of the site. The chart shown here is a dated illustration only.
SLIDE 39
As I often remind our listeners, remember they will print the money to solve any and all problems until such time as no one will take the money or it is of no value.
That day is still in the future so take advantage of the opportunities as they currently exist. Investing is always easier when you know with relative certainty how the powers to be will react. Your chances of success go up dramatically. The powers to be are effectively trapped by policies of unsound money and fiat currencies.
