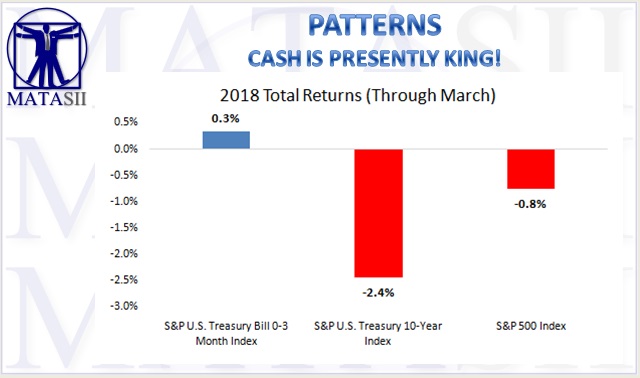
CASH IS PRESENTLY KING!

Data Source: S&P Dow Jones Indices.
In the first quarter of 2018, short-term Treasury bills finished higher while both the S&P 500 and 10-Year Treasury bond declined. The greatest fear among many investors is that this trend will continue.
Is this a rational fear? How often has cash outperformed stocks and bonds historically? Let’s take a look.
We have annual data on stocks (S&P 500), bonds (10-Year Treasury), and cash (3-Month Treasury) going back to 1928.
Since then, cash has been the top performer in only 13% of calendar years. As your holding period increases from 1 year to 30 years, the odds of cash being king declines from 13% to 0%. The opposite is true for stocks, which have been the top performer in 61% of 1-year periods, 80% of 10-year periods, and 100% of 30-year periods.

Data Source: Stern.NYU.edu/~adamodar
If the odds of cash outperforming are so low, why hold it at all?
- Because you may not have a 20-year holding period or
- You may not have a high enough risk tolerance to hold through short-term volatility in stocks and bonds.
Cash is the only asset class that will guarantee you a return of principal in the short run. While bonds do pretty well on this front they will at times lose out to cash during periods of rising interest rates. We saw that in 2009, 2013, and thus far in 2018.
When was the last time cash outperformed both stocks and bonds in a single calendar year? Way back in 1994. Which means that investors under 45 have never seen it and investors over 45 probably don’t remember it.

Note: Calendar year total returns.
The trade-off from the safety that cash provides in the short run: lower long-term returns.
Cash has annualized at 3.4% since 1928 versus 4.9% for bonds and 9.7% for stocks.

For investors with a 1-year holding period, accepting these lower returns is often the most prudent option, as both stocks and bonds could very well decline over that time period. But as your holding period increases beyond 10 years, cash makes less and less sense, as the probability of earning a higher return from stocks and bonds increases significantly.
Another way to look at this is to compare the maximum and minimum returns for stocks, bonds, and cash over various holding periods. What we find is that all 3 asset classes show a much lower variability (max – min) of returns in longer holding periods as compared to shorter holding periods.

Note: data is using calendar year total returns, annualized for periods greater than 1 year.
For instance, the best 3-year period for stocks was 30.8% annualized while the worst 3-year period was -27.3%. That’s a spread of over 58%. Contrast this with the best and worst 30-year periods for stocks at 13.6% and 8.0%, a 5.7% spread.

In bonds, the spreads are less dramatic than stocks but show a similar narrowing as your holding period lengthens.

When the range of possible returns is wide, as is the case for shorter holding periods in stocks and bonds, cash is a more attractive option. As that range narrows with time, stocks and bonds become a higher probability bet.
Is cash more likely to be king in the years to come?
With elevated valuations in stocks and low yields/rising rates in bonds, perhaps this will be the case in the short run (1-3 years). But in the longer run (20+ years), it is unlikely that cash will beat a riskier portfolio of stocks and bonds. That’s not to suggest that holding some cash to sleep at night, for emergencies, or to withstand the higher volatility in stocks/bonds is a bad idea. I don’t think it is. But you probably shouldn’t be rooting for that cash to be your best investment. An environment in which cash is king for any long period of time is not going to be a good one for investors.