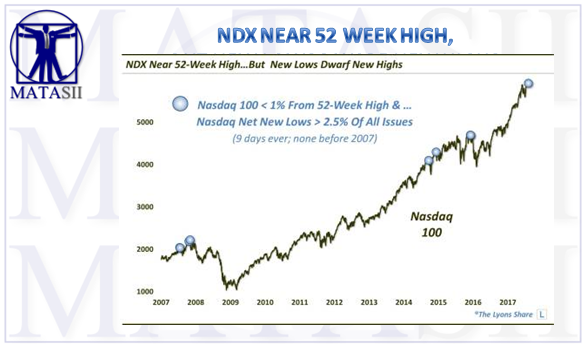
NDX NEAR 52 WEEK HIGH - BUT NEW LOWS DWARF NEW HIGHS
Recently noted deterioration in market internals appears to be getting worse, as evidenced by this rare divergence in the Nasdaq market.

One of the hallmarks of our intermediate-term Risk Model that helps orient our investment posture toward equities is breadth, a.k.a., internals. Internals measure the level of participation in the stock market, e.g., how many stocks are advancing versus declining, the number of new highs versus new lows, etc. The more participation there is, the broader the foundation for a market rally – and the more comfortable we feel being aggressively invested.
In recent weeks, we have published a series of charts and posts highlighting what appears to be a weakening of the internals, or participation, in the market recently. This trend has been interesting to note since the major large-cap averages have continued to trade near their all-time highs. That trend has not slowed down. In fact, it has arguably accelerated, as evidenced by today’s Chart Of The Day.
Today’s ChOTD shows that while the Nasdaq 100 (NDX) remains close to its 52-week high (i.e., less than 1% away as of yesterday), the number of new 52-week lows is now outstripping new highs on the Nasdaq exchange. Not only that, but the number of net new lows, i.e., new lows minus new highs, equated to more than 2.5% of all issues traded on the Nasdaq.
If that does not seem like a big number, it is actually just the 9th day ever that saw so many net new lows while the NDX was so close to its 52-week high.

As the chart suggests, prior occurrences seeing such conditions appear to have come at inauspiciously timed junctures. We’ve asked the question in our previous posts on “internal cracks” – do these examples constitute discernibly negative events? Or could they be mere coincidences or stat-foolery?