Daily 10:20am
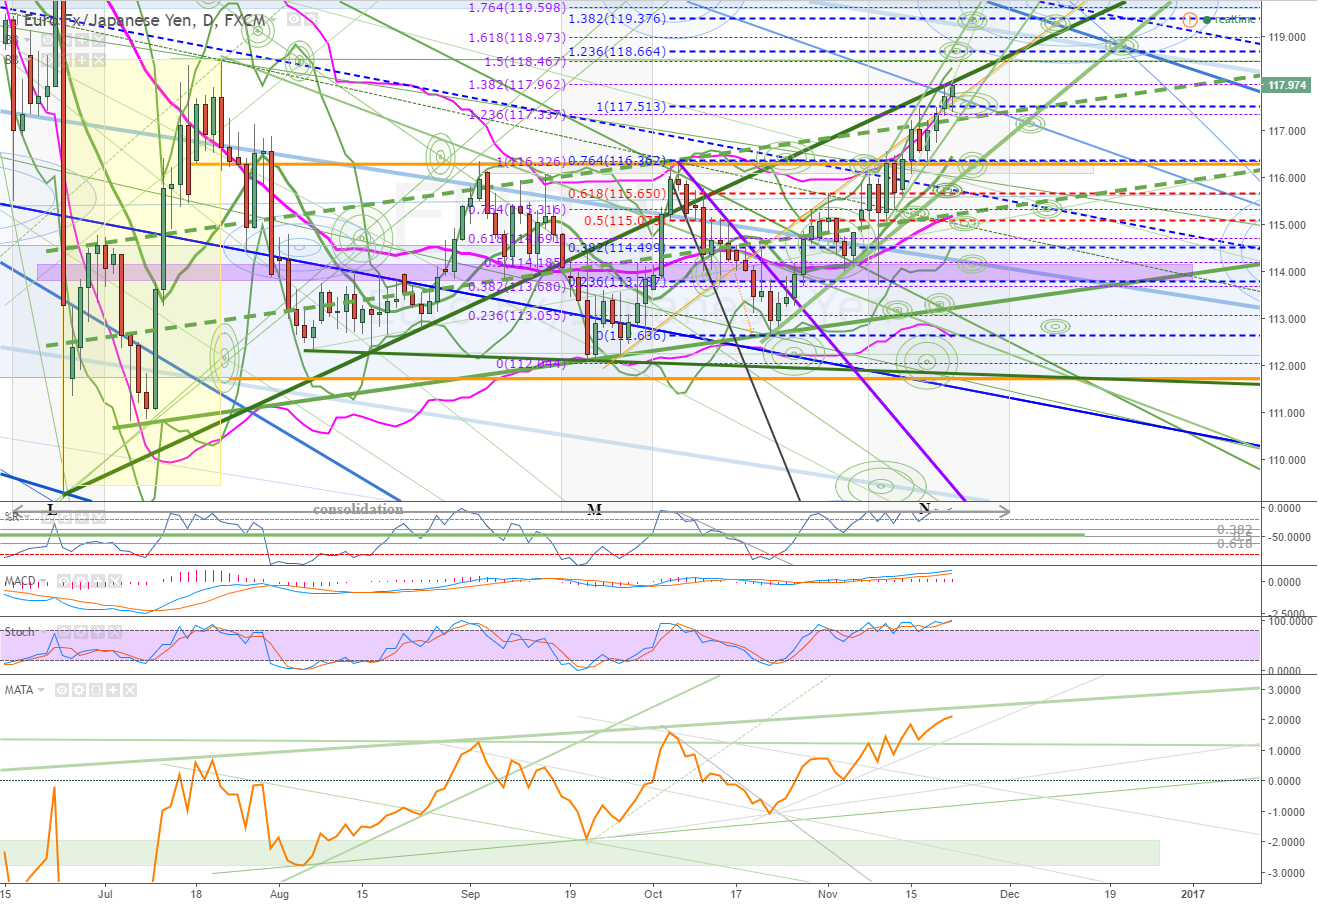
Market has reach a significant technical and is respecting it at lower levels - dark green s/r from the lowest low.
Breaking through or bouncing off could see a significant move as we can see has occurred previously.
240
Green s/r from daily chart can be seen here as the green s/r that has held the market. Breaking through and finding support from this would indicate a continued increase in velocity for the lift.
Holding and bouncing off of the green s/r could see a significant pullback. Note the current pattern with the green s/r as the resistance and black s/r the support is an expending wedge. Significant support from other technicals can also be seen - these need to be broken through for a larger pullback to occur. Green dashed s/r offers a potential trigger consideration - for both a bounce off of, or a break down through.

60
Here we can see the expanding wedge between the green and black s/r's. A break above the green would indicate more lift - potentially significant. Ideally we would want to see this retested and support from it once it is broken.
If resistance holds, then the pattern suggests we could see a drop back to the black pattern support. Breaking down through the black support and the green dashed s/r would be indications of more drop to go. If support is found and the market lifts from the lower black pattern support, it offers a risky entry possibility - the market could then resume the larger trend and lift up out of the consolidation and through the green s/r above - this would be the start of the next wave up. However there is also resistance on the way up, including the pattern resistance that could stop it - why it is consider more risk. Once the current consolidation pattern breaks to the upside, the probabilities increase that the next wave up has started.
