SENTIMENT: ITS NOT COMPLACENCY BUT PARALYSIS!
Complacent: Contented to a fault; self-satisfied - The American Heritage Dictionary
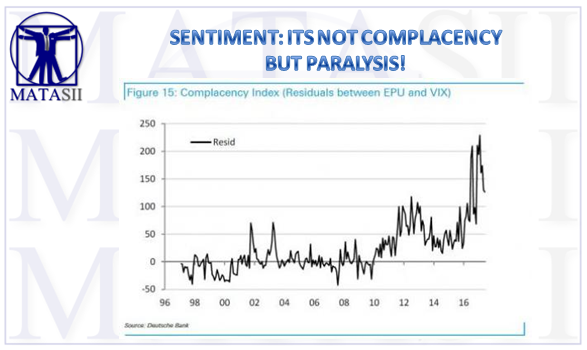
Three weeks after the volatility-obsessed Deutsche Bank derivatives expert Aleksandar Kocic went so far as to not only qualify what he said was pervasive market complacency, but to also quantify it, and observe the exact moment when the market stopped caring and reacting to macro developments, some time in 2012...

... Canaccord Genuity's Brian Reynolds is out with a new report that takes conventional wisdom about prevailing market sentiment and flips it on its head.
In "does low volatility mean that investors are complacent" the Canaccord analyst writes that it has become common wisdom that the current low level of volatility as measured by the VIX is an indication investors are “complacent,” and that the complacency is a potential negative for financial markets. Making his case known up frong, Reynolds promptly notes that he "completely disagrees with this notion."
In the last month, Bloomberg has published over a dozen stories quoting noted investors about their worries over complacency. These worries have spread to policymakers. Three weeks ago, the president of the San Francisco Fed said he was “somewhat concerned about the complacency in the market…there seems to be a priced-to-perfection attitude out there…” and “the stock market is very much running on fumes.” That same day, the vice chair of the Fed said, “We know that complacency must be avoided.” Last week, the president of the Kansas City Fed said the “combination of asset valuations…together with low levels of implied volatility in equity and bond markets, could be signaling broader complacency in financial markets.”However, in looking at a range of asset classes, we do not see much evidence of self-satisfied or smug behavior. Instead, we find a range of emotions. In the credit market, we see aggressive desperation in the hunt for yield among investors, not complacency.
Reynolds first points out something that he has been discussing in recent reports, namely that public pensions have become the dominant investor. Due to past underfunding and losses, they need to make 7.5%, and are aggressively trying to do so in the credit market.
He added that investor purchases of new corporate bonds are on pace to set a record for the sixth year in a row. That record pace is continuing despite all the geopolitical worries out there. In just the first two days of this week, credit investors bought over $33 billion of new corporate bonds. That is a staggering number for any time of year. A normal day in a normal month would see $5-7 billion of purchases. In the seasonally slow period between the Fourth of July and Labor Day, a normal day would be somewhat below that range.
And even as companies are issuing a record amount of corporate bonds, the demand for those bonds by investors is outstripping that supply. The result has been a dramatic narrowing in credit spreads since the oil-related panic in the winter of 2016, as shown by the red line in chart below. Investment-grade bond spreads fell to the 100 basis point level yesterday, and are now just 7 basis points away from the narrowest level of this eight-year-old credit boom.

The chart above also includes the IG credit derivative index spread in white. It paints a very different picture than credit spreads do.
The investment-grade bond market tends to be populated by long-only investors, as it is difficult to locate bonds for shorting. The credit derivative market thus tends to be populated by investors who are looking either to hedge long positions or take an outright bearish stance on financial markets. Since the winter of 2016 panic, investment-grade credit derivative spreads have narrowed somewhat, but have failed to keep up with the narrowing of credit spreads. This action is reminiscent of the activity following the “London Whale” panic in early 2012. Once that panic passed, credit spreads narrowed much more than credit derivative spreads did over the ensuing two and a half years.
To Reynolds, this disparate action suggests that credit derivative investors have nowhere near the enthusiasm and aggressiveness that credit investors do, and are far from complacent. Furthermore, to the Canadian bank this dichotomy also suggests that "the stock market is likely to move higher in fits and starts, with the occasional scary pullback, as many of the state and local tax increases that have been fueling the credit boom are set to continue for a period of years."
Now recall that as we showed on Monday using a Credit Suisse chart, there has been just one buyer of stocks since the financial crisis: corporations themselves.

As we have shown in the past, and as Canaccord points out again, these relentless credit flows have fueled stock buybacks, "which have been the driving force for higher stock prices."
And yet, despite those record buybacks, stock market volume has been anemic. Since the winter of 2016 panic, the 200-day moving average of NYSE volume, shown in yellow in the next chart, has been in steady decline. This mirrors what was seen in the years following the “London Whale” panic. To Reynolds, this lack of volume is more reflective of paralysis than complacency among equity investors.

Of course, it could well be both... or neither: just last week Bloomberg had a column explaining how in a market in which there is no volatility, traders now resort to tinder (and golfing during the day), to kill the time from 9:30am to 4pm when nothing seems to happen any more.
However, to the extent that equity investors are doing something, they seem to be shorting stocks at least according to one metric.
As Canaccord shows in the next chart, short selling hit a record in 2015, and set another record after the panic in the winter of 2016. Following that last high, it receded until the end of 2016. However, short selling has risen every month this year, and is closing in on a new record. To Reynolds that is "the opposite of complacent, yet policymakers seem not to notice this trend."

Yet even this data is hardly as clearcut as Canaccord makes it seem because recall we showed last week that as the S&P hit all time highs, SPY short interest had dropped to levels last seen just before the financial crisis. It remains unclear what may be behind the divergence of near record high short interest in the S&P vs record low in the SPY, although on the latter, it likely has to do with hedge funds putting on pair trades in which they hedge single name stocks with a broad market (ETF) short.

In any case, we go back to Canaccord's conclsution according to which "Investors are not complacent. Their stances range from extremely aggressive to bearish."
Reynolds ties it all together as follows:
Those opposing forces have led to a compression of volatility. When stocks have rallied strongly, they have then been met with investor selling. When stocks sell off, the buybacks have picked up after the selling runs its course. That has been the case for more than eight years. Those forces have led to an equity bull market that moves higher in fits and starts, with some brief pullbacks from time to time. Given the positioning of equity investors and continued flows into credit, we do not see that pattern changing for some time."
If Reynolds is right, and he may well be, there is just one catalyst that can break this chain of events: a forceful Fed intervention which will make it all too clear that what has worked until now, no longer will. To be sure, the Fed has made several very pointed statements in that regard in recent weeks, however as has been the case for the past 8 years, it still has to actually do something to prevent what increasingly more banks are openly calling an asset bubble and in some cases, even begging the Fed to intervene.