SENTIMENT SIGNAL FLASHING FOR FIRST TIME IN 40 YEARS
The recent stock sell-off spooked II bulls in a big way
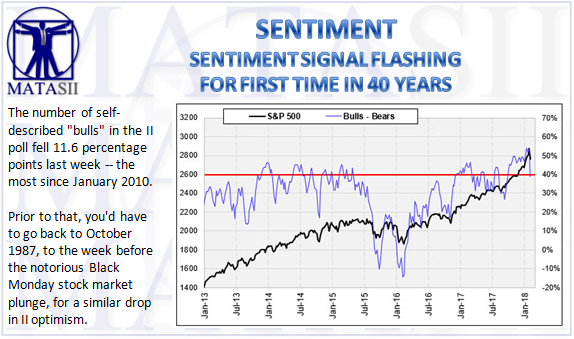
SOURCE: 02-08-18 Schaeffer Financial
Last week, we remarked on a bullish extreme in the weekly Investors Intelligence (II) sentiment survey, in which the "bulls minus bears" line jumped to the 99th percentile of its annual range. However, in light of the recent stock market sell-off, II respondents abandoned the bullish camp at a rate seen just one other time since the Black Monday crash, sending up a sentiment signal not seen in decades. Below, we take a look at how the S&P 500 Index (SPX) tends to perform after these rare signals.
Specifically, the number of self-described "bulls" in the II poll fell 11.6 percentage points last week -- the most since January 2010. Prior to that, you'd have to go back to October 1987, to the week before the notorious Black Monday stock market plunge, for a similar drop in II optimism.

The percentage of II respondents now expecting a correction skyrocketed by 8.7 percentage points, to 30.1% -- the highest since September. The rest of those former bulls migrated to the bears' camp, with the percentage of bearish II advisors jumping 2.9 percentage points to 15.5% -- the highest since October. As such, the bulls-minus-bears line went from above 50% last week to below 40% this week.

There have been just seven other times in history in which this barometer took such a nosedive, the last time happening over 40 years ago, in 1976, according to Schaeffer's Senior Quantitative Analyst Rocky White. In fact, all seven signals occurred between May 1965 and May 1976.

If history is any indicator, the stock market could have a rough few months ahead. One week after signals, the S&P was down 1.14%, on average, and higher just 14.3% of the time. That's compared to an average anytime one-week gain of 0.15%, with a win rate of 56%, looking at data since 1965.
It's a similar story one, three, and six months out, with the S&P in the red, on average, at all checkpoints. In fact, three months after a signal, the S&P was down 1.42%, on average, with a lackluster win rate of just 28.6%. For comparison, the broad-market barometer has averaged an anytime three-month gain of 1.93%, with a win rate of 64.5%.
Likewise, six months after II signals, the index was down 1.74%, on average, compared to an average anytime gain of 3.89%. While the SPX was higher 5.42%, on average, a year after previous signals, and in the black 71.4% of the time, the gains weren't as big as usual, with the S&P averaging a one-year anytime return of 7.9%.
