Gordon T Long
Global Macro Research | Macro-Technical Analysis
MACRO
GLOBAL ECONOMICS
THE TRIFECTA RACE
The race is underway on what will deliver the hardest blow to the coming US recession. It will either be:
-
- A liquidity shock of the increased funding of the US Treasury’s TGA, as a result of the massive increase in the US Debt ceiling and government spending to be a rate greater than required to maintain stability through the Covid-19 pandemic.
- The unexpected slow reopening of the Chinese Economy from its Covid lockdowns and a Chinese Credit Impulse insufficient to once again save the global economy.
- Slow overall global growth, falling productivity and inflation though falling, still at persistently elevated levels.
US Real Gross Domestic Income (GDI versus GDP), a measure of total economic activity, shrank in both the fourth quarter and the first quarter. Two negative quarters of output growth are one indicator of a recession. The GDI highlights that though the US economy has gone through periods where output has expanded faster than employment, seldom as we are seeing now has it been other way around?
What explains these dissonant signals is productivity, or output per hour worked. It is cratering. That raises questions about whether the much-hyped technology adoption during the pandemic and, more recently, artificial intelligence are, or will, make a sufficient difference. It also raises the risk that the Federal Reserve may have to raise interest rates more to tame inflation.
WHAT YOU NEED TO KNOW
A PIVOTAL WEEK – The Road To Economic Disaster Has Now Been Cast!
 The increase in the US Debt Ceiling signed into law this week effectively institutionlalizes the coming era of US Stagflation when combined with a weak Chinese Reopening and steadily deteriorating global economic strength. The US federal government’s path to financial calamity is hardwired into the budget process, as so-called “mandatory spending” on programs like Social Security, Medicare and Medicaid will now represent a whopping 71% of the US budget, more than double the share in 1965. Meanwhile, interest payments alone are consuming ever-higher shares of federal revenues with net interest costs now planned to minimally consume 40% of government revenues within a very short 10 years.
CHINA’S REOPENING – Further Post-Video Data Is Alarming!
-
- China’s April economic indicators underperformed, with declining industrial production, retail sales and fixed asset investment.
- Low confidence may hinder broad recovery. Chinese consumers may lack pent-up demand due to limited cash transfers during Covid lockdowns and reported wage cuts.
- Challenges include weak consumer strength, property market issues and external geopolitical tensions.
- No significant new stimulus measures are expected this year, despite full recovery in domestic mobility metrics.
- Investments in China-centric portfolios continue to disappoint.
DEBT CEILING – It’s all in the Details!
— THE APPROVED INCREASE IN THE DEBT CEILING “SCREENS” FROM THE PUBLIC THE FOLLOWING:
-
- The VISIBILITY to understand that promised Social Security and Medicare benefits are unsustainable — particularly for the youngest Americans, who are currently compelled to fund benefits for older Americans in a coercive Ponzi scheme.
- The RESOLUTION to be less likely to support costly foreign interventionism, to include the more than $113 billion already spent on the proxy war against Russia in Ukraine — more Americans would question the premise that their security is impacted by who controls Ukraine’s heavily ethnic-Russian Donbas region.
- The MOTIVATION to toss aside the rose-colored glasses through which they view big-spending proposals, like last summer’s $375 billion package to fund a crony-enriching and quixotic battle against climate change.
- The MOTIVATION to apply greater scrutiny to military spending, with more people questioning why the Pentagon should spend more than $7.3 trillion over the next 10 years — more than it spent in the decade that encompassed the peak of US warfare in Iraq and Afghanistan.
- The MOTIVATION to cast a harsher eye on thinly-disguised vote-buying schemes — from student debt cancellation to reparations for black people — and increasingly disfavor all varieties of wealth redistribution, from subsidies for Iowa farmers to (illegal) aid for Israel.
GLOBAL ECONOMIC REPORTING: What This Week’s Key Global Economic Reports Tell Us
-
- Global PMIs are weakening with Global Manufacturing predominantly in Contraction.
- Inflation is falling primarily due to Supply Chains returning to the pre-Covid normal, but still remains at elevated levels.
- Gobal Consumer Confidence and Sentiment continues to weaken depressing retail sales growth, particularly in China.
CONCLUSION
 ECONOMISTS FOCUSING ON US LABOR COSTS
-
- Wage growth is still running above of 5%. The Fed needs wage growth to slow to around 3.5% before it can be confident inflation will return to 2% on a sustained basis.
- Workers are losing some of the impetus to test the labor market in search of new positions. Workers who land new jobs command larger wage increases.
- This is the second month we’ve seen a full percentage point decline in pay growth for job changers. With pay growth slowing substantially, wage-driven inflation may be less of a concern for the economy despite robust hiring.
CHINA’s REOPENING – Further Post-Video Data Is Alarming!
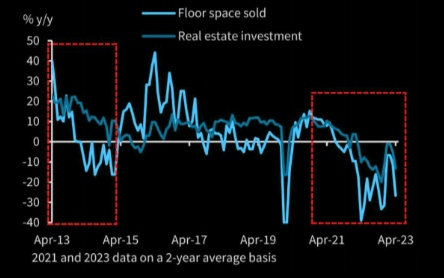 China’s economic recovery from draconian zero-Covid controls is faltering. Investors had very high hopes earlier this year that the world’s second-largest economy would roar back to life and help offset weakness in the global economy. However, six months later, those same hopes have faded into disappointment.
CHART RIGHT: The health of China’s Real Estate Sector is central to strong reopening recovery. The results so far are troubling.
Chinese Communist Party leader Xi Jinping, addressing officials attending the first National Security Commission meeting since the CCP’s 20th National Congress last year, told them to carry forward the “spirit of struggle”. They must deeply understand:
“.. the complexity and difficulty of the national security issues we now face have increased significantly and must adhere to bottom-line thinking and worst-case-scenario thinking, and get ready to undergo the major tests of high winds and rough waves, and even perilous, stormy seas.”
GROWING CONCERNS
-
- China’s April economic indicators underperformed, with declining industrial production, retail sales and fixed asset investment.
- Low confidence may hinder broad recovery. Chinese consumers may lack pent-up demand due to limited cash transfers during Covid lockdowns and reported wage cuts.
- Challenges include weak consumer strength, property market issues and external geopolitical tensions.
- No significant new stimulus measures are expected this year, despite full recovery in domestic mobility metrics.
- Investments in China-centric portfolios continue to disappoint.
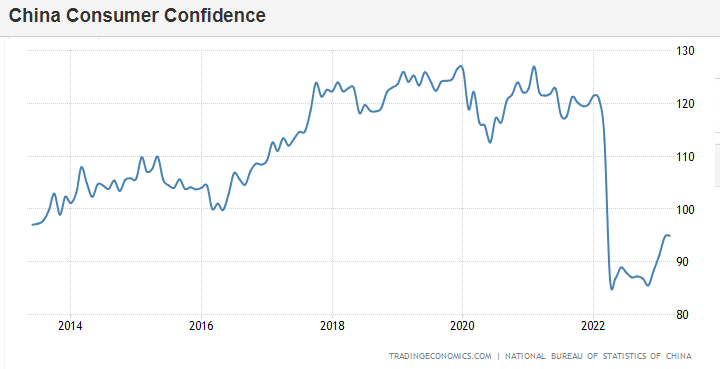
CONSUMER CONFIDENCE
We outlined in this month’s UnderTheLens ” ” video how central Domestic Consumer Spending was to China’s recovery strategy. A chart not inlcuded in the video was that status of Chinese Consumer Confidence. We show it below with no comment required.
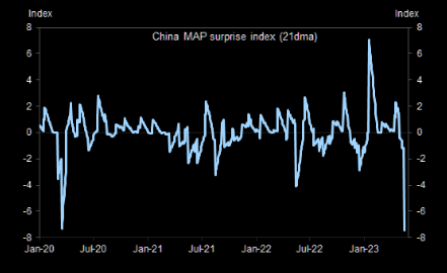
CHINESE MACRO SURPRISE INDEX
A “Soft” Patch or a “VERY Rough” Patch? The Goldman Sachs’ China MAP surprise index fell by the most since the initial Covid outbreak in early 2020. We also did not show in ther video the Goldman Sachs’ MAP Surprise Index.
COMMODITY IMPORTS TELL THE CHINESE STORY
 Sliding commodity prices give further input about China’s economic growth miracle, which has yet to reemerge and ignite a spark. Maybe that’s because of an aging population, declining workforce or supply chain reset, or enormous debt loads — whatever is hobbling China’s recovery effort might indicate the days of expanding at 6% to 8% a year are over and only 2% or 3% is the new normal.
On the commodity front, two of the most important commodities to China’s economy, copper and iron ore, have been moving lower over the last several months. But five often overlooked commodities essential for economic growth are also sending chilling signs of economic alarm.
-
- Copper
- Iron Ore
- Glass
- Styrene
- Corn Starch
- Trucked LNG
- Paper Pulp
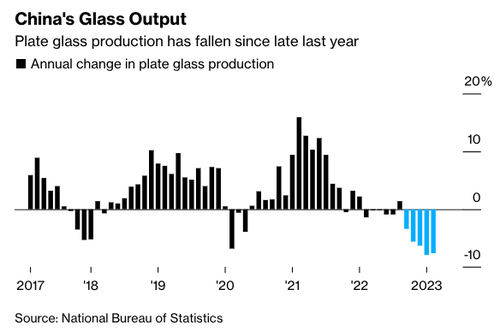
GLASS: China accounts for more than half of the world’s plate glass production thanks to the rapid growth of high-rise buildings and vehicle sales in recent decades. Similar to other industries, low margins and supply gluts have troubled producers for years, forcing them to cut output in recent months.
The situation this year looks even more challenging. Glass futures on the Zhengzhou Commodity Exchange have plunged nearly 20% in the past month, a period when demand usually picks up. The reasons include China’s teetering property market and weaker-than-expected vehicle output in April.
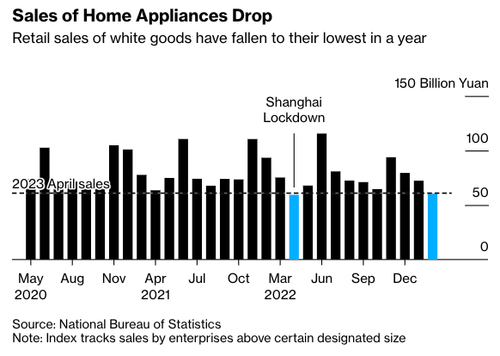
STYRENE: Fewer home buyers also means less demand for the purchases that often accompany a new place to live. The price of styrene monomer, a material used for the plastics and rubber that go into appliances like fridges, has declined. China has been the world’s fastest growing market in the past decade with capacity climbing to over 40% of the global total.
Dalian futures fell last week to their lowest since February 2021, after a near-5% drop in home appliance sales in the first quarter, according to the National Appliance Information Center. The problems are slower growth in personal incomes and a “low-frequency sales cycle” for white goods, according to Wu Haitao, a director at the center.
DEBT CEILING – It’s all in the Details!
There are two central questions that everyone is conspiculously avoiding:
-
- Why Did The Negotiators Take the Cap Off (now Zero Caps)?, and
- Why Out of Nowhere Did They Include a Second Year? (ie the first year of a new administation)
There is a lot more going on behind the curtain than we are told!
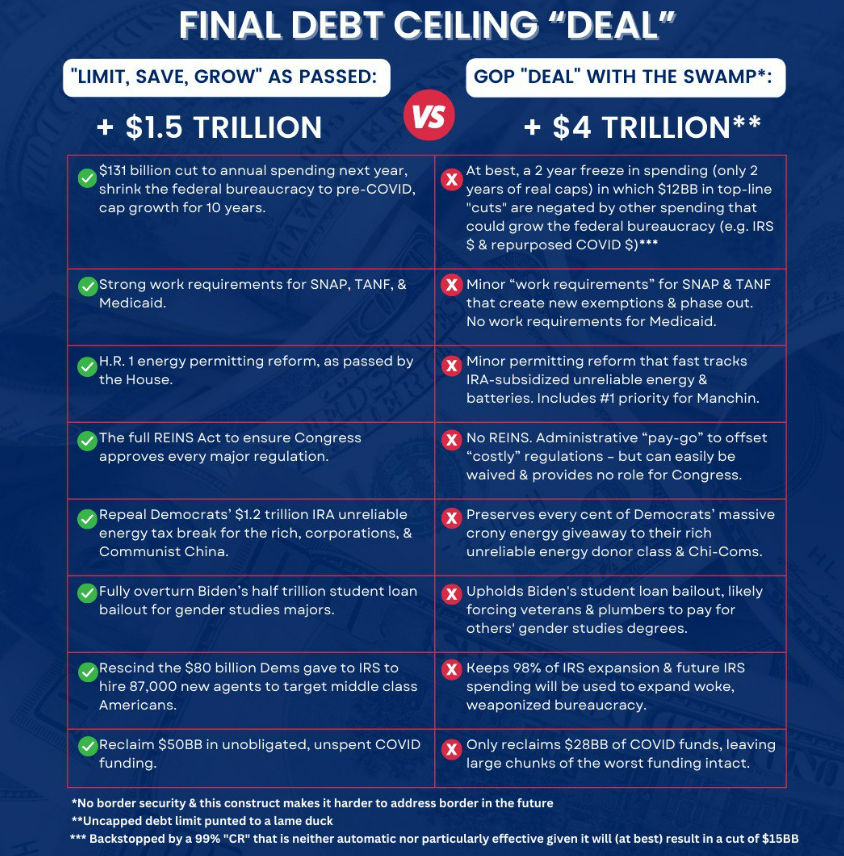
Presidential Candidate Florida Governor Desantis: “Our country is careening toward bankruptcy, and after this debt ceiling “deal” it will still be careening toward bankruptcy. The deal green lights $4 trillion in new debt over the next year and a half, locks in inflated levels of spending from COVID, and keeps 98% of the Biden IRS expansion”.
Americans Lose Out in Debt Limit Deal
-
- At a time when Americans are struggling to balance their budgets as the cost of gas, groceries and childcare continue to rise, Republicans had a real chance to protect families and fight sky-high inflation and interest rates by cutting government spending.
- Republicans entered negotiations with a strong hand, having passed the Limit, Save, Grow Act in April. (SEE DETAILS BELOW)
- Their plan paired robust spending cuts and pro-growth policies with a modest debt limit increase—giving Americans back $4 for every dollar of increased federal debt. While President Biden demanded a blank check and refused to negotiate, House Republicans passed the only proposal to raise the debt ceiling in Congress. Sadly, that leverage was given away in closed-door negotiations.
- Most fiscally conservative and pro-growth policies contained in the House-passed Limit, Save, Grow Act were stripped out or diluted. When Americans last gave their representatives in Washington this much support to rein in the government in 2011, Congress signed into law the Budget Control Act, which cut discretionary spending roughly 15 times more than the deal in front of us today. The new agreement essentially leaves untouched Biden’s slush fund for 87,000 new IRS agents to audit American families. Additionally, this bill could lead to increased overall spending levels next year, potentially giving up on the $132 billion in real upfront cuts promised by Limit, Save, Grow Act. In exchange, this bill would give the Biden administration and the federal bureaucracy a blank-check debt limit suspension for two years.
- The agreement isn’t without victories, of course. Permitting reform will be a boon to allow businesses to build with less red tape. Work requirements will have a modest but real impact in preserving government programs for those who truly need them. But those victories are smaller and fewer in number than they should be.
Do not be fooled! This agreement will now continue America’s trajectory towards economic destruction and expanded federal control.
I encourage you to read an honest assessment of what has been negotiated by David Stockman, former OMB Budget Director under President Ronald Reagan.
Speaker McCarthy’s Rotten Deal
Here is one excerpt devoid of all the numbers Stockman lays out as proof:
…. CBO’s most recent projection shows new deficits of $20.3 trillion over the 10-year budget window—and that’s based on Rosy Scenario economics with no recession, inflation gone away and only gently rising interest rates. Throw-in even a modest dose of realism about the economics and back-out the huge tax increases and spending cuts built into the out-year baseline, which will never be permitted to actually materialize, and you have a de facto public debt of $55 trillion by the early 2030s or more than 200% of the current GDP.
What that amounts to is a long-term structural fiscal equation which is a guaranteed route to financial and political disaster. Thus, CBO’s end year numbers (FY 2033) show current policy receipts at 18.1% of GDP and spending at 25.3% of GDP.
Folks, you can’t borrow 7.3% of GDP every year from now until eternity and get away with it; and most especially not when American society is plunging into a 100 million strong baby boom retirement wave—accompanied by a shrinking work force and tax base owing to collapsing birth rates and Washington’s idiotic migrant worker internment camps at the southern border.
Stated differently, fiscal governance in Washington is totally kaput. They never pass an annual budget resolution and enforcement plan, which was taken as a sacred duty back in the day; and there are never even annual appropriations bills for the mere 25% of the budget still subject to the Congressional “power of the purse”.
Instead, what occurs is a perennial string of short-term Continuing Resolutions (CRs) followed by an 11th hour, 3000 page pork-ridden “Omnibus Appropriations” bill that no one has read and which gives log-rolling (i.e. more domestic for more defense) a new definition.
In short, the debt ceiling was the only fiscal control mechanism left. And even that has been neutered time after time in the last decade by the hideous, flat-out lie that if the Treasury on any given day is one dollar short of being able to cover all of its due bills it must default on each and every one of them including interest payments, thereby destroying the credit of the United States. Yada, yada.
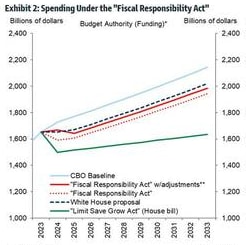
CHART BELOW – LEGEND
-
- $1,600 on Vertical Axis is $1.6 Trillion in “Discretionary” Spending.
- CBO Baseline is Government estimate of all Spending.
- White House is lower because of “Gimmick” where it takes out “Emergency” estimated Spending.
- The RED line is the Negotiation just reached by Speaker McCarthy, and is virtually the same as the WH Spending.
- The Green Line is the BILL passed by the House, ignored by Senate and WH ( it cuts $4 Trillion out of $50 Trillion).
- The “Russ Vought” Budget (Republican Budget Strategist) would cut $17 Trillion. That would have been the required negotiation budget if you want to stay at ONLY $32 Trillion, now we are racing to $50 Trillion!
-
- The “compromised” Debt Ceiling created a Permanent “COVID” Budget, a new CRISIS Socialist Baseline – ALL weaponized Government policies remain funded and in place.
- The adjusted caps look likely to reduce spending by 0.1-0.2% of GDP Y-o-Y in 2024 and 2025. That is $50 Billion out of $50 Trillion Debt in 10 years.
- 1/1000 of what is Needed – We have to lift 1000 pounds, we just picked up a 1 pound dumbbell emphasis on DUMB.
- The main source of “supposed” savings in the deal is a two-year cap on federal discretionary spending.
- This segment of spending annually accounts for around 25% of total federal spending. (SO $1.6 trillion in top left is ¼ of $6.4 T).
More Stimulus, More Debt, More Fake Economy, Less Productivity, More Inflation, More GOV,
Less Growth, Lower Wages
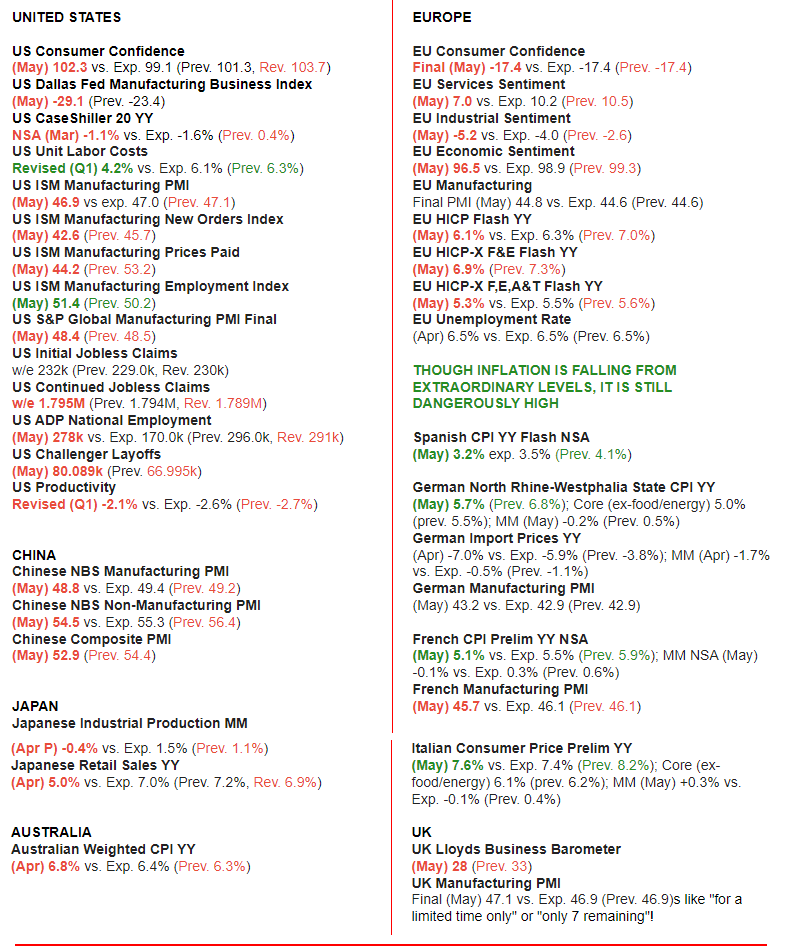
GLOBAL ECONOMIC REPORTING: What This Week’s Key Global Economic Reports Tell Us
 IT JUST KEEPS GETTING WORSE!
Again this week we did another deep dive into the Economic Indicators being released with a particular expansion to include a broad mix of global countries.
The data around the world continues to only worsen!! We present the data in a way you can quickly see what is happening. Anything in Red is further deterioration. In Green is an imporvement over he last release.
WHAT DOES A SCAN OF THE DATA BELOW TELL YOU? – THE MEDIA AVOIDS BAD NEWS!
THIS WEEK WE SAW
Exp=Expectations, Rev=Revision, Prev=Previous
RED = Deterioration, Green = Improvement
CONCLUSION
ECONOMISTS WATCHING US LABOR COSTS
QUITS RATE
The Quits Rate fell to 2.4% from 2.5%, the lowest level since February 2021. Oxford Economics adds, “Though this is still above the pre-pandemic average of 1.9%, it signals workers are losing some of the impetus to test the labor market in search of new positions. Workers who land new jobs command larger wage increases, so a slowing in the quits rate should contribute to some easing of wage pressures.”
ADP REPORT
The latest ADP report was strong, coming in at 278k, down slightly from the prior 291k. It showed further signs of wage growth cooling for both job stayers and job changers. The former cooled to 6.5% from 6.7% and the latter to 12.1% from 13.2%. The Chief Economist at ADP noted “This is the second month we’ve seen a full percentage point decline in pay growth for job changers”, adding “Pay growth is slowing substantially, and wage-driven inflation may be less of a concern for the economy despite robust hiring.”
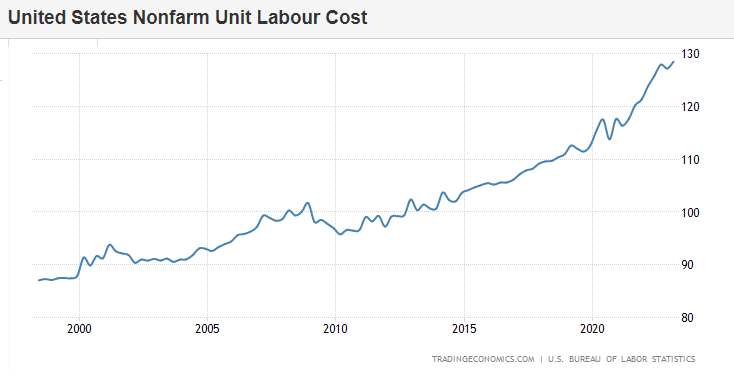
PRODUCTIVITY & LABOR COSTS
The BLS revised Q1 productivity up to -2.1% from the initial -2.7% reading, the combined effect of a 0.3ppt upward revision to output and a 0.4ppt downward revision to hours worked. Meanwhile, the market’s focus was the Unit Labor Costs print being slashed to 4.2% from 6.3%, well beneath street estimates of 6.1%, reflecting a 1.3ppt downward revision to hourly compensation and a 0.6ppt upward revision to labor productivity. Given the sensitivity around any wage/price spiral right now, the data was well received, despite it being backward looking at this point. But, while better than the initial reading, 4.2% ULC is still uncomfortably high for a 2% inflation target. Oxford Economics warns, “our proprietary wage growth tracker shows that wage growth is still running above of 5%. The Fed needs wage growth to slow to around 3.5% before it can be confident inflation will return to 2% on a sustained basis.
A LOOMING TURN WINDOW IS NEAR
FURTHER EVIDENCE FROM OUR KEY TIMING INDICATORS
The three focus areas in this week’s newsletter are:
-
- The Approved Debt Ceiling,
- Further deterioration in China’s “Reopening” and
- The further weakening Global Economic Indicators
Together they support and ensure a US Recession is about to occur despite a rising US Stock Market. The market only needs to see Unemployment accelerate!
Earlier in the year we showed that our economic Leading / Coincident / Lagging indicators were aligning to the major US Recessionary turn occurring around the June Quadruple Option Witch (June 16th). Further details associated with Fibonacci Clusters have only further supported this view since.
KEY FIBONACCI DATES WE HAVE BEEN WATCHING
1- INITIAL FIBONACCI CLUSTER WINDOW SET-UP
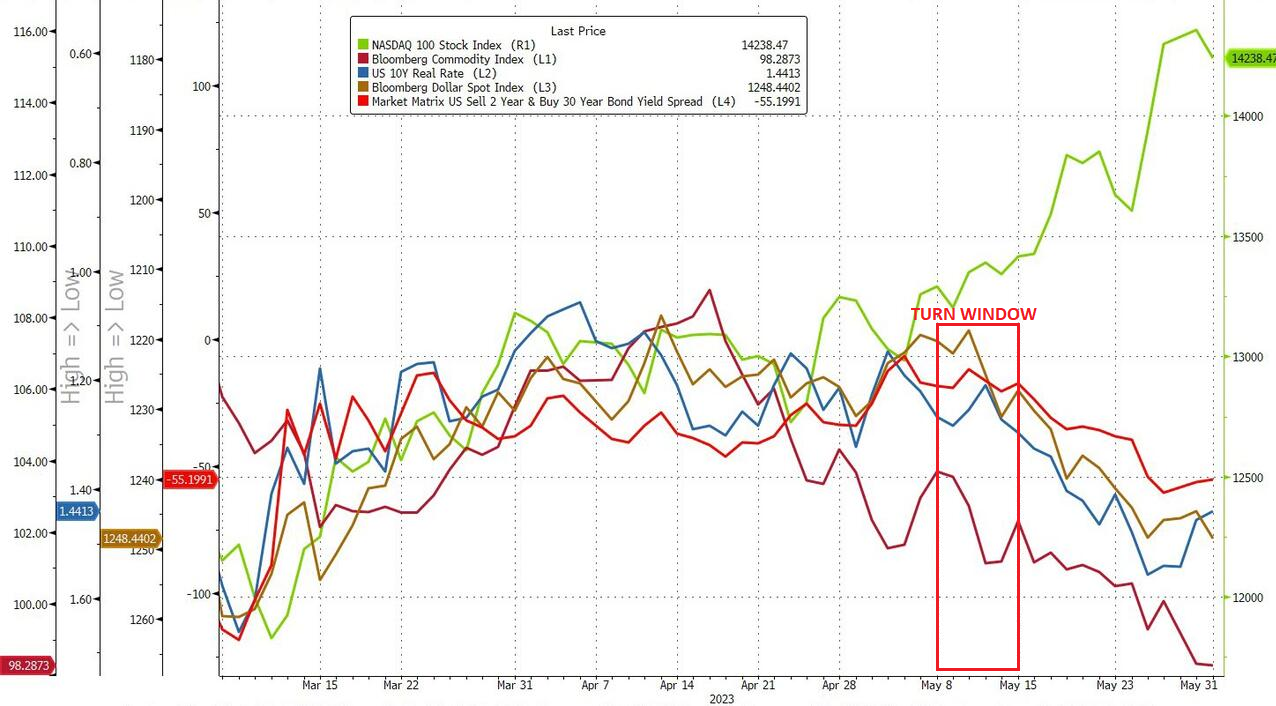 Between May 1st and May 10th we have been in the midst of what is called a Fibonacci Cluster, which often signals an overall market reversal. However, this set of Fibonacci Clusters, we believe, are part of a final turn across multiple global markets.
We are seeing the fall-out from this cluster set in mutlipe US markets. (See chart to the right above).
2- FINAL MAJOR TURN WINDOW – JUNE 16th – JUNE 30th (QUADRUPLE WITCH JUNE 16TH)
We have found that when there is a cluster of 5 or more prior tops or bottoms that are a Fibonacci number of trading days from a future short period of time, a week or so, there is a high probability of a meaningful trend turn, what we call a Fibonacci Cluster turn window.
There is such a window coming from June 16th through June 30th, 2023, with this one having a cluster of 7.
Here are the details of this fast approaching major, 9 Trading Day, Cluster:
-
- June 27th, 2023 is a Fibonacci 21 trading days from the May 25th, 2023 Low.
- June 20th is a Fibonacci 34 trading days from the May 1st, 2023 Top.
- June 22nd is a Fibonacci 89 trading days from the February 13th, 2023 Top.
- June 30th is a Fibonacci 144 trading days from the November 30th, 2022 Top.
- June 21st is a Fibonacci 233 trading days from the July 14th, 2022 Low.
- June 26th is a Fibonacci 610 trading days from the January 20th, 2021Top.
- June 16th is a Fibonacci 987 trading days from the July 16th, 2019 Top.
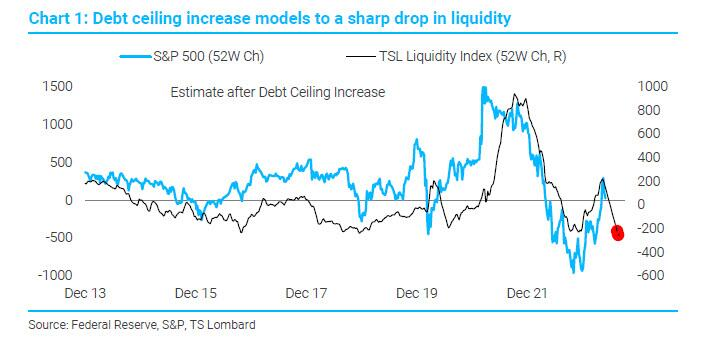
A $1.5T LIQUIDITY SQUEEZE
 Goldman reminds us:
“Monetary liquidity is set to fall sharply over the next 6 months, and this will likely drive major equity indices lower…Equities have had – and continue to have – a strong correlation to monetary liquidity, and this drain in reserves could push stocks down 7 to 10% based on historical relationships seen over the last few years. And in the US, the impact could be even greater this time since this reduction in the quantity of money may also come with an increase in the price of money – i.e. yields in money markets may rise given the cash drain. This could put pressure on bank and investor funding costs, with potential negative implications for broader equity markets.”
According to Goldman Sachs: “After a big global liquidity boost since March, we are concerned that liquidity could tighten significantly over June/July on combination of:
-
- TGA build up
- TLTRO repayments and
- QT
…. leading to a pick up in volatility”.
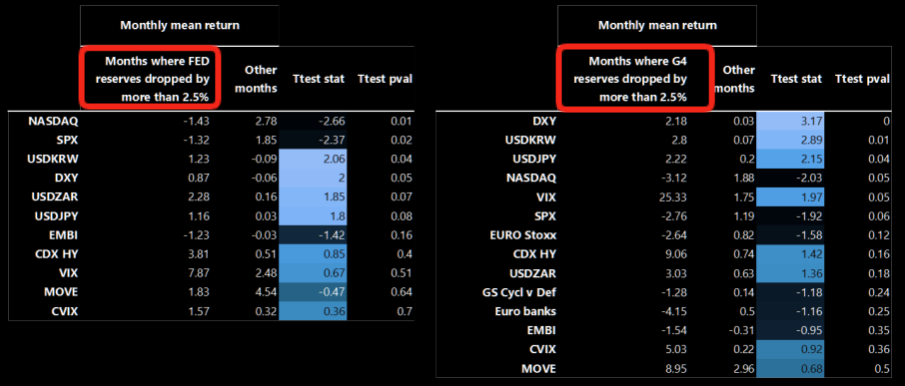
TRACKING RESERVES
Left is Fed reserves, right is G4 reserves. GS recommends NASDAQ put spreads as a relatively cheap hedge for the upcoming liquidity withdrawal.
OUR MATASII CHARTS ARE SIGNALLING THE ABOVE REALITY
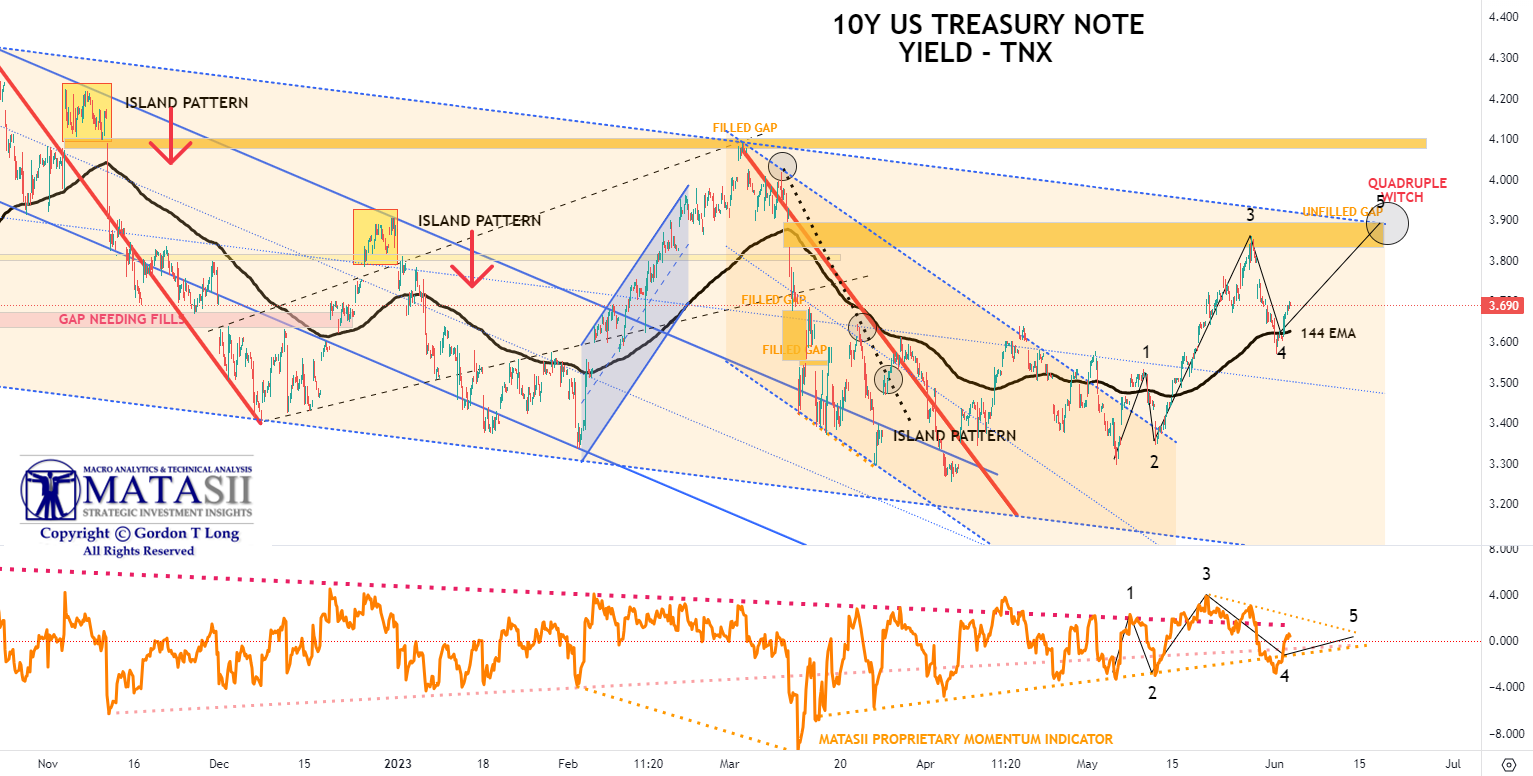
US TREASURY YIELDS (10Y UST – TNX)
The 10Y UST (TNX) Yield turned down at the end of the the initial Fibonacci Turn Window Set-up. We targeted the 144 EMA which it fell to, then immediately ‘bounced’ off of. It appears that a June 16th target of the June Quadruple Witch is a strong possibility.
YOUR DESK TOP / TABLET / PHONE ANNOTATED CHART
Macro Analytics Chart Above: SUBSCRIBER LINK
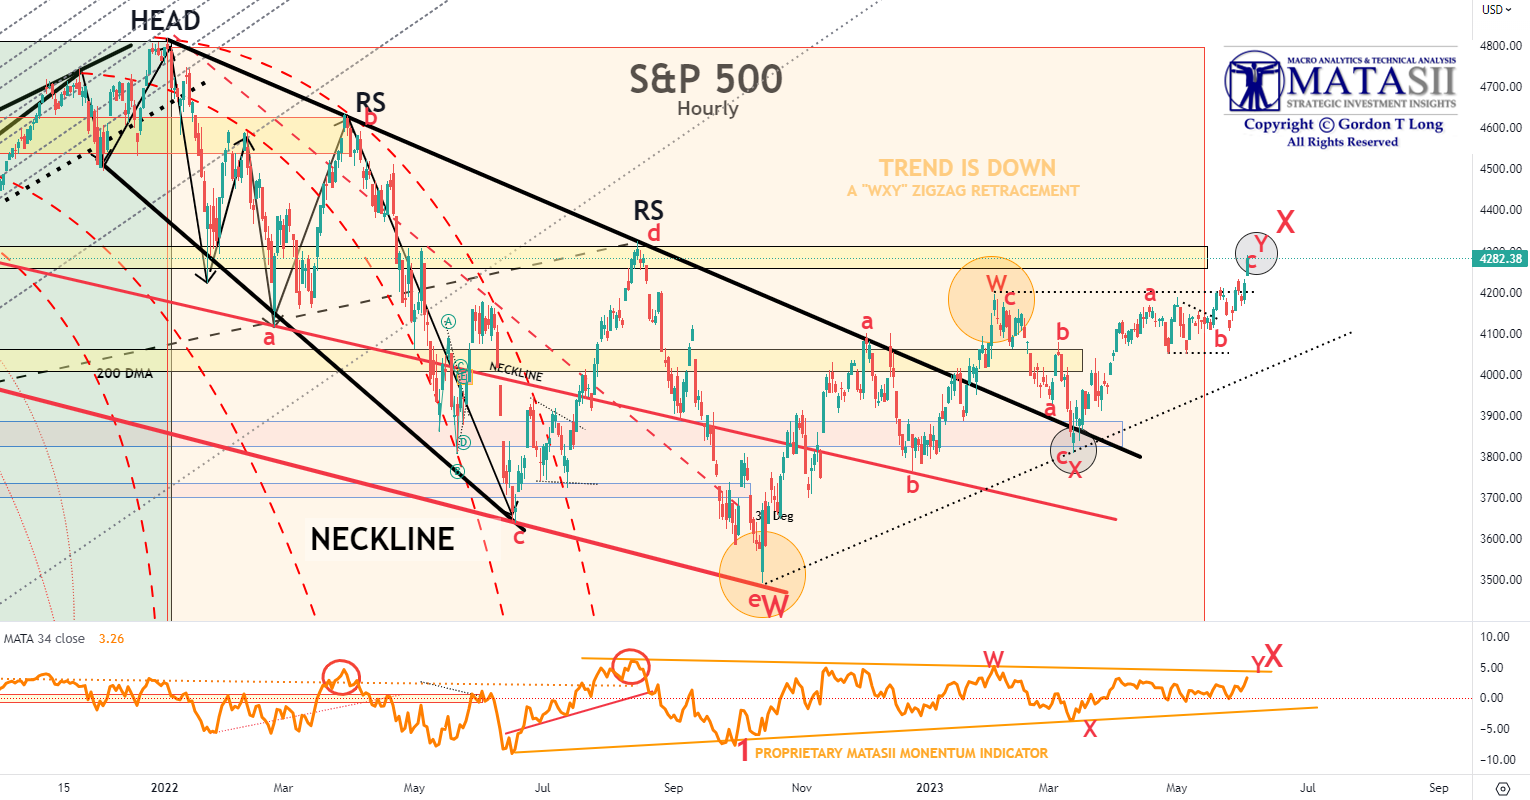
S&P 500 – MAJOR “X”LEG NEARING ENDING
Our Long Term S&P 500 Head & Shoulders pattern also appears to support both the initial Fibonacci Cluster Window as part of the “choppy ending diagonal pattern” exhibited and the June Quadruple Witch turn. Remember the Fibonacci Cluster Window is between June 16th and June 30th.
YOUR DESK TOP / TABLET / PHONE ANNOTATED CHART
Macro Analytics Chart Above: SUBSCRIBER LINK
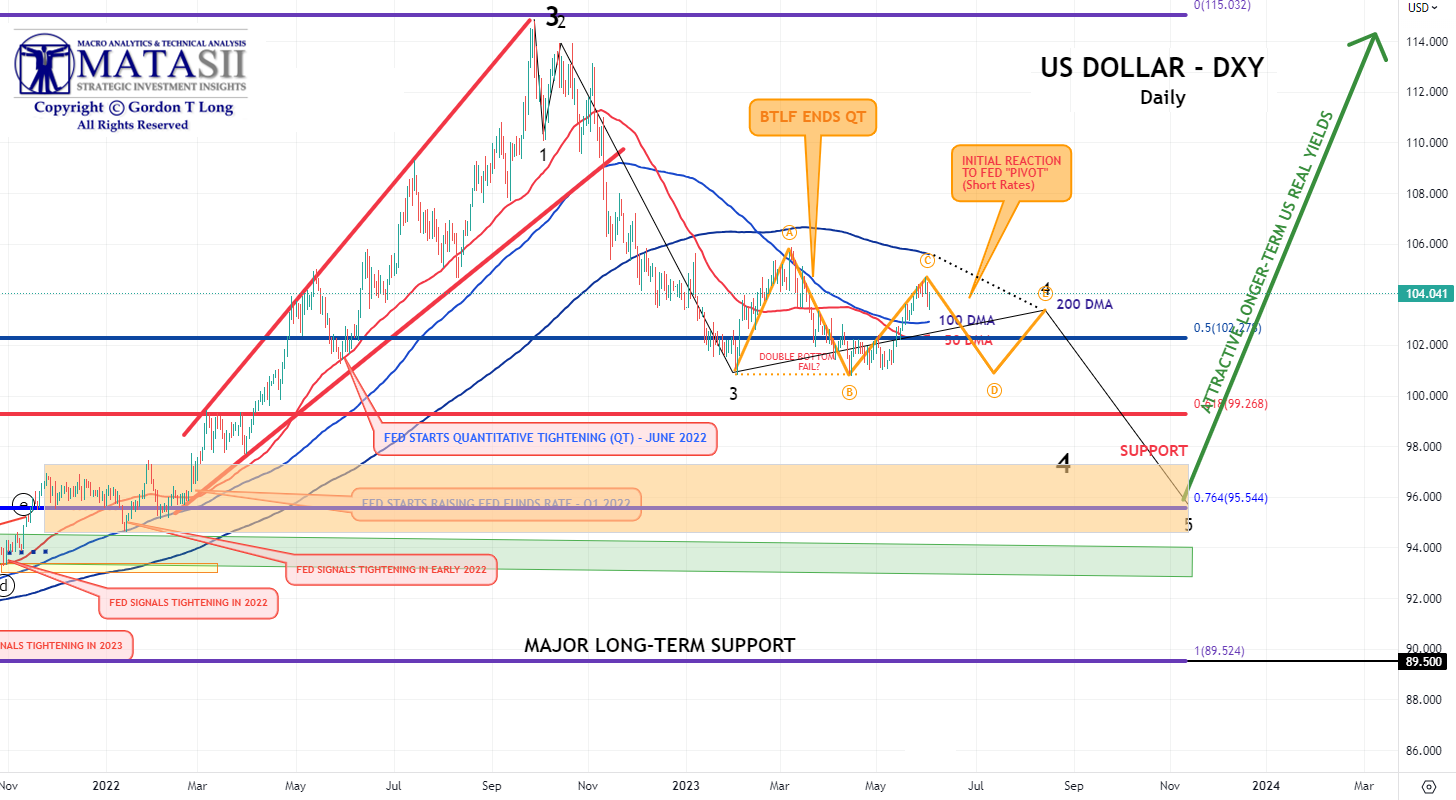
US DOLLAR
The US Dollar appears to need more time for the 10Y UST Yield to reach a near term high before the dollar starts to weaken on US Treasuries not being as attractive and the pressure of the US Treasury’s $1.5T post Debt Ceiling TGA build hitting the market!
YOUR DESK TOP / TABLET / PHONE ANNOTATED CHART
Macro Analytics Chart Above: SUBSCRIBER LINK
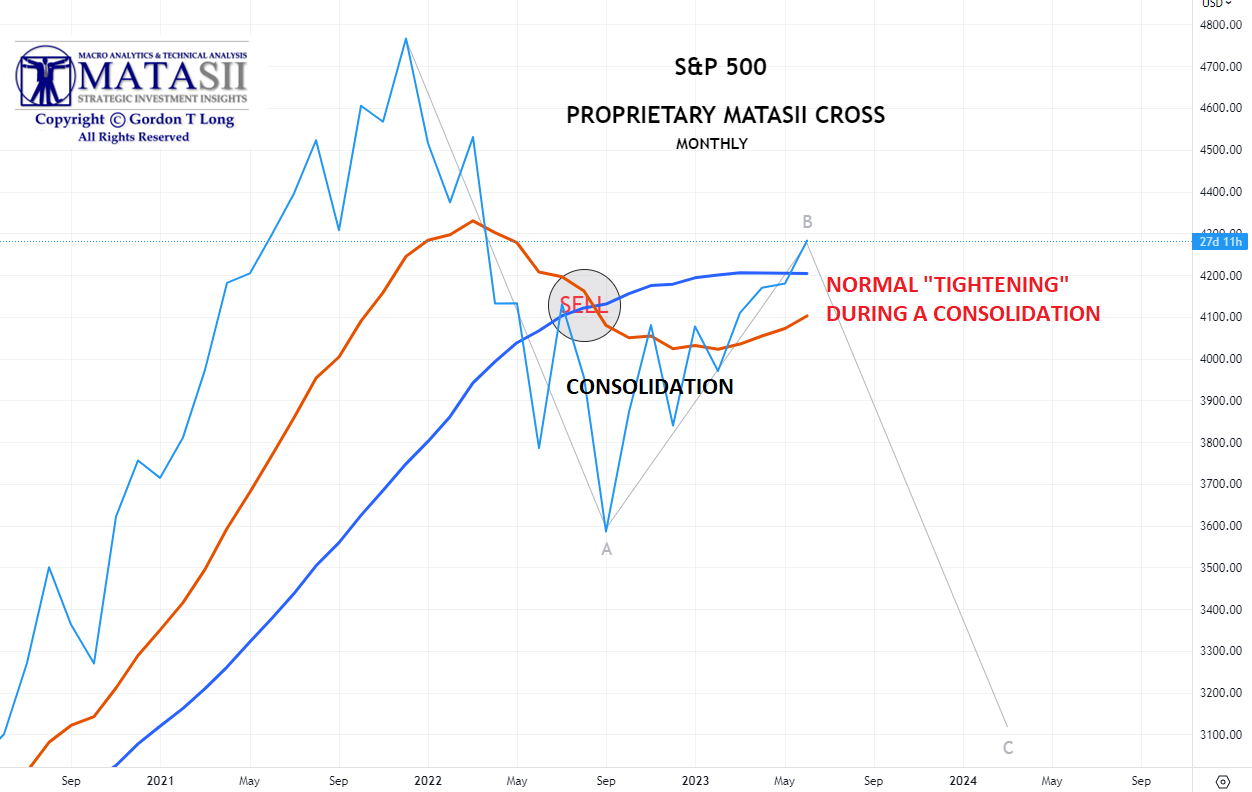
OUR PROPRIETARY MATASII CROSS
Our Monthly MATASII Cross suggests the Bear Market in US equities is still in control as it completes a consolidation before resuming its downward trend.
FAIR USE NOTICE This site contains copyrighted material the use of which has not always been specifically authorized by the copyright owner. We are making such material available in our efforts to advance understanding of environmental, political, human rights, economic, democracy, scientific, and social justice issues, etc. We believe this constitutes a ‘fair use’ of any such copyrighted material as provided for in section 107 of the US Copyright Law. In accordance with Title 17 U.S.C. Section 107, the material on this site is distributed without profit to those who have expressed a prior interest in receiving the included information for research and educational purposes. If you wish to use copyrighted material from this site for purposes of your own that go beyond ‘fair use’, you must obtain permission from the copyright owner.
NOTICE Information on these pages contains forward-looking statements that involve risks and uncertainties. Markets and instruments profiled on this page are for informational purposes only and should not in any way come across as a recommendation to buy or sell in these assets. You should do your own thorough research before making any investment decisions. MATASII.com does not in any way guarantee that this information is free from mistakes, errors, or material misstatements. It also does not guarantee that this information is of a timely nature. Investing in Open Markets involves a great deal of risk, including the loss of all or a portion of your investment, as well as emotional distress. All risks, losses and costs associated with investing, including total loss of principal, are your responsibility.