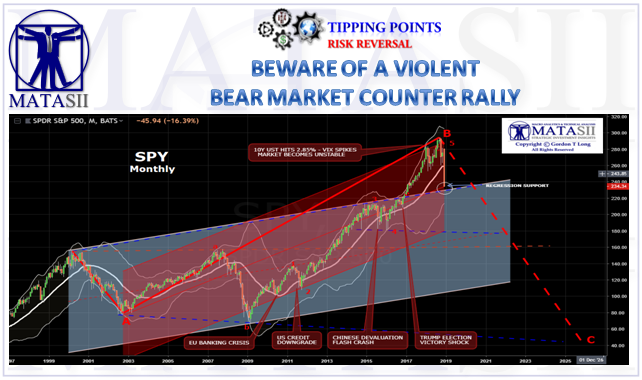
BEWARE OF A VIOLENT BEAR MARKET COUNTER RALLY
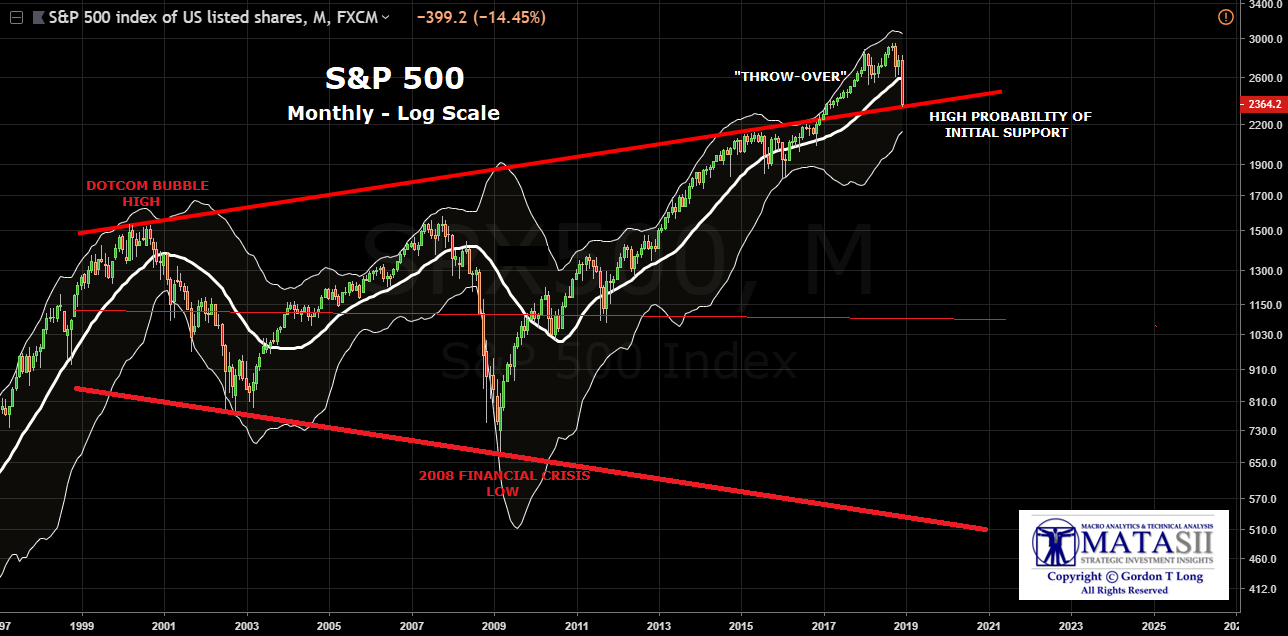
The Long Term Trend Line for the S&P 500 going back to the Dotcom Bubble Highs suggest the market may be near an intial support level. The chart is based on a log scale for dramatic price movement during this 19 year period.
Institutional Investors are prone to use Regression-to-the-Mean Analysis. Shown in red below is the Regression for this period of time. Price is now at the point of Regression.
It is interesting to note that the Trend Channel for this period (shown in blue) shows price to be near the upper channel boundary.
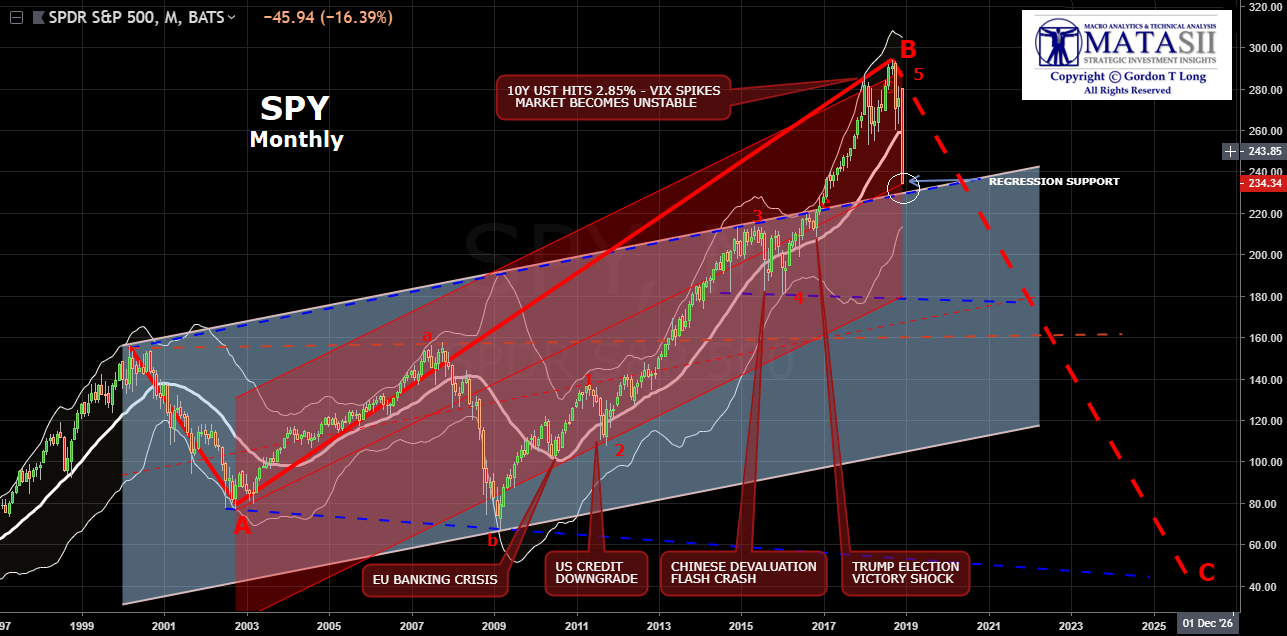
The confluence would suggest that Investors should be highly wary of a violent Bear Market Counter Rally occurring.