BofAML SEES: "THE FIRST STEP TOWARD MARKET EUPHORIA!"
- "The recent inflection from skepticism to optimism could be the first step toward the market euphoria that we typically see at the end of bull markets and that has been glaringly absent so far in the cycle."
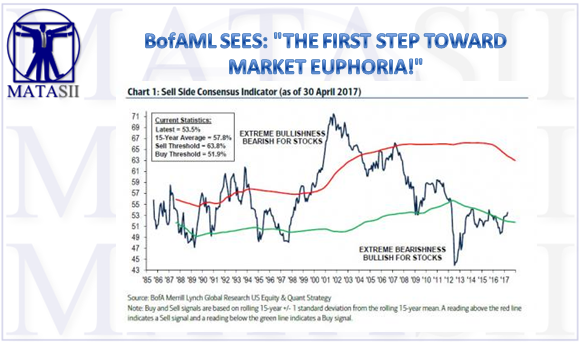
- The Sell Side Indicator is based on the average recommended equity allocation of Wall Street strategists as of the last business day of each month. Wall Street’s consensus equity allocation has been a reliable contrary indicator.
- With the S&P 500’s indicated dividend yield currently above 2%, that implies a 12-month price return of 14% and a 12-month value of 2727. At that level, the forward PE would be well in the 20x.
- When our indicator has been this low or lower, total returns over the subsequent 12 months have been positive 95% of the time, with median 12-month returns of +22%
While one can hardly accuse the market of being particularly nervous at this moment, with the VIX dropping to single digits earlier today for the first time in a decade, and with strategists and pundits explaining to anyone who will listen how this is the "most hated rally ever" despite the S&P trading at all time highs at valuations that are in the 99 historical percentile, an interesting admission was made today by Bank of America which reported that in April, its Sell Side Indicator, a proprietary measure of Wall Street’s bullishness on stocks, rose by 0.6ppt to 53.5, its highest level since August 2015 (recall August 2015 is when the infamous ETFlash Crash took place, sending the Dow Jones brief lower by 1,000 points).
BofA's Savita Subramanian also explains that the indicator moved further into “Neutral” territory, where it has been for the past five months. What is curious is that while sentiment has improved significantly off of the 2012 bottom — when this indicator reached an all-time low of 43.9 — today’s sentiment levels are barely above where they were at the market lows of March 2009.
And yet, while modest the transition is notable, at least to the BofA strategist, who writes that:
"the recent inflection from skepticism to optimism could be the first step toward the market euphoria that we typically see at the end of bull markets and that has been glaringly absent so far in the cycle."

How is this particular indicator constructed? BofA explains:
The Sell Side Indicator is based on the average recommended equity allocation of Wall Street strategists as of the last business day of each month. We have found that Wall Street’s consensus equity allocation has been a reliable contrary indicator. In other words, it has historically been a bullish signal when Wall Street was extremely bearish, and vice versa. See our December report for more details on the Sell Side Indicator.
Implications about potential blow off top aside, what does this indicator suggest about future returns? According to BofA, with the S&P 500’s indicated dividend yield currently above 2%, that implies a 12-month price return of 14% and a 12-month value of 2727. At that level, the forward PE would be well in the 20x.
Subramanian clarifies that while "this is not our S&P 500 target, this model is an input into our target, along with fundamental and technical signals. Historically, when our indicator has been this low or lower, total returns over the subsequent 12 months have been positive 95% of the time, with median 12-month returns of +22%. However, past performance is not an indication of future results."
In short, the bank has spun an indicator that suggests a "first step toward market euphoria" into predicting over 300 points of S&P upside. Which, considering the record $1 trillion liquidity injection by central banks in 2017 alone, is certainly feasible.