240 1020am
Market continued to lift - consolidation occured around the next blue Fib level, and then a lift to the purple Fib lvl and the underside of the green daily s/r zone.
Strength continues and we are watching for a repeat of the same pattern where the market lifts to the next Fib level and consolidates. The next blue Fib level is where we are looking for a potential target and watching for a more significant pull back to start from. A significant pull back could occur at any time, however Fib levels and indicator strength continue to give us a positive bias until something changes.
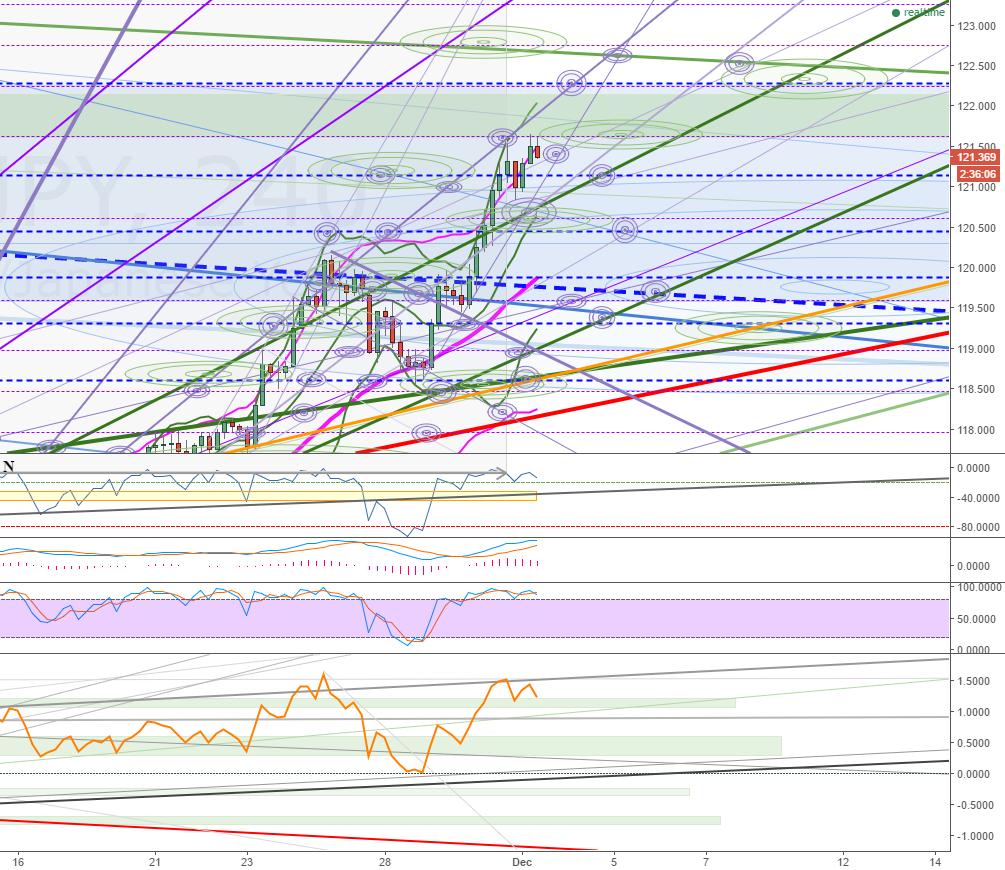
Daily
The current daily bar can be seen to open on a blue Fib level and spiking up to a purple Fib level. This is the range at the moment for the day, a break above the purple Fib level would have us looking towards our potential target level at the next blue Fib level. This is also the top of the blue weekly long term s/r zone, and the green daily s/r zone.
We can see a significant lift on the daily - this will need to have a correction of some degree at some point. All recent corrections have been within the green channel, a correction of the entire green channel itself is to be watched for. The next Fib levels above the market could be a place for this correction to occur.

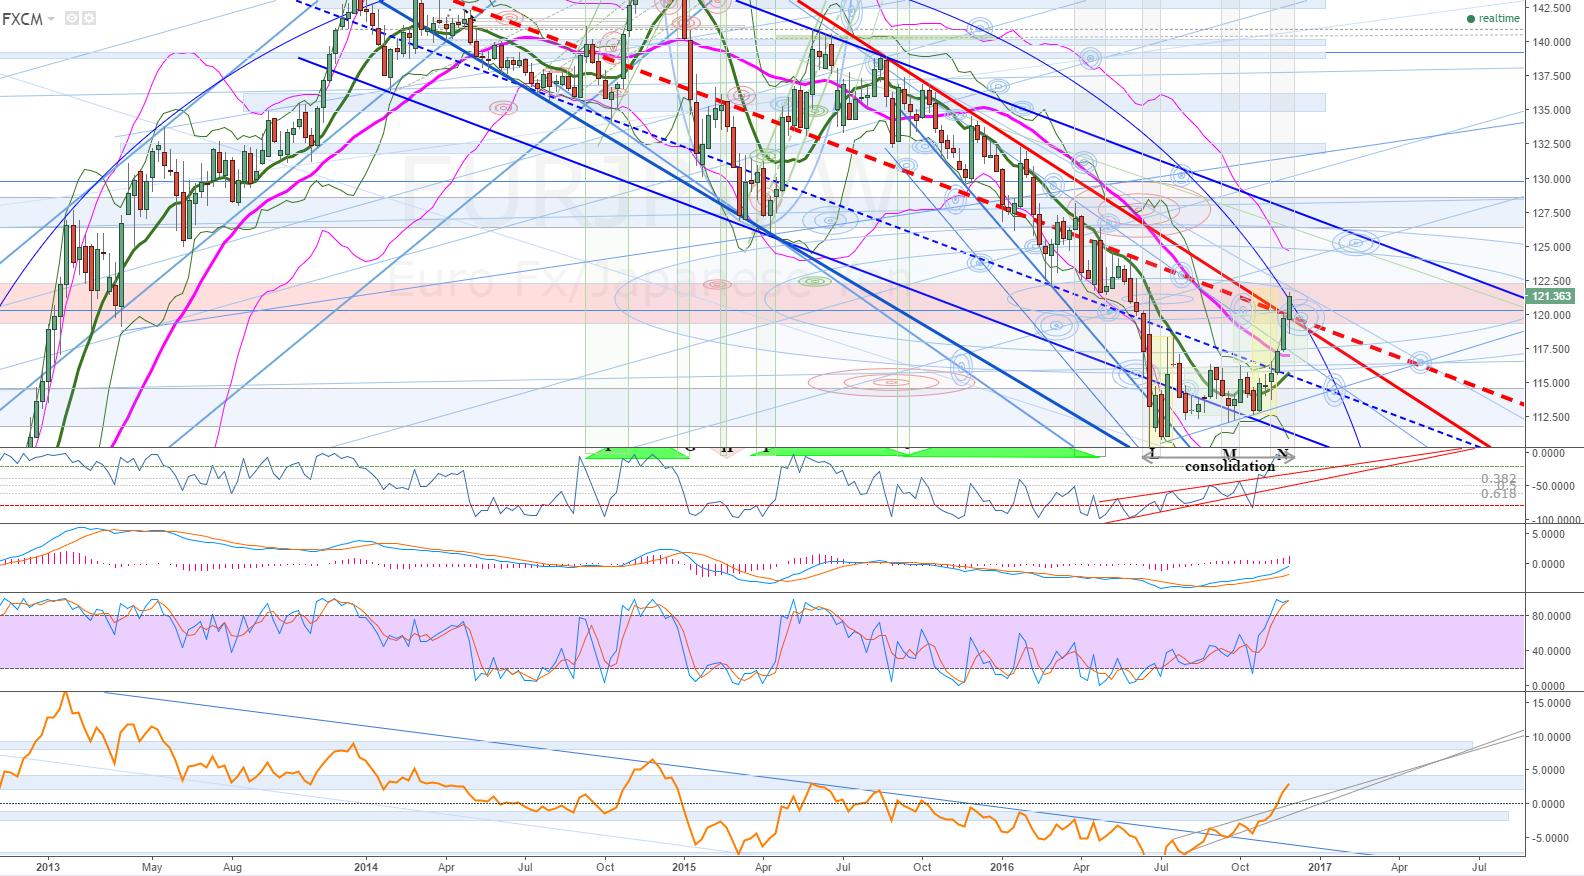
Weekly
We can see a break of the long term weekly (red highlighted) s/r's. The top of the blue s/r zone that we make note of in the daily chart above can be seen here highlighted in red - the market sits just under the top of the zone. IF we do not get a significant correction as noted as a possibility in the daily chart discussion, then we would be looking towards the falling pink UBB as the next target. One Potential path we could see, and it follows the current pattern, is for the weekly bar to finish closer to the top of the red s/r zone (this would need to occur tomorrow); and then the new weekly bar that opens Sunday does so on top of the red highlighted s/r zone, where during next week it lifts to the UBB. This is pure speculation, but something to watch out for. Also expect some retrace into the previous weeks bar (current bar) before the lift to the UBB to start. Again, just speculation based on recent patterns and normal market movement.
Also note the yellow highlighted boxes, they represent the first wave off the very bottom (wave A) and our current wave (wave C). These are now nearly identical in price lift and is something else that warns us that a potential trend shift may occur.
IF resistance is found at any time, a reversal could see a drop back to the 34 and 13 ma's. Strong positive pressure makes this a low probability scenario at the moment, however surprises occur, and the 34ma is likely where the market would move to. It is the likely target for a pull back once the larger trend has finished.