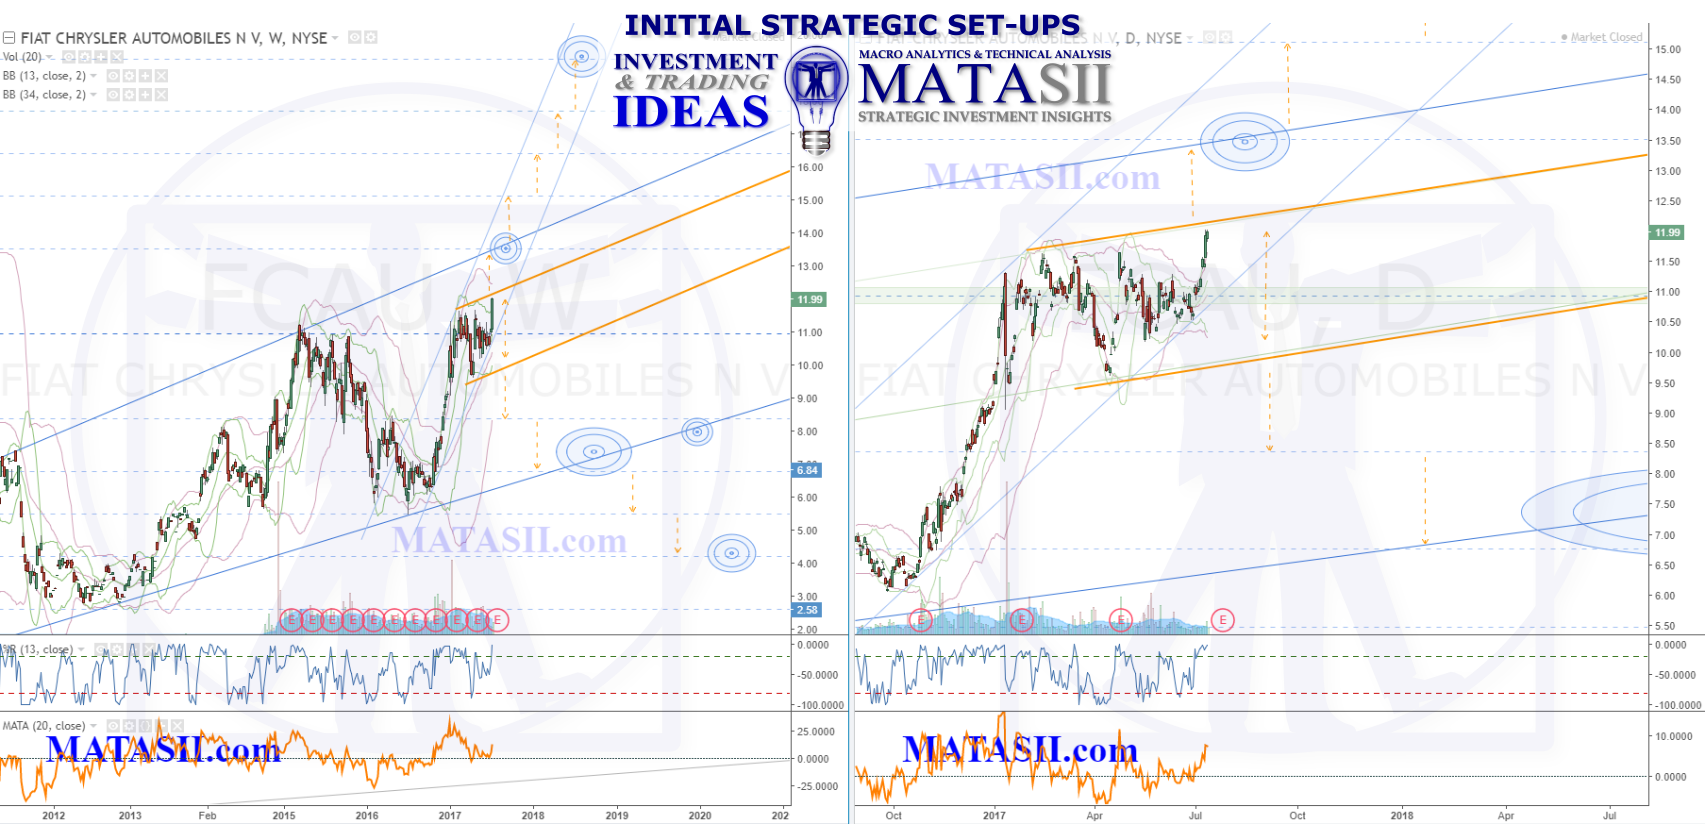
Our MACRO BIAS for the auto industry in general is negative - we don't see it holding up in the long run. When we take a look at FCAU's chart however, we can clearly see a positive trend still under way. The left hand weekly chart shows a long term expanding wedge, with the market currently just short of the patterns resistance. Note the blue dashed horizontal levels, these are Fibonacci ratios and you can see that they do a good job of marking significant support and resistance. IF the market continues its current lift, the next Fibonacci level and the wedge patterns resistance are the next targets above the market to watch for. We would expect some market reaction at these; if they are broken through and support is found from them, then we could see more lift (potentially significant) from this market. We can see a channel highlighted in orange on both the weekly and daily charts, breaking up above this would be our fist warning of potential further lift.
The current lift does look strong, however almost anything could potentially put the brakes on. The current channel resistance that is about to be touched, and then the wedge pattern resistance discussed above, would be the next technical places to watch for a market reversal. Waiting for the support of the current channel, lower orange highlight, would offer less risk for a market reversal confirmation, however any technicals that fail to hold the market offer potential opportunity for further drop down to the next technical.
This holds true for any movement and why our charts can be viewed as a market 'road map'. Orange dashed arrows highlight potential moves from one technical to the next, up or down, and these offer potential opportunities for both long term investments and short term trading strategies.